What makes the wind blow
- Read first
- Air pressure
- Key terms
- Wind, Wind direction, Knot, Anemometer, Gust, Beaufort scale, ASOS, Pressure gradient force, Isobar, Coriolis effect, Coriolis parameter, Rossby number, Geostrophic wind, Gradient wind, Ageostrophic wind, Atmospheric boundary layer, Ekman spiral, Cross-isobar angle, Buys Ballot’s law, Low-level jet, Sea breeze, Land breeze, Valley wind, Mountain wind
Wind is air moving from high pressure toward low pressure, turned by the earth's rotation and slowed by the ground. Three forces decide its speed and direction: the pressure gradient force, the Coriolis effect and friction. This lesson takes each in turn and puts numbers on it from one real storm, the great Midwest cyclone of October 26, 2010, whose sea-level pressure fell below 960 hPa over northern Minnesota: its isobars, its surface winds at 477 airports and nine Great Lakes buoys, and the balloon winds above it. It ends with the daily cycle of the wind at Dodge City, Kansas, the local winds of coasts and valleys, and the strongest winds ever measured.

- What wind is and how it is measured: the 2-minute average, gusts, direction "from," units and the Beaufort scale.
- The pressure gradient force, worked out from a real surface analysis.
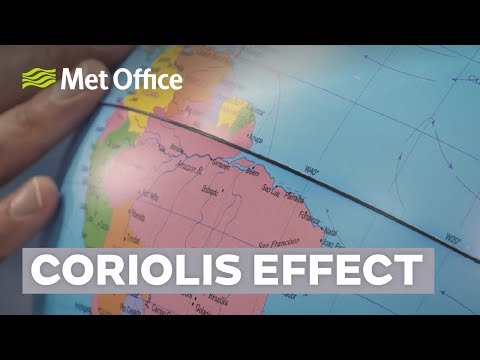
- The Coriolis effect: why it exists, how large it is at each latitude, and why it does not drain sinks.
- Geostrophic and gradient wind, computed from a real analysis and checked against 652 balloon winds.
- Friction and the boundary layer: how far the wind turns across the isobars over land and over the Great Lakes, measured.
- The daily cycle, local winds and the records.
What wind is
The American Meteorological Society defines wind as "air in motion relative to the surface of the earth." Because vertical motion is small near the ground, "meteorologists use the term to denote almost exclusively the horizontal component. Vertical winds are usually identified as such."[1] A wind has a speed and a direction, and the direction follows a convention that confuses nearly everyone at first: wind direction is "the direction from which the wind is blowing."[1] A north wind blows from the north toward the south. The World Meteorological Organization measures it "clockwise from geographical north, namely, true north," so 90° is an east wind, 180° a south wind and 270° a west wind.[4]
Speeds come in four units. US weather reports use the knot, one nautical mile per hour, which the AMS gives as "1.1508 statute miles (1.852 km) per hour or 1.687 ft (0.5144 m) per second."[1] Forecasts for the public use miles per hour, science uses meters per second, and most of the world's public forecasts use kilometers per hour.
| Unit | Where it is used | In knots | In meters per second |
|---|---|---|---|
| Knot (kt) | Observations, aviation, marine forecasts, upper-air charts | 1 | 0.5144 |
| Meter per second (m/s) | Science, the WMO, most of this lesson's arithmetic | 1.944 | 1 |
| Mile per hour (mph) | US public forecasts and warnings | 0.869 | 0.447 |
| Kilometer per hour (km/h) | Public forecasts in most other countries | 0.540 | 0.278 |
Conversions from the AMS definition of the knot and the international mile. For quick work, a speed in meters per second doubles to roughly knots, and a speed in knots adds about 15 percent to become miles per hour.
How wind is measured
An anemometer is "the general name for instruments designed to measure either total wind speed or the speed of one or more linear components of the wind vector," and those in common meteorological use "include the cup, propeller, Pitot-tube, hot-wire or hot-film, and sonic anemometers."[1] Direction was traditionally read from a wind vane, whose end with "the greater resistance to the motion of air moves to the downwind position."[1]
Height matters, because wind speed increases rapidly with height near the ground. The ASOS User's Guide records that airport wind sensors were once exposed 20 feet up, and that federal siting standards now specify "a height of 10 meters (32.8 feet)," with "typical ASOS wind sensor heights" of "33 feet or 27 feet, depending on local site-specific restrictions."[2] The WMO's Beaufort equivalents below are likewise given "at a standard height of 10 m above open flat ground."[4] The guide describes the cup-and-vane sensor of the 1990s; the National Weather Service's current ASOS sensor page is headed "Ultrasonic Ice Free Wind Sensor," and the averaging it describes is the same.[3]
- The reported wind
- A 2-minute average. ASOS measures once a second, forms 5-second averages, and "every 5 seconds a running 2-minute average wind (direction and speed) is computed." A 2-minute average of 2 knots or less is reported as calm.[2]
- Gusts
- A gust is "a sudden, brief increase in the speed of the wind," usually lasting "less than 20 s."[1] ASOS reports the greatest 5-second average of the past 10 minutes when it beats the current 2-minute average by 3 knots or more and the lowest 5-second speed of the period by 10 knots or more. "The minimum gust speed reported by ASOS is 14 knots."[2]
- Peak wind
- "The greatest 5-second average wind exceeding 25 knots which has been observed since the previously scheduled hourly METAR," added to the hourly report as a remark.[2]
- Direction
-
Reported to the nearest 10°, relative to true north in the coded report, "e.g., 274 degrees is
reported as 270 degrees."[2]
The coded group
24010G20KTreads 240° at 10 knots, gusting to 20.
The rest of the world averages differently. The WMO's guide asks that "wind speed and direction for synoptic reports should represent an average over 10 min," warns that "1 min 'averages' should be described as long gusts," and settles on a gust duration of about 3 seconds, long enough, it says, to "engulf structures of ordinary suburban/urban size."[4] A 2-minute US wind and a 10-minute wind from another country's station are not the same quantity, and the shorter average reads a little higher in gusty air.
- 2-minute average, each minute
- Peak 5-second gust, each minute
- Hourly report: wind
- Hourly report: gust
Table: the hourly reports (METAR), Minneapolis-St. Paul, October 26, 2010
| Time, CDT | Direction, degrees | Speed, knots | Gust, knots |
|---|---|---|---|
| 10:53 am | 240 | 16 | 24 |
| 11:53 am | 230 | 19 | 32 |
| 12:53 pm | 240 | 22 | 33 |
| 1:53 pm | 240 | 22 | 33 |
| 2:53 pm | 240 | 20 | 35 |
| 3:53 pm | 230 | 20 | 36 |
The Beaufort scale
Before anemometers were common, wind was estimated by eye. The Beaufort scale is "a system of estimating and reporting wind speeds using a numerical scale ranging from 0 (calm) to 12 (hurricane)," invented "in the early nineteenth century by Admiral Beaufort of the British Navy and was originally based on the effects of various wind speeds on the amount of canvas that a full-rigged frigate of the period could carry."[1] Its governing form today is the WMO's table of wind speed equivalents, which the WMO guide gives for use "when the instrumentation is temporarily out of operation or when it is not provided."[4]
| Force | Description | Knots | m/s | mph | Specification for estimating speed over land |
|---|---|---|---|---|---|
| 0 | Calm | <1 | 0 to 0.2 | <1 | Calm; smoke rises vertically |
| 1 | Light air | 1 to 3 | 0.3 to 1.5 | 1 to 3 | Direction of wind shown by smoke drift but not by wind vanes |
| 2 | Light breeze | 4 to 6 | 1.6 to 3.3 | 4 to 7 | Wind felt on face; leaves rustle; ordinary vanes moved by wind |
| 3 | Gentle breeze | 7 to 10 | 3.4 to 5.4 | 8 to 12 | Leaves and small twigs in constant motion; wind extends light flag |
| 4 | Moderate breeze | 11 to 16 | 5.5 to 7.9 | 13 to 18 | Raises dust and loose paper; small branches are moved |
| 5 | Fresh breeze | 17 to 21 | 8.0 to 10.7 | 19 to 24 | Small trees in leaf begin to sway, crested wavelets form on inland waters |
| 6 | Strong breeze | 22 to 27 | 10.8 to 13.8 | 25 to 31 | Large branches in motion; whistling heard in telegraph wires; umbrellas used with difficulty |
| 7 | Near gale | 28 to 33 | 13.9 to 17.1 | 32 to 38 | Whole trees in motion; inconvenience felt when walking against the wind |
| 8 | Gale | 34 to 40 | 17.2 to 20.7 | 39 to 46 | Breaks twigs off trees; generally impedes progress |
| 9 | Strong gale | 41 to 47 | 20.8 to 24.4 | 47 to 54 | Slight structural damage occurs (chimney pots and slates removed) |
| 10 | Storm | 48 to 55 | 24.5 to 28.4 | 55 to 63 | Seldom experienced inland; trees uprooted; considerable structural damage occurs |
| 11 | Violent storm | 56 to 63 | 28.5 to 32.6 | 64 to 72 | Very rarely experienced; accompanied by widespread damage |
| 12 | Hurricane | 64 and over | 32.7 and over | 73 and over |
Speeds are the equivalents at 10 m above open flat ground, and the descriptions are the WMO's own, from Table 5.1 of its Guide to Instruments and Methods of Observation.[4] The Minneapolis wind in the figure above, 20 knots gusting to 36, was force 5 by its average and force 8 in its gusts.
A day with a tight gradient
The examples in the rest of this lesson come from one storm. A low tracked northeast from the Plains on October 25, 2010 and crossed Minnesota on the 26th. The National Weather Service office in Milwaukee recorded that it set Wisconsin's record low pressure, 961.3 millibars at Superior, and that "Bigfork had a minimum sea level pressure of 955.2 millibars (28.21") at 5:13 PM CDT," a Minnesota record.[11] The barograms of the same storm are in the air pressure lesson. In the North American Regional Reanalysis (NARR), the 32 km analysis used here, the center deepened from 980 hPa at 7 pm CDT on the 25th to 959 hPa at 10 pm on the 26th. Computed here.[7]
- Airport (ASOS) wind
- Great Lakes buoy wind
Table: the plotted winds, 18 UTC October 26, 2010
| Station | Direction, degrees | Speed, knots | Gust, knots | Geostrophic wind, knots | Geostrophic direction | Turned toward low, degrees |
|---|---|---|---|---|---|---|
| 45001 (buoy) | 103 | 31 | 37 | 47 | 162 | 59 |
| 45002 (buoy) | 210 | 32 | 41 | 40 | 211 | 1 |
| 45003 (buoy) | 139 | 27 | 33 | 54 | 180 | 41 |
| 45004 (buoy) | 110 | 32 | 40 | 53 | 170 | 60 |
| 45006 (buoy) | 194 | 19 | 24 | 30 | 157 | -37 |
| 45007 (buoy) | 217 | 30 | 37 | 54 | 263 | 46 |
| 45008 (buoy) | 151 | 25 | 30 | 51 | 198 | 47 |
| 46D | 300 | 35 | 43 | 66 | 335 | 35 |
| 9V9 | 310 | 32 | 47 | 53 | 321 | 11 |
| ABR | 290 | 31 | 46 | 65 | 313 | 23 |
| AIG | 200 | 23 | 38 | 52 | 245 | 45 |
| ANJ | 140 | 20 | 30 | 62 | 188 | 48 |
| ATY | 280 | 30 | 44 | 70 | 311 | 31 |
| AZO | 220 | 31 | 39 | 44 | 263 | 43 |
| BBW | 300 | 30 | 39 | 44 | 303 | 3 |
| BMI | 230 | 27 | 53 | 258 | 28 | |
| BRD | 260 | 17 | 24 | 56 | 295 | 35 |
| CAD | 220 | 25 | 33 | 46 | 227 | 7 |
| CAV | 260 | 28 | 36 | 63 | 279 | 19 |
| CCY | 250 | 24 | 31 | 68 | 270 | 20 |
| CDJ | 260 | 14 | 27 | 42 | 269 | 9 |
| CIN | 260 | 26 | 36 | 54 | 281 | 21 |
| CKN | 310 | 24 | 30 | 54 | 337 | 27 |
| CMX | 180 | 15 | 26 | 45 | 170 | -10 |
| CNK | 290 | 24 | 36 | 43 | 288 | -2 |
| COU | 260 | 21 | 33 | 46 | 264 | 4 |
| CVG | 240 | 13 | 24 | 43 | 243 | 3 |
| DAY | 230 | 13 | 55 | 248 | 18 | |
| DBQ | 240 | 23 | 29 | 70 | 261 | 21 |
| DKB | 230 | 27 | 40 | 57 | 265 | 35 |
| DLH | 180 | 19 | 24 | 37 | 200 | 20 |
| DTW | 220 | 18 | 51 | 216 | -4 | |
| DVN | 240 | 28 | 37 | 55 | 261 | 21 |
| EFT | 230 | 26 | 41 | 69 | 262 | 32 |
| EGV | 200 | 13 | 21 | 43 | 232 | 32 |
| ELO | 130 | 18 | 24 | 29 | 183 | 53 |
| ENL | 220 | 17 | 22 | 43 | 248 | 28 |
| ERY | 120 | 20 | 35 | 54 | 189 | 69 |
| EVV | 210 | 12 | 26 | 341 | 131 | |
| FDY | 210 | 16 | 25 | 59 | 234 | 24 |
| FFL | 250 | 28 | 36 | 47 | 263 | 13 |
| FFX | 220 | 35 | 42 | 46 | 256 | 36 |
| FNB | 280 | 24 | 34 | 42 | 273 | -7 |
| FRM | 270 | 29 | 41 | 71 | 284 | 14 |
| FSD | 290 | 30 | 41 | 55 | 295 | 5 |
| FWA | 240 | 22 | 30 | 45 | 271 | 31 |
| GLR | 150 | 23 | 34 | 55 | 196 | 46 |
| GPZ | 330 | 4 | 16 | 188 | ||
| GRI | 280 | 26 | 38 | 45 | 297 | 17 |
| GUS | 230 | 23 | 32 | 59 | 286 | 56 |
| GYL | 240 | 19 | 31 | 72 | 286 | 46 |
| HCO | 10 | 8 | 44 | 5 | -5 | |
| HDE | 280 | 27 | 37 | 38 | 297 | 17 |
| HUF | 240 | 14 | 23 | 36 | 283 | 43 |
| ICL | 270 | 21 | 28 | 43 | 272 | 2 |
| IIB | 250 | 22 | 35 | 66 | 266 | 16 |
| IMT | 170 | 12 | 25 | 48 | 215 | 45 |
| IND | 230 | 19 | 27 | 55 | 323 | 93 |
| INL | 70 | 11 | 19 | 22 | 129 | 59 |
| IRK | 240 | 20 | 28 | 44 | 267 | 27 |
| IWD | 200 | 17 | 26 | 30 | 223 | 23 |
| JKJ | 300 | 33 | 41 | 67 | 317 | 17 |
| JXN | 230 | 20 | 30 | 43 | 241 | 11 |
| LNK | 290 | 18 | 36 | 44 | 286 | -4 |
| LRJ | 280 | 27 | 41 | 51 | 287 | 7 |
| LWD | 250 | 17 | 26 | 46 | 273 | 23 |
| MBS | 170 | 17 | 26 | 44 | 214 | 44 |
| MCI | 280 | 12 | 24 | 42 | 270 | -10 |
| MCK | 290 | 21 | 32 | 38 | 303 | 13 |
| MHE | 290 | 31 | 43 | 48 | 306 | 16 |
| MIW | 260 | 28 | 41 | 63 | 268 | 8 |
| MML | 280 | 39 | 46 | 70 | 298 | 18 |
| MOX | 280 | 33 | 45 | 67 | 307 | 27 |
| MTO | 240 | 16 | 25 | 63 | 241 | 1 |
| OLU | 290 | 25 | 34 | 46 | 291 | 1 |
| ONA | 230 | 10 | 21 | 74 | 265 | 35 |
| OTG | 270 | 36 | 43 | 66 | 293 | 23 |
| OXV | 260 | 32 | 40 | 52 | 267 | 7 |
| P53 | 200 | 22 | 43 | 50 | 195 | -5 |
| PCZ | 200 | 25 | 30 | 61 | 249 | 49 |
| PKD | 290 | 23 | 29 | 60 | 318 | 28 |
| RCX | 200 | 25 | 30 | 50 | 233 | 33 |
| RNH | 230 | 26 | 31 | 68 | 271 | 41 |
| RRT | 30 | 14 | 17 | 24 | 70 | 40 |
| RYV | 210 | 28 | 36 | 63 | 259 | 49 |
| SBM | 210 | 35 | 48 | 60 | 253 | 43 |
| SDF | 240 | 12 | 19 | 48 | 256 | 16 |
| SPI | 240 | 24 | 33 | 45 | 254 | 14 |
| STC | 260 | 22 | 38 | 79 | 292 | 32 |
| SUS | 260 | 27 | 37 | 46 | 260 | 0 |
| TOB | 240 | 33 | 39 | 73 | 275 | 35 |
| TQE | 270 | 30 | 39 | 48 | 278 | 8 |
| UIN | 250 | 23 | 33 | 44 | 260 | 10 |
| VOK | 230 | 24 | 40 | 68 | 255 | 25 |
| VPZ | 230 | 32 | 45 | 55 | 277 | 47 |
| Y70 | 200 | 18 | 31 | 42 | 247 | 47 |
| YKN | 280 | 30 | 44 | 50 | 292 | 12 |
The map shows everything the next sections explain. The winds circle the low counterclockwise. They are strongest where the isobars are closest together. And none of them blows exactly along the isobars: every barb is turned some way toward the low. At Faith, South Dakota (D07) the wind was from 300° at 39 knots, gusting to 53. At Bismarck it gusted to 51 knots and at Fargo to 42.
The pressure gradient force
The pressure gradient force is "the force due to differences of pressure within a fluid mass."[1] Air with higher pressure on one side than the other is pushed toward the lower pressure, at right angles to the isobars. Per unit mass the force is
F = (1/ρ) Δp/Δn
where ρ is the air's density and Δp/Δn is how fast pressure changes across the isobars. In words: the closer the isobars, the harder the push, and the same pressure difference pushes thin air harder than dense air.
At Minneapolis-St. Paul at 1 pm on October 26 the analyzed sea-level pressure fell by 4.99 hPa per 100 km toward the low, about the spacing of the 4 hPa isobars on the map: one every 80 km. With the air's density from the airport's own pressure and temperature, 1.214 kg/m³, the force is
(1/1.214) × 499 Pa / 100,000 m = 0.0041 m/s²
That is small, four ten-thousandths of gravity, but it acts all the time. On its own it would take air from rest to 40 m/s (78 knots) in under three hours. Computed here. The vertical pressure gradient is vastly larger, "approximately 10,000 times greater than the horizontal component," in the AMS glossary's words, but it is balanced by gravity, as the air pressure lesson shows.[1] The wind is the response to the small horizontal remainder. Something must stop the air from accelerating without limit, and on the scale of weather maps that something is the earth's rotation.
The Coriolis effect
The earth turns once a day beneath the air. Seen from the ground, anything moving over it appears to be pushed sideways. The AMS defines the Coriolis force as "an apparent force on moving particles in a noninertial coordinate system," one "required if Newton's laws are to be applied in this system." It "acts as a deflecting force, normal to the velocity, to the right of the motion in the Northern Hemisphere and to the left in the Southern Hemisphere. It cannot alter the speed of the particle."[1]
A physical picture helps. Air at rest over Kansas is carried east by the earth's rotation at about 360 m/s, the speed of the ground at 39° N. If the air moves north, toward latitudes where the ground travels east more slowly, it keeps its eastward speed and runs ahead of the ground beneath it: seen from the ground, it turns right. Moving south, it arrives over faster ground, lags and again turns right. The same holds for eastward and westward motion through the centrifugal effect of the earth's spin, and the AMS's full expression covers every direction.
The horizontal Coriolis force per unit mass is fV, where V is the wind speed and f is the Coriolis parameter, "twice the component of the earth's angular velocity about the local vertical, 2Ω sinφ, where Ω is the angular speed of the earth and φ is the latitude."[1] The earth turns once a sidereal day, so Ω = 7.292 × 10⁻⁵ per second.
| Latitude | Coriolis parameter f, per second | Coriolis force on a 20 m/s wind, m/s² | Inertial period |
|---|---|---|---|
| 0° (equator) | 0 | 0 | none |
| 10° | 2.53 × 10⁻⁵ | 0.00051 | 68.9 h |
| 20° | 4.99 × 10⁻⁵ | 0.00100 | 35.0 h |
| 30° | 7.29 × 10⁻⁵ | 0.00146 | 23.9 h |
| 40° | 9.38 × 10⁻⁵ | 0.00188 | 18.6 h |
| 45° | 1.03 × 10⁻⁴ | 0.00206 | 16.9 h |
| 50° | 1.12 × 10⁻⁴ | 0.00223 | 15.6 h |
| 60° | 1.26 × 10⁻⁴ | 0.00253 | 13.8 h |
| 90° (pole) | 1.46 × 10⁻⁴ | 0.00292 | 12.0 h |
Computed here. The inertial period, 2π/f, is the time air set moving with nothing but the Coriolis force acting on it takes to turn a full circle, "with constant speed and a velocity vector that constantly veers to the right in the Northern Hemisphere."[1] At 45° that is 17 hours. The deflection is slow: over a few minutes it hardly shows, over a day it dominates. That is why it governs weather systems and not much smaller motions. The AMS makes the point: "its importance in any given atmospheric motion may be judged from the representative speed and duration of the motion."[1] The Rossby number, U/(fL), makes it exact: for a 10 m/s wind in a system 1,000 km across at 45° it is 0.1, and rotation rules; for the same wind in a thunderstorm 10 km across it is 10, and rotation hardly matters. Computed here.
It follows that the Coriolis effect does not decide which way a sink drains. Water moving 10 cm per second at 45° feels a Coriolis acceleration of 1.0 × 10⁻⁵ m/s², about one millionth of gravity, for the few seconds it takes to cross the basin. Computed here. Thomas Humphrey of the Exploratorium in San Francisco, answering the question for Scientific American, put it this way: "Coriolis acceleration at mid-latitudes is about one ten-millionth the acceleration of gravity. Because it is a very small acceleration, it needs a very long distance for it to produce an appreciable curvature ... A toilet or sink is just not large enough." The direction comes instead from the basin's shape and from currents left over from filling it, which "can take more than a day" to die away, in the words of the physicist Robert Ehrlich in the same article.[12]
Geostrophic balance
Put the two forces together. Air starts toward low pressure, the Coriolis force turns it to the right, and it keeps turning until the two forces point in opposite directions and cancel. The wind that results is the geostrophic wind, "that horizontal wind velocity for which the Coriolis acceleration exactly balances the horizontal pressure force." It "is thus directed along the contour lines on a constant-pressure surface (or along the isobars in a geopotential surface) with low elevations (or low pressure) to the left in the Northern Hemisphere and to the right in the Southern Hemisphere."[1]
- Pressure gradient force
- Coriolis force
- Friction
Setting the two forces equal, fV = (1/ρ) Δp/Δn, gives the geostrophic speed at the surface:
Vg = (1/ρf) Δp/Δn
At Minneapolis at 1 pm on October 26, with f = 1.03 × 10⁻⁴ per second at 44.9° N, the 4.99 hPa per 100 km gradient gives a geostrophic wind of 39.9 m/s, 78 knots, from 280°. The airport measured 22 knots from 240°. The next sections account for the difference: over the ground the real wind is not geostrophic. Aloft, where friction is absent, it nearly is.
On a constant-pressure chart the same balance is written with the height of the pressure surface instead of pressure, which removes the density: Vg = (g/f) Δz/Δn, where Δz/Δn is the slope of the surface across its height contours. The air pressure lesson explains why those charts are drawn on pressure surfaces; this is the other reason. At Detroit at 7 am CDT on October 26, the 500 hPa surface fell 29.4 m per 100 km toward the west-northwest. With f = 9.89 × 10⁻⁵ per second at 42.7° N the geostrophic wind is 9.81 × 0.000294 / 0.0000989 = 29.2 m/s, 57 knots, from 211°. The Detroit balloon measured 57 knots from 220°. Computed here from NARR heights and the radiosonde report.[7][9]
- Radiosonde wind at 500 hPa
Table: radiosonde winds at 500 hPa, 12 UTC October 26, 2010, and the geostrophic wind from the NARR heights
| Station | Height, m | Direction | Speed, knots | Geostrophic, knots | Geostrophic direction |
|---|---|---|---|---|---|
| CWMJ | 5,640 | 265 | 29 | 28 | 256 |
| CWPL | 5,500 | 165 | 29 | 38 | 174 |
| CWSE | 5,390 | 350 | 10 | 12 | 13 |
| CYAH | 5,540 | 285 | 14 | 13 | 261 |
| CYJT | 5,580 | 275 | 53 | 43 | 280 |
| CYSA | 5,710 | 260 | 49 | 60 | 268 |
| CYYE | 5,400 | 325 | 7 | 3 | 272 |
| CYYQ | 5,410 | 220 | 34 | 24 | 224 |
| CYZT | 5,420 | 280 | 11 | 15 | 305 |
| K1Y7 | 5,780 | 290 | 53 | 49 | 293 |
| KABQ | 5,640 | 280 | 79 | 88 | 286 |
| KABR | 5,290 | 320 | 15 | 18 | 318 |
| KALY | 5,710 | 255 | 25 | 32 | 250 |
| KAMA | 5,590 | 280 | 83 | 117 | 286 |
| KAPG | 5,740 | 290 | 27 | 31 | 303 |
| KAPX | 5,570 | 215 | 52 | 45 | 211 |
| KBIS | 5,300 | 310 | 18 | 13 | 342 |
| KBMX | 5,790 | 235 | 52 | 55 | 230 |
| KBNA | 5,720 | 235 | 58 | 64 | 240 |
| KBOI | 5,470 | 270 | 36 | 31 | 273 |
| KBRO | 5,850 | 275 | 18 | 13 | 278 |
| KBUF | 5,680 | 250 | 30 | 39 | 235 |
| KCAR | 5,610 | 270 | 33 | 31 | 266 |
| KCHH | 5,730 | 235 | 46 | 36 | 247 |
| KCHS | 5,830 | 275 | 32 | 27 | 277 |
| KCRP | 5,840 | 260 | 23 | 43 | 264 |
| KDDC | 5,470 | 290 | 49 | 70 | 303 |
| KDNR | 5,480 | 300 | 35 | 38 | 282 |
| KDRT | 5,810 | 270 | 38 | 50 | 258 |
| KDTX | 5,630 | 220 | 57 | 57 | 211 |
| KDVN | 5,420 | 210 | 99 | 101 | 207 |
| KEDW | 5,750 | 300 | 67 | 66 | 281 |
| KEPZ | 5,750 | 285 | 67 | 67 | 282 |
| KEYW | 5,870 | 140 | 13 | 17 | 155 |
| KFFC | 5,810 | 245 | 43 | 45 | 233 |
| KFGZ | 5,690 | 280 | 64 | 75 | 284 |
| KFWD | 5,730 | 255 | 67 | 93 | 264 |
| KGGW | 5,350 | 320 | 32 | 29 | 341 |
| KGJT | 5,500 | 275 | 37 | 53 | 301 |
| KGRB | 5,380 | 185 | 55 | 73 | 183 |
| KGSO | 5,780 | 260 | 35 | 36 | 258 |
| KGYX | 5,690 | 260 | 35 | 41 | 266 |
| KIAD | 5,750 | 280 | 32 | 32 | 276 |
| KIAG | 5,682 | 251 | 30 | 35 | 234 |
| KILN | 5,690 | 230 | 58 | 63 | 228 |
| KILX | 5,530 | 205 | 84 | 95 | 223 |
| KINL | 5,380 | 170 | 39 | 55 | 149 |
| KJAN | 5,780 | 235 | 52 | 58 | 246 |
| KJAX | 5,860 | 255 | 20 | 15 | 224 |
| KLBF | 5,380 | 310 | 54 | 64 | 317 |
| KLKN | 5,510 | 300 | 39 | 46 | 283 |
| KLMN | 5,520 | 270 | 65 | 111 | 272 |
| KLZK | 5,680 | 240 | 78 | 86 | 246 |
| KMAF | 5,740 | 270 | 63 | 82 | 274 |
| KMFL | 5,880 | 210 | 5 | 8 | 139 |
| KMFR | 5,490 | 285 | 54 | 59 | 280 |
| KMHX | 5,810 | 290 | 32 | 29 | 269 |
| KMIA | 5,882 | 211 | 5 | 12 | 144 |
| KMPX | 5,310 | 155 | 35 | 42 | 169 |
| KNGP | 5,837 | 258 | 24 | 42 | 265 |
| KNIP | 5,862 | 257 | 20 | 14 | 221 |
| KNKX | 5,810 | 285 | 48 | 49 | 281 |
| KNQX | 5,868 | 138 | 13 | 18 | 154 |
| KOAK | 5,680 | 290 | 74 | 77 | 285 |
| KOAX | 5,330 | 295 | 30 | 38 | 274 |
| KOKX | 5,730 | 205 | 25 | 25 | 239 |
| KOTX | 5,420 | 45 | 12 | 5 | 166 |
| KOUN | 5,590 | 265 | 93 | 143 | 262 |
| KPIT | 5,710 | 240 | 41 | 52 | 224 |
| KREV | 5,580 | 295 | 85 | 74 | 286 |
| KRIW | 5,440 | 310 | 24 | 33 | 282 |
| KRNK | 5,770 | 260 | 44 | 35 | 239 |
| KSGF | 5,530 | 225 | 102 | 153 | 235 |
| KSHV | 5,740 | 255 | 66 | 72 | 261 |
| KSIL | 5,830 | 245 | 39 | 45 | 245 |
| KSLC | 5,490 | 300 | 39 | 46 | 290 |
| KSLE | 5,450 | 285 | 22 | 17 | 292 |
| KTBW | 5,870 | 215 | 8 | 13 | 204 |
| KTFX | 5,410 | 310 | 29 | 35 | 321 |
| KTLH | 5,850 | 230 | 24 | 22 | 217 |
| KTOP | 5,380 | 260 | 52 | 69 | 264 |
| KTUS | 5,770 | 295 | 56 | 50 | 296 |
| KUIL | 5,440 | 320 | 20 | 18 | 327 |
| KUNR | 5,360 | 315 | 30 | 54 | 310 |
| KVBG | 5,770 | 295 | 69 | 64 | 285 |
| KWAL | 5,760 | 290 | 29 | 33 | 299 |
| KXMR | 5,880 | 195 | 11 | 12 | 208 |
| KYUM | 5,780 | 290 | 53 | 50 | 291 |
| MDSD | 5,880 | 320 | 10 | 15 | 61 |
| MMAN | 5,850 | 275 | 21 | 30 | 231 |
| MMGM | 5,840 | 275 | 25 | 32 | 274 |
| MMLP | 5,880 | 330 | 9 | 1 | 256 |
| MMMZ | 5,870 | 355 | 16 | 2 | 276 |
| MMUN | 5,870 | 165 | 6 | 19 | 207 |
| MYNN | 5,870 | 350 | 9 | 7 | 186 |
| PANN | 5,400 | 300 | 8 | 11 | 236 |
| TXKF | 5,870 | 220 | 12 | 12 | 241 |
Testing it against balloon winds
One station agreeing proves little, so every radiosonde wind at 500 and 300 hPa in the four soundings from 7 pm CDT October 25 to 7 am October 27 was set against the geostrophic wind computed from the NARR heights at the balloon's launch site. Of 652 usable winds (a measured speed of at least 10 knots and a geostrophic speed of at least 5 m/s), the median difference in direction was 8°, and 81 percent were within 20°. The median observed speed was 0.93 of the geostrophic. Computed here.[7][9]
- Curving cyclonically (troughs, lows)
- Curving anticyclonically (ridges, highs)
- Nearly straight
- Observed equals computed
Table: observed radiosonde winds against the geostrophic and gradient winds, 500 and 300 hPa, October 26 and 27, 2010
| Flow | Winds | Observed / geostrophic, median | Observed minus geostrophic, mean, m/s | Winds with a gradient-wind solution | Observed / gradient, median | Observed minus gradient, mean, m/s |
|---|---|---|---|---|---|---|
| Cyclonic | 290 | 0.87 | -6.0 | 290 | 1.14 | 3.6 |
| Anticyclonic | 189 | 1.04 | 0.8 | 102 | 0.81 | -5.0 |
| Nearly straight | 140 | 0.91 | -3.6 | 140 | 0.95 | -2.2 |
The scatter has a pattern. In cyclonically curved flow, 290 winds, the median observed speed was 0.87 of geostrophic and the average shortfall 6.0 m/s. In anticyclonically curved flow, 189 winds, it was 1.04, slightly faster than geostrophic. In nearly straight flow, 140 winds, it was 0.91. Computed here. Curvature is the subject of the next section. The largest winds on the chart, up to 162 knots at 300 hPa over Grand Junction, Colorado, belong to the jet stream, the subject of the jet stream lesson.
Curved flow: the gradient wind
Air that follows curved isobars is changing direction, and changing direction takes a net force toward the center of the curve, the centripetal acceleration, "with magnitude V²/R, where V is the speed of the particle and R the radius of curvature of the path."[1] So in curved flow the pressure gradient and Coriolis forces cannot cancel exactly. The balanced wind in that case is the gradient wind: at such points "the Coriolis acceleration and the centripetal acceleration together exactly balance the horizontal pressure force," and "it follows that the cyclonic gradient speed is less than (and the anticyclonic gradient speed is greater than) the geostrophic wind speed for the same latitude and pressure force."[1]
- Pressure gradient force
- Coriolis force
In symbols, for a radius of curvature R that is positive around a low, V²/R + fV = fVg. Around the October 2010 low the effect is large: at 300 km from the center at 45° N, a 40 m/s geostrophic wind corresponds to a gradient wind of 23 m/s. Computed here. That is part of why the winds near the center of a deep low are lighter than its packed isobars suggest.
The same equation sets a limit around highs. For anticyclonic flow it has a real solution only if the geostrophic wind is no more than fR/4, and the gradient wind then cannot exceed fR/2. At 40° N and 500 km from the center of a high, that caps the geostrophic wind at 11.7 m/s and the pressure gradient at about 1.3 hPa per 100 km. Computed here. This is why the isobars near the center of a high are always widely spaced and its winds light, while a low can have gradients many times steeper, like the 5 hPa per 100 km over Minnesota on October 26.
The balloon check shows both the idea and its limits. The measured winds were slower than geostrophic in cyclonic flow and slightly faster in anticyclonic flow, as the gradient wind requires. But the gradient wind computed from the curvature of the analyzed height contours overcorrected: in cyclonic flow the observed winds ran at a median of 1.14 times the computed gradient wind, and in anticyclonic flow 87 of the 189 winds sat where the contour curvature was too tight for any gradient-wind solution. Computed here. The equation needs the curvature of the air's path, as the AMS definition says, and in a moving weather system the paths of the air are straighter than the contours they cross. The waves themselves are the subject of the troughs, ridges and shortwaves lesson, and the spin of curved flow is the subject of the vorticity lesson.
Friction and the boundary layer
Near the ground the balance changes. The lowest part of the atmosphere is the atmospheric boundary layer, "the bottom layer of the troposphere that is in contact with the surface of the earth. It is often turbulent and is capped by a statically stable layer of air or temperature inversion." Its depth ranges "from tens of meters in strongly statically stable situations, to several kilometers in convective conditions over deserts."[1] The AMS calls its old name, the friction layer, "somewhat inappropriate": "in the real atmosphere, turbulent drag, rather than molecular friction, is responsible for reducing wind speeds in the boundary layer."[1] Turbulent eddies carry the slow air near the ground upward and the fast air above downward, and the net effect is a drag on the wind.
Drag slows the wind. A slower wind feels a weaker Coriolis force, which can no longer balance the pressure gradient force, and the wind turns toward low pressure until the pressure gradient, Coriolis and drag forces balance, as in the right half of the balance figure. The angle between the wind and the isobars is the cross-isobar angle, which the AMS notes is "most conspicuous within the friction layer where the wind often has a component from high to low pressure."[1] The classic theory is the Ekman spiral, under which "the wind blows across the isobars toward low pressure, at an angle that is a maximum at the surface and does not exceed 45°."[1] The AMS also cautions that the Ekman layer "is not observed in the earth's atmosphere" in its idealized form, because large eddies and a stable cap shape the real boundary layer.[1]
How large is the angle in fact? Pyykkö and Svensson, comparing climate models with a climatology from more than 800 radiosonde stations, note that the Ekman solution gives 45° "yet, using more realistic assumptions, this angle is found to be lower," that the observed angles form a distribution "quite broad" and skewed toward positive values, and that every model and reanalysis they tested turns the wind too little.[13] They also note that most such studies are over land "due to a lack of suitable observations" over the ocean.[13] The October 2010 storm offers a direct measurement over land and water at once: every airport report and Great Lakes buoy report from October 26 to 28 at the NARR analysis times, each compared with the geostrophic wind from the analyzed sea-level pressure at its site.
- Airports (ASOS), 6,497 reports
- Great Lakes buoys, 150 reports (dashed: their median)
Table: turning toward low pressure and speed as a fraction of geostrophic, October 26 to 28, 2010
| Group | Reports | Median turning, degrees | Middle half, degrees | Median speed / geostrophic |
|---|---|---|---|---|
| All airports | 6,497 | 34 | 22 to 45 | 0.35 |
| Great Lakes buoys | 150 | 33 | 19 to 46 | 0.50 |
| Airports, 1 am CDT | 792 | 38 | 0.29 | |
| Airports, 4 am CDT | 786 | 38 | 0.30 | |
| Airports, 7 am CDT | 801 | 37 | 0.32 | |
| Airports, 10 am CDT | 848 | 30 | 0.34 | |
| Airports, 1 pm CDT | 850 | 27 | 0.45 | |
| Airports, 4 pm CDT | 832 | 30 | 0.47 | |
| Airports, 7 pm CDT | 801 | 33 | 0.39 | |
| Airports, 10 pm CDT | 787 | 36 | 0.33 |
Three results stand out. First, the turning is large: a median of 34° over land, not far below Ekman's 45° and well above what models produce, as Pyykkö and Svensson found. Second, the speed falls much further than the direction turns. The airport winds ran at a median of 0.35 of the geostrophic speed; the buoy winds at 0.50, because open water is far smoother than land. Some of the shortfall near the low is curvature, not friction; the rest is drag. Third, the turning followed the clock. At 1 pm, when sunshine stirred the boundary layer, the median angle over land was 27° and the speed 0.45 of geostrophic; at 1 and 4 am it was 38° and 0.29 to 0.30. The buoys, with 16 to 27 reports at each hour, showed no clear daily cycle. Computed here.
The difference between the real wind and the geostrophic wind has a name, the ageostrophic wind: "the vector difference between the real (or observed) wind and the geostrophic wind."[1] Near the ground it is large and points across the isobars toward low pressure. The same two numbers, turning and speed, explain the Minneapolis report. At 1 pm the geostrophic wind was 78 knots from 280°; the airport measured 22 knots from 240°, 40° toward the low at 0.28 of the geostrophic speed. At buoy 45007, in southern Lake Michigan, the wind was 30 knots from 217° against a geostrophic wind of 54 knots from 263°. Computed here.
The cross-isobar flow matters beyond the station plot. Summed around a low, it carries air inward, toward the center, in the lowest kilometer. That air has to go somewhere, and it rises; how rising air on a large scale is organized is the subject of the lesson on why air rises.
Buys Ballot's law
Geostrophic balance gives a rule that needs no instruments. The AMS states Buys Ballot's law: "if one stands with the back to the wind, the pressure to the left is lower than to the right in the Northern Hemisphere. In the Southern Hemisphere, the relation is reversed." It was "formulated in 1857 by the Dutch meteorologist Buys Ballot and is a qualitative statement of the geostrophic wind relation."[1] Near the ground, where the wind is turned toward low pressure, the low lies to the left and somewhat ahead. At Minneapolis at 1 pm on October 26 an observer with a back to the 240° wind faced east-northeast, 60°, and the low lay north-northwest, at a bearing of 342°: 78° to the left of straight ahead rather than the full 90°. Computed here.
Why afternoons are gusty
The turning angle's daily swing is one sign of a larger rhythm. Over land in fair weather, the AMS notes, the boundary layer "has a marked diurnal cycle. During daytime, a mixed layer of vigorous turbulence grows in depth"; near sunset "turbulence decays, leaving a residual layer," and at night its bottom "is transformed into a statically stable boundary layer by contact with the radiatively cooled surface."[1] By day the mixed layer stirs the momentum of the air a kilometer or more up down to the anemometer. At night the stable boundary layer cuts the ground off from the wind above it. The lapse rates and stability and inversions lessons treat the temperature side of the same cycle.
Table: Dodge City, Kansas, hourly reports, April 2024
| Hour, CDT | Reports | Average speed, knots | Reports with a gust | Average gust when reported, knots | Calm reports |
|---|---|---|---|---|---|
| Midnight | 29 | 10.1 | 21% | 28.7 | 3% |
| 1 am | 29 | 10.2 | 17% | 27.6 | 0% |
| 2 am | 29 | 9.6 | 21% | 24.7 | 3% |
| 3 am | 26 | 9.3 | 8% | 24.5 | 4% |
| 4 am | 27 | 10.2 | 15% | 27.5 | 4% |
| 5 am | 29 | 10.7 | 17% | 28.2 | 3% |
| 6 am | 29 | 10.4 | 14% | 31.0 | 0% |
| 7 am | 29 | 10.6 | 17% | 28.2 | 0% |
| 8 am | 30 | 11.2 | 30% | 25.9 | 0% |
| 9 am | 30 | 13.6 | 47% | 28.8 | 0% |
| 10 am | 30 | 16.0 | 53% | 30.3 | 0% |
| 11 am | 27 | 15.4 | 59% | 29.4 | 0% |
| Noon | 25 | 16.4 | 68% | 27.6 | 0% |
| 1 pm | 29 | 16.2 | 76% | 27.8 | 0% |
| 2 pm | 27 | 16.5 | 81% | 27.9 | 0% |
| 3 pm | 27 | 15.6 | 70% | 28.4 | 0% |
| 4 pm | 30 | 14.9 | 73% | 27.5 | 3% |
| 5 pm | 27 | 16.0 | 70% | 28.8 | 0% |
| 6 pm | 28 | 15.3 | 64% | 26.6 | 0% |
| 7 pm | 28 | 14.2 | 39% | 28.4 | 0% |
| 8 pm | 29 | 10.6 | 21% | 28.2 | 0% |
| 9 pm | 29 | 9.2 | 10% | 33.3 | 3% |
| 10 pm | 29 | 9.9 | 14% | 30.8 | 0% |
| 11 pm | 29 | 10.4 | 17% | 30.2 | 7% |
The wind picks up between 8 and 10 am and drops between 7 and 9 pm, in the hours after sunrise and around sunset, when the mixed layer grows and dies. The gusts follow it more strongly still, because a gust is a parcel of faster air brought down by a turbulent eddy, and the eddies are strongest in the afternoon. The strongest gust of the month, 53 knots, came at 1:52 pm on April 6. Computed here.
At night the wind above does not stop; it speeds up. Cut off from the ground's drag, the air a few hundred meters up accelerates, often past its geostrophic speed, and over the Plains it becomes the low-level jet, which the AMS places in the lowest 2 to 3 km of the troposphere and which at night is "sometimes called a nocturnal jet."[1]
- 7 am CDT (12 UTC), 31 soundings
- 7 pm CDT (00 UTC), 31 soundings
Table: median wind speed by height above the ground, Dodge City soundings, April 2024, knots
| Height, m | 7 am CDT | 7 pm CDT |
|---|---|---|
| 0 | 12.0 | 15.0 |
| 100 | 16.9 | 15.6 |
| 200 | 20.9 | 15.4 |
| 300 | 25.5 | 17.8 |
| 400 | 28.4 | 17.9 |
| 500 | 30.6 | 18.8 |
| 600 | 26.1 | 17.8 |
| 800 | 25.0 | 19.0 |
| 1,000 | 22.1 | 19.0 |
| 1,200 | 22.6 | 18.9 |
| 1,500 | 22.4 | 17.9 |
The morning profile is the decoupled night in one picture: the ground has lost its connection to the wind above, and the jet that formed overnight sits a few hundred meters up. Once the sun rebuilds the mixed layer, that faster air is mixed down, which is why a calm dawn on the Plains so often turns into a windy, gusty late morning.
Sea breezes and valley winds
The same forces drive small winds. Where land and water or mountains and valleys heat unevenly, they build small pressure differences a few kilometers to a few tens of kilometers across, and the air responds. Over such short distances and times the Coriolis force has too little time to act, so these winds blow more nearly straight from high to low pressure.
- The sea breeze "blows from sea to land, caused by the temperature difference when the sea surface is colder than the adjacent land," and as it goes on "the wind develops a component parallel to the coast, owing to the Coriolis deflection."[1] NOAA's JetStream course describes the pressure pattern: heated land forms "a weak low-pressure area called a 'thermal low,'" while air aloft flows back out to sea, closing a circulation.[14] The temperature side of it is in Temperature and heat.
- The land breeze is the reverse, "blowing from land to sea, caused by the temperature difference when the sea surface is warmer than the adjacent land. Therefore, it usually blows by night."[1] It is weaker, JetStream explains, because "the cooling ground inhibits vertical motion" and the nighttime temperature change is shallower.[14]
- The valley wind "ascends a mountain valley (upvalley wind) during the day," and the mountain wind is its "nocturnal, thermally forced" counterpart, "generated by cooling along the mountain slopes."[1] The cold drainage it carries fills the frost hollows described in Temperature and heat.
The strongest winds
| Record | Speed | Where and when | Source |
|---|---|---|---|
| Highest wind gust measured by an anemometer (also the tropical cyclone record) | 113.2 m/s (253 mph, 220 kt) | Barrow Island, Australia, April 10, 1996 | WMO[6] |
| Highest gust, Northern and Western Hemispheres | 103.3 m/s (231 mph) | Mount Washington, New Hampshire, April 12, 1934, at 1,856 m | WMO[6] |
| Highest tornadic wind speed | 135 m/s (302 mph) | Bridge Creek, Oklahoma, May 3, 1999 | WMO[6] |
| Strongest tropical cyclones by maximum sustained wind (tie) | 95 m/s (185 kt, 215 mph) | Typhoon Nancy, September 12, 1961; Hurricane Patricia, October 23, 2015 | WMO[6] |
The WMO's archive lists the Barrow Island gust both as its maximum gust and as the tropical cyclone record, and keeps the tornado figure as a separate category. The Mount Washington gust, set 62 years before Barrow Island's, remains the record for the Northern and Western Hemispheres. The October 2010 storm, for comparison, produced gusts of 53 and 54 knots (61 and 62 mph) at South Dakota airports in the reports used here: force 10 on the Beaufort scale, in wind driven by the pressure gradient of a cyclone over land. Computed here.
Reading the wind on a map
- Find the pressure pattern first. Winds circle lows counterclockwise and highs clockwise in the Northern Hemisphere, and blow hardest where the isobars or height contours are packed.
- Aloft, expect the wind along the contours. Above about a kilometer the wind is close to geostrophic: within 20° of the contours in four cases out of five in the balloon check here.
- At the surface, expect it turned toward the low and slowed. About 30° to 40° across the isobars over land, and at a third to a half of the geostrophic speed, less at night and more on a sunny afternoon.
- Around a deep low, expect less than the gradient suggests; around a high, a little more, but the gradient near a high is never steep.
- Read the direction as "from." A 240° wind comes from the southwest and blows toward the northeast.
- Compare averages with averages. A US 2-minute wind, a 10-minute wind from elsewhere and a gust are three different numbers.
Current winds at thousands of US stations are on the site's Observations page, and coastal and buoy winds are on Marine.
Check yourself
-
A METAR reports
31025G38KT. Where is the wind coming from, how fast, and what does G38 mean?Answer
From 310°, the northwest, at a 2-minute average of 25 knots, with a gust (the highest 5-second average in the past 10 minutes) of 38 knots. On the Beaufort scale that is force 6 by the average and force 8 in the gusts.
-
Two maps show the same pressure gradient, 2 hPa per 100 km, one at 30° N and one at 60° N. Where is the geostrophic wind faster, and by how much?
Answer
At 30° N. The geostrophic speed is inversely proportional to f = 2Ω sin φ, and sin 30° is 0.5 against 0.87 for 60°, so the wind at 30° is about 1.7 times faster.
-
Why is there no geostrophic wind at the equator?
Answer
The horizontal Coriolis force is fV, and f = 0 at the equator. Nothing can balance the pressure gradient force, so the wind there cannot settle into flow along the isobars; air moves more directly from high to low pressure.
-
Why does the surface wind cross the isobars toward low pressure, while the wind at 500 hPa does not?
Answer
Turbulent drag near the ground slows the wind, which weakens the Coriolis force. With the Coriolis force too weak to balance the pressure gradient force alone, the wind turns toward low pressure until pressure gradient, Coriolis and drag balance. At 500 hPa drag is negligible and the wind is nearly geostrophic.
-
On October 26, 2010, airport winds crossed the isobars at a median of 38° at 4 am and 27° at 1 pm. Why the difference?
Answer
In the afternoon, sunshine drives turbulent mixing through a deep boundary layer, bringing fast, less-turned air from above down to the surface. At night a stable layer cuts the ground off from the air above, and the surface wind is slower and turned further.
-
Two systems have isobars equally spaced; one curves around a low, the other around a high. Which has the stronger wind?
Answer
The high. Around a low the net inward force is the pressure gradient force minus the Coriolis force, which makes the wind subgeostrophic; around a high it is the Coriolis force minus the pressure gradient force, which makes it supergeostrophic. The balloon winds in October 2010 ran at 0.87 of geostrophic in cyclonic flow and 1.04 in anticyclonic flow.
-
Standing with your back to the wind in Chicago, where is the low?
Answer
To the left, by Buys Ballot's law, and somewhat ahead of straight left, because the surface wind is turned toward the low.
-
A friend says the Coriolis effect makes toilets flush the other way in Australia. What is the size of the effect?
Answer
About a millionth of gravity for water moving 10 cm per second, far smaller than the effects of the bowl's shape and the jets that fill it. The Coriolis effect matters only for motions that are large and long-lived, like weather systems.
Video



Methods
Pressure and heights are from the NCEP North American Regional Reanalysis, read from NOAA PSL over
OPeNDAP on its 32.463 km Lambert conformal grid; the projection used for the maps and the
gradients reproduces NARR's own latitude and longitude arrays to within 0.006 of a grid cell.
Gradients are centered differences times the map factor, rotated to true north, and interpolated
bilinearly to each station. Surface geostrophic winds use sea-level pressure (smoothed once with a
1-2-1 filter) and the density from each report's own pressure and temperature; winds aloft use the
500 and 300 hPa heights, smoothed twice, and contour curvature is the divergence of the unit
normal to the height contours after twelve passes. Curvature classes: cyclonic above 0.4 and
anticyclonic below −0.4 per 1,000 km. Surface reports are the ASOS routine reports of 13 states
from ND to OH and KS to KY within 20 minutes before or 5 minutes after each 3-hourly analysis
time, and the hourly NDBC reports of nine Great Lakes buoys (45001 to 45008 and 45012); a report
enters the turning statistics if its wind is at least 5 knots and the geostrophic wind at least 5
m/s. Buoy winds are 8-minute averages from anemometers a few meters above the water, not the
2-minute 10 m winds of ASOS, which favors lower speeds on the buoys.[10]
Radiosonde winds at 500 and 300 hPa are from IEM's archive, 00 and 12 UTC October 26 and 27, 2010,
for winds of 10 knots or more where the geostrophic wind is at least 5 m/s; the figure omits the
33 whose direction differed from geostrophic by more than 40°. Gradient winds solve
κV²/f + V − Vg = 0 with κ the contour curvature. Dodge City
statistics use every routine report of April 2024 (CDT) and every 12 and 00 UTC sounding whose
reported wind levels reach 1,500 m above the ground, interpolated in wind components. Coriolis
values use Ω = 7.2921 × 10⁻⁵ per second. The code and data are in the site's repository, in
scripts/learn/what-makes-the-wind-blow.mjs,
scripts/learn/what-makes-the-wind-blow-fetch.mjs and
scripts/learn/what-makes-the-wind-blow-data/. Map outlines are Natural
Earth.[15]
Related
Isobars, pressure surfaces and the storm's barograms are in Air pressure. The stable night and the mixed afternoon are in Lapse rates and stability, and the sea breeze's temperature contrast in Temperature and heat. Wind barbs on a sounding are read in How to read a skew-T. Unfamiliar terms are in the glossary.
Sources
Quotations are verbatim from the source named. Figures and numbers marked "computed here" are described under Methods.
- American Meteorological Society, Glossary of Meteorology, entries wind, wind direction, knot, gust, ageostrophic wind, anemometer, wind vane, Beaufort wind scale, pressure-gradient force, Coriolis force, Coriolis parameter, inertial oscillation, Rossby number, geostrophic wind, centripetal acceleration, gradient wind, atmospheric boundary layer, friction layer, cross-isobar angle, Ekman spiral, Ekman layer, Buys Ballot's law, low-level jet, sea breeze, land breeze, valley wind and mountain wind.
- National Weather Service, Automated Surface Observing System (ASOS) User's Guide, 1998, section 3.2, Wind.
- National Weather Service, ASOS wind sensor.
- World Meteorological Organization, Guide to Instruments and Methods of Observation (WMO-No. 8), Volume I, 2023 edition, Chapter 5, Measurement of surface wind, including Table 5.1, Wind speed equivalents.
- Federal Aviation Administration, Advisory Circular 150/5345-27F, Specification for Wind Cone Assemblies, 2021.
- World Meteorological Organization, World Weather and Climate Extremes Archive, Records of weather and climate extremes, as of January 30, 2024.
- F. Mesinger and coauthors, North American Regional Reanalysis, NCEP; data from NOAA Physical Sciences Laboratory, NCEP North American Regional Reanalysis: 3-hourly sea-level pressure (prmsl) and isobaric heights, October 2010.
- Iowa Environmental Mesonet, Iowa State University, ASOS-AWOS-METAR data download and one-minute ASOS data: 13 states, October 26 to 28, 2010; Minneapolis-St. Paul (MSP) one-minute data, October 26, 2010; Dodge City (DDC), April 2024.
- Iowa Environmental Mesonet, upper-air sounding archive: 500 and 300 hPa, 00 and 12 UTC October 26 and 27, 2010; Dodge City (DDC), April 2024.
- National Data Buoy Center, historical standard meteorological data, buoys 45001 to 45008 and 45012, 2010, and measurement descriptions.
- National Weather Service Milwaukee/Sullivan, Historic low pressure, October 26, 2010.
- Scientific American, Does water flowing down a drain spin in different directions depending on which hemisphere you're in?, January 28, 2001, answers by Fred W. Decker, Robert Ehrlich and Thomas Humphrey.
- Joakim Pyykkö and Gunilla Svensson, Wind Turning in the Planetary Boundary Layer in CMIP6 Models, Journal of Climate 36, 2023, 5727 to 5742.
- NOAA JetStream, The Sea Breeze.
- Natural Earth, 1:50m admin 1, states and provinces, with lakes, public domain.
- Mrmanssss, United States Airport Windsock at 66G Airport, Frankenmuth, MI, Wikimedia Commons, CC0.
- Met Office, What is global circulation? Part Three: The Coriolis effect and winds, YouTube (Met Office - Learn About Weather).
- Met Office, The Coriolis effect in action, YouTube (Met Office - Learn About Weather).
- Royal Meteorological Society, MetLink: The Coriolis Effect, YouTube.
- Djordje Romanic, Geostrophic Wind and Geostrophic Balance, YouTube.

Corrections: contact@weatherovertime.com.
Unit 3: Wind and dynamics
- What makes the wind blow
Pressure gradient, Coriolis and friction, and why wind crosses the isobars near the ground.
- The jet stream
Where the jet stream comes from, how it moves, and what jet streaks do.
- Troughs, ridges and shortwaves
The waves in the upper-level flow and the weather under each part of them.
- Vorticity
Spin in the atmosphere, from the jet stream down to the mesocyclone.
- Why air rises: lift on the large scale
Divergence aloft, warm air advection and the quasi-geostrophic picture of ascent.