Unit 2 · Stability and instability
Inversions and the cap
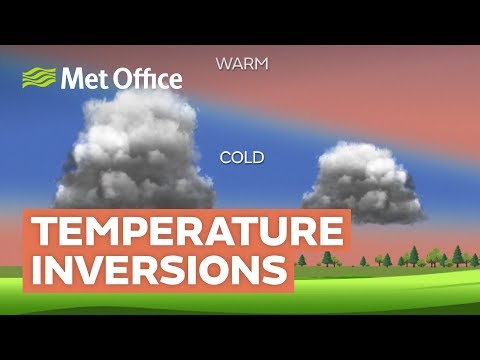
Most of the time the air grows colder with height. An inversion is a layer where it does the opposite, and that reversal changes what the air above and below it can do. Inversions hold fog in valleys, trap a winter's worth of smoke and exhaust over a city, keep the trade-wind clouds of Hawaii below two kilometers, and, over the Great Plains in spring, hold back thunderstorms while the energy for them builds. This lesson takes each kind of inversion in turn, from a clear night in Nebraska to a January cold pool in Salt Lake City, the trade winds over Hilo and an Arctic front over Oklahoma, and then the cap: where it comes from, how forecasters measure it, and what breaks it, on two days at Norman when it broke and when it held.
- What an inversion is, in the words of the American Meteorological Society and the National Weather Service, and why stable air stops mixing.
- Four kinds, four real soundings: a radiation inversion and how the sun removes it, a valley cold pool and its pollution, the trade-wind inversion, and a frontal inversion.
- The cap over the Plains: the elevated mixed layer, where it comes from, and what the research of Carlson, Ludlam, Lanicci and Warner found about it.
- Measuring a cap: CIN, the 700 hPa temperature tested against ten springs of storm reports, and the lid strength index.
- How a cap breaks, and how it holds, on two days at Norman, Oklahoma, and what inversions do to fog, smog, freezing rain and radar.
What an inversion is
The American Meteorological Society defines an inversion broadly, as "a change of an atmospheric property (temperature, pressure, density) with altitude which is opposite to that of the standard atmosphere," and then narrows it to the case meteorologists mean: "a tropospheric temperature inversion, which is a layer in the troposphere in which temperature increases with altitude. This often occurs near the surface as a result of ground radiational cooling."[1] The National Weather Service glossary adds the two positions an inversion can take: "When the layer's base is at the surface, the layer is called a surface-based temperature inversion; when the base of the layer is above the surface, the layer is called an elevated temperature inversion."[2]
An inversion is the most stable layer the atmosphere has. The previous lessons in this unit judged stability by lifting a parcel: in Lapse rates and stability, a layer is stable when a lifted parcel ends up colder than the air around it. A parcel lifted into an inversion cools as it rises while the air around it gets warmer, so it is pushed back down harder than in any other layer. The consequence is that turbulence stops at an inversion. Moisture, heat, smoke and cloud stay below it, and air above it goes its own way. The AMS says so of the inversion at the top of the daytime boundary layer: it "traps surface-induced turbulence and air pollutants below it."[1]
On a skew-T diagram an inversion is a stretch where the temperature trace leans right, toward warmer values, as it goes up. Meteorologists also use the word more loosely. The AMS entry for the capping inversion notes that "although the word 'inversion' implies that temperature increases with height, the word 'capping inversion' is used more loosely for any stable layer (potential temperature increasing with height) at the top of the boundary layer."[1] An isothermal layer, or one that cools only slowly with height, can do the same work.
Four ways to make one
Air can end up warmer above than below in a few ways: the ground can cool the bottom, cold air can drain into a basin, sinking can warm the top, a warmer air mass can slide over a colder one, or air heated over high ground can flow out over lower ground. Each leaves a different signature in the dew point, which is often the quickest way to tell them apart on a sounding.
| Kind | How it forms | Where it sits | Dew point through it | Example here |
|---|---|---|---|---|
| Radiation | The ground loses heat by radiation at night and cools the air above it | At the ground | Varies; fog or dew if the air is moist | North Platte, Nebraska |
| Cold-air pool | Cold air collects in a valley or basin and stays | From the valley floor to near the ridges | Moist below, often with haze or fog | Salt Lake City |
| Subsidence | A deep layer of air sinks and warms by compression | Aloft, often 0.5 to 2 km up | Falls sharply: dry above | Hilo, Hawaii |
| Frontal | Warm air overruns colder, denser air behind a front | Aloft, on the sloping front | Rises with the temperature | Norman, Oklahoma |
| Elevated mixed layer | Hot, deeply mixed air from high terrain flows over moist air at lower elevation | Aloft, over lower ground downwind of high terrain | Falls sharply: dry above | Norman, Oklahoma |
The definitions are the AMS's and the Weather Service's; the dew point column summarizes the soundings in this lesson. The first two kinds are made by cooling from below, the last three by warm air arriving or forming above.
A clear night: the radiation inversion
The AMS defines a radiation inversion as "a relatively cool layer of air, usually adjacent to a ground surface cooled by net loss of radiation, in which the air temperature increases with height," and adds that radiational cooling "is responsible for forming nocturnal stable boundary layers. It is also associated with formation of dew, frost, and fog if the humidity is sufficiently high."[1] The National Weather Service describes its life in one sentence: the surface "cools much more rapidly during radiational cooling conditions than the air just above," so "a temperature inversion can be created overnight, but typically erodes quickly after sunrise."[2] The temperature lesson showed why clear, calm nights cool the most. The balloons launched on either side of such a night show what that cooling leaves behind.
- 7 pm CDT Oct. 9
- 7 am CDT Oct. 10
- 7 pm CDT Oct. 10
- Dry adiabat from the inversion top
Table: North Platte, October 9 to 10, 2024, temperature (°C) by height above ground
| Height, m | 7 pm Oct. 9 | 7 am Oct. 10 | 7 pm Oct. 10 |
|---|---|---|---|
| 0 | 26.8 | 3.8 | 29.8 |
| 50 | 27.7 | 10.2 | 28.6 |
| 100 | 27.9 | 17.0 | 28.2 |
| 200 | 27.1 | 20.3 | 27.5 |
| 300 | 26.1 | 21.2 | 26.6 |
| 400 | 25.1 | 21.9 | 25.6 |
| 500 | 24.2 | 21.8 | 24.7 |
| 750 | 21.7 | 19.5 | 22.4 |
| 1,000 | 19.3 | 17.5 | 20.1 |
| 1,500 | 14.5 | 13.8 | 15.5 |
| 2,000 | 9.7 | 9.5 | 11.5 |
Three things made October 9 to 10 a textbook night. The airport reported a clear sky in every hourly observation from 7 pm to 10 am, and the air at the ground cooled 23 °C between the evening and the morning launch. The wind was calm in 7 of those 15 reports and 1.5 m/s at the morning launch, too light to stir the cold air up. And the air above the ground had been mixed the afternoon before, so above the inversion the temperature fell steadily with height, as it had at 7 pm: the night cooled only the bottom 455 m.
How the sun removes it
The morning sounding says exactly how much heating the inversion needs. Air heated at the ground rises and mixes, and a well-mixed layer follows a dry adiabat. The inversion is gone when the mixed layer from the ground has grown to its top: when air at the ground is warm enough that, lifted dry-adiabatically, it would still be as warm as the top of the inversion. Follow the dry adiabat down from the top, 22.1 °C at 455 m, and it reaches the ground at 26.6 °C (80 °F). The airport passed that temperature in the early afternoon, about six hours after sunrise. The same construction on a skew-T, from a morning sounding and the forecast high, gives the time when fog or smoke trapped under an inversion can begin to mix out.
"Erodes quickly after sunrise" is the Weather Service's summary, and on a day with a strong inversion it can take most of the morning. The rate depends on how much heat is needed (the inversion's strength and depth) and how much the sun supplies (the season, the clouds, and whether the ground is wet or snow-covered). In mid-October in western Nebraska it took until the early afternoon.
The inversion over every afternoon
By afternoon the radiation inversion has become something else: a well-mixed layer, stirred by rising thermals, with a stable layer at its top. The AMS calls that stable layer a capping inversion and describes it as "a ubiquitous feature of the atmospheric boundary layer, formed because the troposphere is statically stable on the average, and because turbulence homogenizes air within the boundary layer, which by conservation of heat requires that a stable layer form at the top of the boundary layer."[1] Its height is the mixing height, which "typically increases during fair-weather daytime over land from tens of meters shortly after sunrise to 1–4 km before sunset, depending on the location and season."[1] Everything released at the ground in the afternoon, from car exhaust to wildfire smoke to water vapor, is spread through that depth and little of it goes higher. The AMS lists "a sharp decrease in pollutant concentration" among the ways the top of the mixed layer is recognized.[1]
Cold pools and dirty air
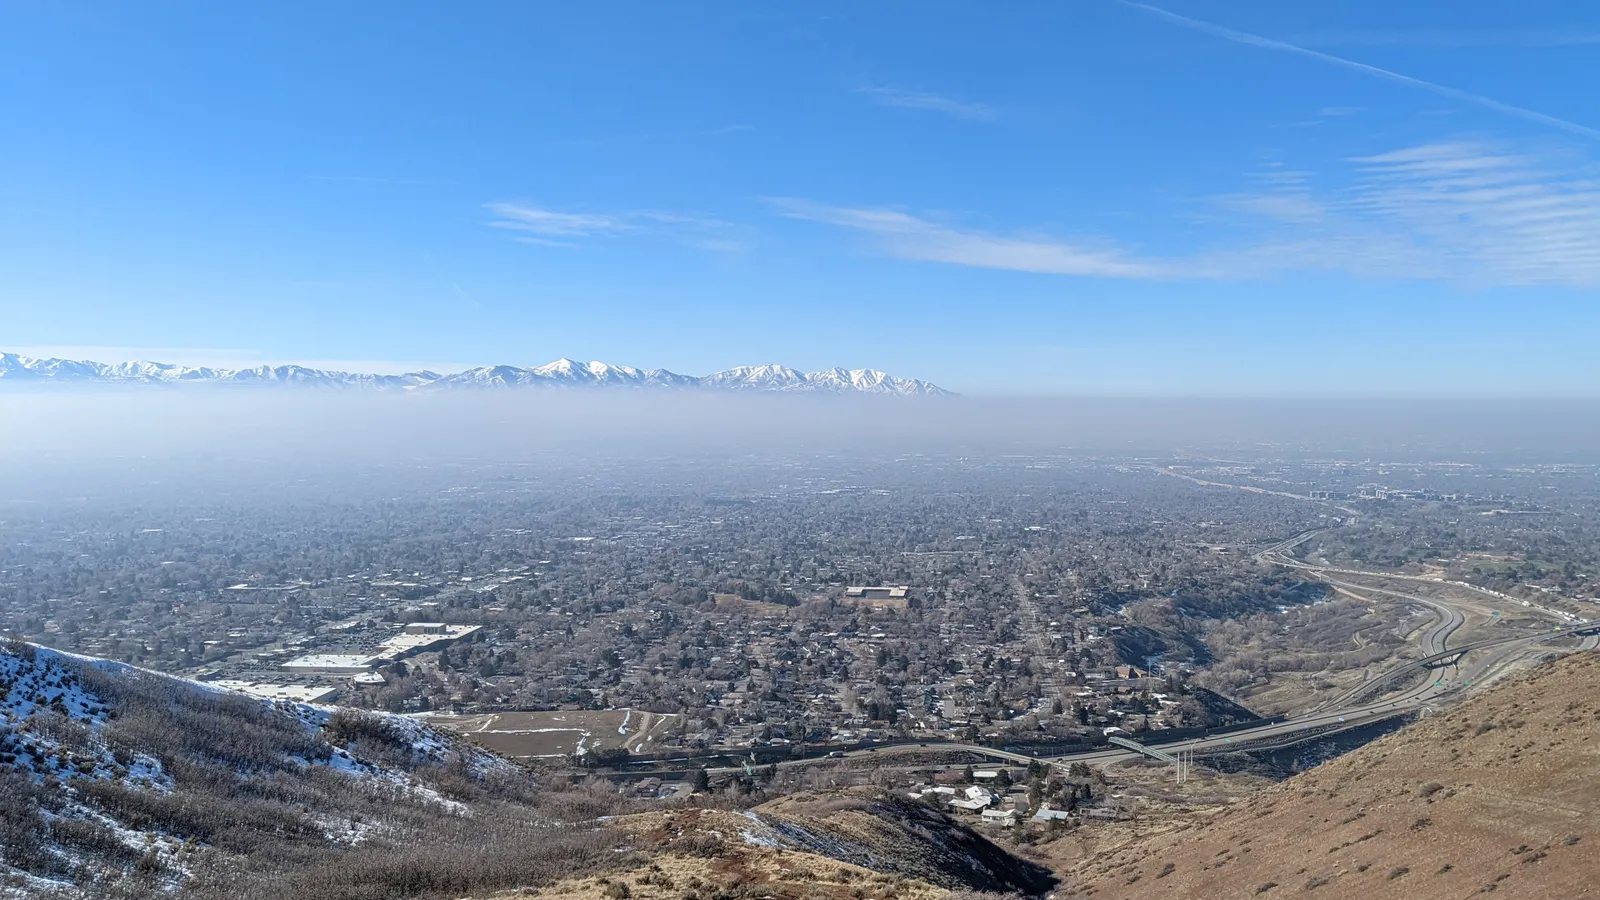
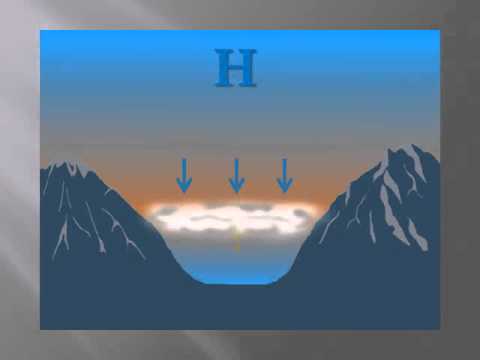
In a valley the cold air made at night does not have to wait for the sun. It drains downhill and collects. The AMS defines a cold-air pool as "a topographic depression, such as a valley or basin, filled with cold air. The cold air is heavy, and settles to the bottom of the depression. This air can remain stagnant, trapped by the surrounding higher terrain, resulting in long periods of poor air quality and fog, depending on the sources of pollution and amount of moisture in the air, respectively."[1] In winter the sun is too weak to heat the valley floor to the temperature of the air above it, and a cold pool can last for days, until a storm or a front brings colder air aloft and wind strong enough to mix it out.
The Salt Lake Valley is the best-known case in the United States. The Utah Division of Air Quality: "In a temperature inversion, the situation 'inverts,' and cold air at the surface gets trapped under a layer of warmer air." "Calm winds, clear skies, and long nights prevent air at higher altitudes from mixing with air closer to the ground," and "the Wasatch Mountains, Oquirrh Mountains, and Traverse Mountain, for example, form a basin that traps cold air in the Salt Lake Valley and shields it from the stronger winds aloft that could clear out inversions." The division counts "about five to six multi-day inversion episodes" in a typical winter and "on average, 18 days with high PM 2.5 levels exceeding the National Ambient Air Quality Standard."[5]
- PM2.5 at or below the 24-hour standard
- Above it
- Inversion strength
Table: Salt Lake City, January 2013. Inversion strength is the warmest temperature within 2 km of the ground minus the temperature at the ground, 12 UTC
| Day | PM2.5, µg/m³ | Ground, °C | Inversion strength, °C | Top, m above ground | 700 hPa, °C |
|---|---|---|---|---|---|
| 1 | 23.0 | −7.3 | 0.0 | −13.5 | |
| 2 | 26.5 | −9.9 | 1.4 | 1,321 | −9.1 |
| 3 | 37.1 | −12.3 | 8.2 | 1,578 | −4.9 |
| 4 | 41.5 | −12.1 | 12.5 | 1,361 | −1.9 |
| 5 | 50.8 | −12.7 | 8.0 | 1,722 | −4.9 |
| 6 | 59.0 | −13.5 | 16.1 | 891 | −0.9 |
| 7 | 51.1 | −10.3 | 10.5 | 824 | −4.3 |
| 8 | 69.2 | −5.1 | 4.0 | 563 | −8.7 |
| 9 | 47.2 | −6.1 | 7.1 | 1,739 | 0.4 |
| 10 | 2.5 | 5.6 | 3.2 | 338 | −0.9 |
| 11 | 2.4 | −5.9 | 0.0 | −17.7 | |
| 12 | 7.9 | −7.5 | 0.0 | −20.3 | |
| 13 | 10.0 | −13.9 | 0.8 | 107 | −23.3 |
| 14 | 15.8 | −16.9 | 2.0 | 208 | −23.3 |
| 15 | 19.2 | −11.1 | 0.0 | −14.9 | |
| 16 | 29.6 | −7.3 | 2.2 | 1,761 | −5.5 |
| 17 | 41.8 | −11.9 | 12.9 | 1,043 | −2.7 |
| 18 | 58.2 | −10.7 | 10.7 | 1,008 | −1.5 |
| 19 | 57.5 | −11.3 | 12.1 | 799 | −1.9 |
| 20 | 45.7 | −10.5 | 10.7 | 825 | −2.7 |
| 21 | 44.5 | −12.5 | 12.5 | 1,078 | −3.1 |
| 22 | 46.8 | −13.9 | 16.9 | 991 | 1.2 |
| 23 | 53.1 | −15.5 | 23.1 | 841 | 4.0 |
| 24 | 53.5 | −7.5 | 15.1 | 653 | −1.5 |
| 25 | 58.8 | −1.9 | 4.7 | 450 | −5.3 |
| 26 | 51.1 | −0.7 | 5.3 | 617 | −2.3 |
| 27 | 11.0 | 0.2 | 1.6 | 198 | −3.5 |
| 28 | 9.4 | −4.7 | 1.4 | 146 | −15.3 |
| 29 | 7.4 | −3.5 | 0.0 | −14.1 | |
| 30 | 12.2 | −3.5 | 1.2 | 331 | −10.5 |
| 31 | 12.8 | 1.4 | 1.6 | 287 | −9.9 |
The chart shows how a cold pool works as a trap. Pollution accumulates from one day to the next while the inversion holds, and falls to a fraction within a day when it ends. On January 9 the concentration was 47.2 µg/m³; on January 10, as warmer air reached the valley floor (5.6 °C at 5 am) and then much colder air arrived aloft (the 700 hPa temperature fell from −0.9 °C that morning to −17.7 °C the next), it was 2.5. The second episode ended the same way: 51.1 on January 26, 11.0 on the 27th. The two series do not move in lockstep. PM2.5 reached its monthly high on January 8, when the morning inversion had weakened to 4.0 °C but was only 563 m deep; the Air Quality Division's rule is that "a strong inversion will confine pollutants to a shallow vertical layer," and a shallow one confines them too.[5]
- Temperature
- Dew point
The same construction as at North Platte gives the scale of the problem. To mix out the January 23 inversion from below, the valley floor would have had to warm to 16.4 °C, the temperature of the dry adiabat through its top; it was −15.5 °C at 5 am, in January, when the sun is low and, as the Air Quality Division notes, snow-covered valley floors reflect heat instead of absorbing it.[5] No winter day supplies 32 °C of heating. A cold pool like this one ends only when the weather aloft changes. The federal standard itself is a three-year statistic: the 24-hour standard for PM2.5 is 35 µg/m³ as "98th percentile, averaged over 3 years," so a single day above 35 is an exceedance of that level, not by itself a violation.[7]
A pollution event of this kind is what the AMS calls an air pollution episode, "an extended period of a high concentration of pollutants in the atmosphere." The word smog, "as originally coined in 1905 by Des Voeux," meant "a natural fog contaminated by industrial pollutants, a mixture of smoke and fog," and the AMS notes that the "sulfur-laden, sometimes deadly, smogs produced by the large-scale combustion of fuel oil and coal" are one of its two great types.[1]
Sinking air: the trade-wind inversion
Air that sinks is compressed and warms at the dry adiabatic rate, about 9.8 °C for every kilometer it descends. When a deep layer sinks, its top has come farther than its bottom and ends up warmer. The AMS: a subsidence inversion is "an increase in temperature with height produced by the adiabatic warming of a layer of subsiding air. This inversion is enhanced by vertical mixing in the air layer below the inversion."[1] The Weather Service adds where: subsidence inversions are "usually associated with subtropical high pressure areas."[2] The marine layer of the California coast in the skew-T lesson is one; the largest is the inversion that caps the trade winds.
The AMS entry for the trade-wind inversion is unusually full. It is "found in large-scale subsiding flows constituting the descent branches of the Hadley cell and Walker circulation." Its base "varies from about 500 m at the eastern extremities of the subtropical highs to about 2000 m at the western and equatorial extremities." "The strength of the inversion varies enormously, occasionally being more than 10°C over 1 km, but sometimes being absent altogether," and "on the average its thickness is about 400 m." Below it the air "is very moist and filled with cumulus clouds (trade cumuli). Above it, the air is warm and exceedingly dry; this structure is so characteristic of the trade current that tropical analysts think of the tropical troposphere as consisting of a lower moist and an upper dry layer."[1]
- Temperature
- Dew point
- Inversion layer
Table: Hilo, 00 UTC July 15, 2024, selected levels
| Pressure, hPa | Height above ground, m | Temperature, °C | Dew point, °C | Wind from, ° | Speed, kt |
|---|---|---|---|---|---|
| 1017.3 | 0 | 27.4 | 18.4 | 48 | 14 |
| 1000 | 150 | 24.4 | 17.4 | 56 | 13 |
| 925 | 827 | 18.5 | 14.7 | 13 | 4 |
| 850 | 1,548 | 14.3 | 13.4 | 318 | 7 |
| 841 | 1,638 | 13.8 | 13.4 | 6 | 5 |
| 828.7 | 1,763 | 17.9 | −0.7 | 59 | 5 |
| 800 | 2,064 | 17.3 | −1.3 | 88 | 12 |
| 700 | 3,189 | 9.8 | −4.7 | 108 | 11 |
| 600 | 4,444 | 3.1 | −35.6 | 93 | 7 |
| 500 | 5,904 | −3.3 | −42.9 | 189 | 1 |
| 400 | 7,631 | −14.4 | −25.3 | 224 | 21 |
That is the whole structure in one balloon: a moist lower layer, a thin, sharp inversion with the dew point collapsing through it, and dry air above. Over a long record the numbers are steady. Cao, Giambelluca, Stevens and Schroeder analyzed the soundings at Hilo and Līhuʻe from 1979 to 2003 and found the inversion present "approximately 82% of the time at each station, with average base heights of 2225 m (781.9 hPa) for Hilo and 2076 m (798.8 hPa) for Līhuʻe." They also found "a diurnal pattern in base height of nighttime high and afternoon low" in summer at Hilo.[8] The afternoon sounding here, with its base at 1,638 m, is on the low side of that average, as their finding would lead one to expect.
Clouds that form in the moist layer meet the inversion and spread beneath it instead of growing through it, which is why the AMS describes the air below as "filled with cumulus clouds (trade cumuli)" and the air above as dry. A subsidence inversion does not have to be tropical: the same process, air sinking under a high, can strengthen a cap over a continent, and Lanicci and Warner found it doing so over the southern Plains in late spring.
Frontal inversions
A front is a sloping boundary between two air masses. The colder, denser one lies beneath as a wedge, and the warmer one rides above it. A balloon launched on the cold side goes up through the cold air, crosses the front and enters the warm air: the AMS calls what it measures a frontal inversion, "a temperature inversion (temperature rising with height) in the atmosphere, encountered upon vertical ascent through a sloping front (or frontal zone)." The Weather Service puts it from the other side: "a temperature inversion that develops aloft when warm air overruns the cold air behind a front."[1][2]
- Temperature
- Dew point
- Frontal inversion
Table: Norman, 12 UTC February 14, 2021, surface and mandatory levels
| Pressure, hPa | Height above ground, m | Temperature, °C | Dew point, °C | Wind from, ° | Speed, kt |
|---|---|---|---|---|---|
| 986 | 0 | −13.5 | −15.8 | 20 | 11 |
| 925 | 478 | −17.9 | −19.2 | 25 | 18 |
| 850 | 1,111 | −16.5 | −18.5 | 40 | 14 |
| 700 | 2,621 | −4.1 | −4.7 | 225 | 43 |
| 500 | 5,195 | −19.7 | −21.8 | 220 | 44 |
| 400 | 6,815 | −31.5 | −34.1 | 215 | 50 |
Three signatures mark a frontal inversion, and all three are on this sounding. The dew point rises through the inversion along with the temperature, the opposite of a subsidence inversion, because the air above the front came from somewhere warmer and moister, not from higher up. The wind changes direction across it, because the two air masses are moving in different directions. And the layer above it is often cloudy, since the warm air is being lifted up the slope of the front.
What falls from such a layer depends on the temperature of the warm air. On February 14 the whole column stayed below 0 °C, so any precipitation would reach the ground as snow. When the air above the front is warmer than 0 °C, it becomes the warm nose that melts snow on the way down and produces sleet or freezing rain, the case read in the skew-T lesson's warm nose sounding from Fort Worth.
The cap over the Plains
On a spring morning over the southern Great Plains the most important inversion is usually aloft, capping a layer of warm, humid air from the Gulf of Mexico. The AMS calls it a lid ("also known as cap, capping inversion, capping layer"): "a thin layer with enhanced static stability separating a layer below possessing large convective available potential energy from a layer above with lower static stability. The presence of a lid is generally accompanied by substantial convective inhibition. Air parcels with insufficient kinetic energy rising into the bottom of a lid will be unable to penetrate it."[1] The Weather Service's description of the cap is the forecaster's version: it "often prevents or delays thunderstorm development even in the presence of extreme instability. However, if the cap is removed or weakened, then explosive thunderstorm development can occur."[2]
Where the lid comes from
The explanation came from T. N. Carlson and F. H. Ludlam in 1968, and from Europe as much as America. Studying severe storms over southern England and the American Midwest, they wrote that "extreme instability arises where small-scale convection is confined to a lowermost 1 or 2 km (leading to an abnormally high wet-bulb potential temperature) beneath a plume of very warm air lying downwind of an extensive arid plateau (Spain or Mexico). The instability is released where the (backed) low-level flow eventually reaches the edge of the restraining plume aloft."[9] In the United States: "In summer ahead of a trough approaching the middle-western U.S.A. a plume of potentially warm air from the Mexican plateau appears similarly to restrain small-scale convection in the moist trade-wind stream of high θw which persistently flows inland from the Gulf of Mexico."[9]
The plume is an elevated mixed layer: the afternoon mixed layer of a high desert, several kilometers deep and mixed to a nearly dry-adiabatic lapse rate, carried east on the westerly wind until it is riding above lower ground. Lapse rates and stability traces one such layer from Albuquerque to Dodge City. Its bottom edge, where hot, dry air sits on cooler, humid air, is the lid. Carlson and colleagues set out the mechanism in 1983: "While capping inversions have often been attributed to subsidence, in this model it is demonstrated that the lid frequently originates from differential advection of a hot, dry mixed layer from an elevated plateau over a cooler, moister layer advected northward ahead of a trough in the westerlies." That stratification "suppresses release of convective instability while, nevertheless, allowing the latent instability of the boundary layer to increase with time."[10]
Carlson and Ludlam also saw that a lid can be too weak. Over France, "the importance of the lid is emphasised by the absence of storms on an otherwise favourable occasion when it was made weak and ineffective by a previous drought over France": the dry, hot ground had mixed the low-level air so deeply that there was nothing left to trap.[9] The cap does two jobs at once. It prevents the many small storms that would otherwise use up the energy as fast as the sun supplies it, and it lets the humid layer grow hotter and moister until the energy stored is very large.
How often, and where
Lanicci and Warner built the climatology from the soundings of four springs, April to June 1983 to 1986, over Kansas, Oklahoma and Texas. They describe the "lid sounding, also known as a type 1 tornado sounding," as "the superposition of a potentially warm, nearly dry-adiabatic elevated mixed layer (EML) over a moist, potentially unstable layer." They found that "a typical lid covers only about 20% to 25% of the southern Great Plains, and that a lid coverage greater than 50% occurred on fewer than 2% of the study days," and that its range grows through the season "primarily caused by the northward expansion of the EML-source region from Mexico into the central Rockies and Great Basin, and a westward shift in the mean low-level moist axis." By late spring, flows "associated with large scale subsidence" can make "the inversion base sink and the lid strengthen downstream from the source region," the opposite of the classic case, in which the lid rises and weakens as a trough approaches.[11]
Their third paper related the lid to storms. It found "a relationship between the occurrence and size of the lid at 1200 UTC and the occurrence and size of subsequent severe-storm events," which "is most well-defined in April and deteriorates rapidly from May to June," and noted that in late spring severe weather also occurs in environments with "uncapped soundings" and even "a subsidence-type sounding that is buoyantly unstable."[12] The lid organizes storms; it does not create them.
Measuring a cap
Three numbers are in common use. Each measures something slightly different.
1. CIN
CAPE, CIN and instability defines convective inhibition and shows how to compute it: the energy a parcel must be given to reach its level of free convection. CIN measures the cap as a particular parcel sees it, so it changes with every degree of heating or moistening at the ground and with the choice of parcel. It is the most complete measure and the most sensitive to the surface observation.
2. The 700 hPa temperature
Forecasters often read the cap straight off the 700 hPa chart, about 3 km up, because over the Plains the warm air of the elevated mixed layer lies at about that level. The Storm Prediction Center's outlook of June 12, 2022 is a typical use: "a major complicating factor, in terms of uncertainty, is expectations for steady mid-level warming via the eastward-advecting elevated mixed layer. 12z Topeka, KS observed sounding featured a 15.2 C 700 mb temperature, while Springfield, MO was 13.6 C."[17] In the 1979 case studies behind the lid strength index, the edge of the lid was located on the 700 hPa chart, where "the 8°-10° C isotherm approximated the edge."[14] A rule of thumb that 700 hPa temperatures of about 12 to 14 °C mark a strong cap on the Plains is widely repeated, but we did not find it stated in a National Weather Service, Storm Prediction Center or peer-reviewed source. So we tested it.
- At least one report
- Five or more
Table: 12 UTC 700 hPa temperature and severe reports, Norman, Dodge City and Amarillo, March to June 2015 to 2024, mornings with most-unstable CAPE of at least 1,000 J/kg
| 700 hPa temperature, °C | Days | At least one report, % | Five or more, % | Median most-unstable CIN, J/kg |
|---|---|---|---|---|
| Below 6 | 55 | 54.5 | 41.8 | −12 |
| 6 to 8 | 67 | 43.3 | 28.4 | −46 |
| 8 to 10 | 89 | 50.6 | 37.1 | −76 |
| 10 to 12 | 114 | 50.0 | 33.3 | −120 |
| 12 to 14 | 113 | 38.1 | 25.7 | −201 |
| 14 or more | 113 | 32.7 | 18.6 | −293 |
The test supports the direction of the rule and not its sharpness. Warmer air at 700 hPa goes with more inhibition, steadily: from 8 °C upward the median CIN grows by half or more with each two degrees. Storm reports fall off too, from about half of the days below 12 °C to 38 percent at 12 to 14 °C and 33 percent above 14 °C; the busy days, with five or more reports, fall from about a third to 19 percent. But a third of the warmest mornings still ended with severe weather within 150 km. Some of those storms formed at the edge of the cap and moved in; some formed where heating or a front removed it during the day; some fed on air above it at night. A 700 hPa temperature says how strong the cap is at one place and time. It does not say whether something will break it.
3. The lid strength index
Carlson's group measured the lid with wet-bulb potential temperature, θw, the temperature air would have if brought to saturation and then down the saturated adiabat to 1000 hPa. In the form Terrance Clark gives, after revisions by Thomas Graziano, the lid strength index has two terms. The first, the lid strength, is the saturation θw at the warmest point of the lid minus the mean θw of the layer 30 to 80 hPa above the ground; the second, the buoyancy, is the saturation θw at 500 hPa minus the same low-level value.[14] The first term is positive when the humid air would be colder than the lid even after condensing; the second is negative when that air would be warmer than the 500 hPa level, like a lifted index. Clark summarizes the case studies: "a critical value of lid strength appears to be around 2°-3° C."[14]
Graziano and Carlson tested the two terms against a season of radar and severe reports. "Lid strength appears to exhibit an effective cutoff value, above which deep convection becomes relatively unlikely, even for unstable values of the buoyancy term." And, less obviously, "for a given value of buoyancy the probability of severe convection increases with increasing lid strength, although the total probability of deep convection diminished with increasing lid strength," which they took to support "the idea that the lid allows high values of θw to form near the surface and that a favorable location for the release of the latent instability is along the lateral boundary of the lid."[13] A strong lid means fewer storms, and the ones that do form are more often severe.
How a cap breaks: April 22, 2001
The Weather Service's description of the cap lists what builds the energy under it: "With the cap in place, air below it can continue to warm and/or moisten, thus increasing the amount of potential instability. Or, air above it can cool, which also increases potential instability."[2] The same processes, carried far enough, remove it. Heating and moistening from below are worked through in CAPE, CIN and instability: the ground warms toward the convective temperature, the surface temperature that, in the AMS's words, is "the lowest temperature to which the surface air must be heated before a parcel can rise dry-adiabatically to its lifting condensation level without ever being colder than the environment."[1] Two other routes act on the cap itself. Along its edge, Carlson's group found, "intense convection may occur along the lid edge partly due to differential advection in which moist boundary layer air flows out from beneath the lid (a process called underrunning), but also as a result of lifting on the cold side of the lid edge zone."[10] And the layer can cool from above.
On April 22, 2001, a deep trough over the Four Corners had carried "a pronounced elevated mixed layer airmass" over the southern Plains, which "resulted in significant capping of the moist boundary layer and strong CIN," according to a study of the day by Gregory Carbin of the Storm Prediction Center and colleagues. "Because there was some uncertainty regarding cap strength and persistence, special 1800 UTC soundings were launched at selected locations. The sounding from OUN showed that dramatic cooling and moistening had occurred in the layer around 700 mb since 1200 UTC."[15]
- Temperature
- Dew point
- Surface parcel
- CIN
- CAPE
Table: Norman, Oklahoma, April 22, 2001, computed here from the Iowa Environmental Mesonet archive
| Sounding | Surface temperature / dew point, °C | 700 hPa, °C | Surface parcel CAPE / CIN, J/kg | Mixed-layer CAPE / CIN, J/kg | Lid strength (term A), °C | Buoyancy (term B), °C |
|---|---|---|---|---|---|---|
| 7 am CDT (12 UTC) | 18.0 / 16.0 | 12.0 | 11 / −607 | 23 / −564 | 8.1 | −0.7 |
| 1 pm CDT (18 UTC) | 22.0 / 17.0 | 6.6 | 806 / −70 | 340 / −159 | 2.8 | −0.8 |
Every measure moved together. The 700 hPa temperature fell 5.4 °C in six hours. The lid strength computed here fell from 8.1 °C to 2.8 °C, at the critical value of the 1979 case studies. The CIN of a surface parcel fell by nearly 90 percent, and of a mixed-layer parcel from −564 to −159 J/kg. With the ground at 22 °C, 3 °C more heating would have removed the surface parcel's inhibition completely. Severe storms were reported in western Oklahoma from 11 am CDT; at 4:08 pm they reached Norman, where hail 1.75 inches across was reported 2 miles west of the city.[16]
Carbin's group expected the cooling to be evaporation, rain from light showers falling through the dry layer. Their model said otherwise. "Horizontal advection was the primary agent of cooling within the CIN layer over OUN": a broad area of rising air "developed shortly after 1200 UTC over southwestern Oklahoma. This process cooled the upstream air and reversed the initial temperature gradient so that ambient wind fields brought in cooler air in the layers where convective inhibition was the largest."[15] They added a caution for forecasters: "rapid and unexpected cap erosion occurs perhaps several times a year over the Great Plains," and "forecast models usually do not simulate this process well."[15]
When the cap holds: June 12, 2022
The test above found 113 spring mornings with 700 hPa temperatures of 14 °C or more and plenty of CAPE; on two-thirds of them, nothing severe happened within 150 km. June 12, 2022 at Norman is one.
- Temperature
- Dew point
- Surface parcel
- CIN
- CAPE
Table: Norman, Oklahoma, June 12, 2022, computed here from the Iowa Environmental Mesonet archive
| Sounding | Surface temperature / dew point, °C | 700 hPa, °C | Surface parcel CAPE / CIN, J/kg | Mixed-layer CAPE / CIN, J/kg | Lid strength (term A), °C | Buoyancy (term B), °C |
|---|---|---|---|---|---|---|
| 7 am CDT (12 UTC) | 24.4 / 19.7 | 16.4 | 1,084 / −1,049 | 776 / −700 | 13.9 | −0.9 |
| 7 pm CDT (00 UTC) | 35.2 / 24.2 | 17.2 | 6,518 / −141 | 4,217 / −240 | 8.5 | −5.0 |
Compare the two afternoons. On April 22, 2001 the surface parcel at 1 pm had 806 J/kg of CAPE and −70 of CIN, and storms followed. On June 12, 2022 at 7 pm it had eight times the CAPE and twice the CIN, and none did. To reach free convection the ground would have had to warm to 40.4 °C with the same dew point, and by the evening launch the day's heating was over. Nothing cooled the cap from above: from 800 to 500 hPa the air was as warm or warmer in the evening, 0.8 °C warmer at 700 hPa and 1.9 °C at 600 hPa. The lid strength computed here was 8.5 °C, about three times the critical value of the case studies. That day the Storm Prediction Center's midday outlook placed its enhanced risk in the northern High Plains and a slight risk from Missouri eastward, and its discussion of the Missouri risk turned on the same elevated mixed layer: storms would "likely regionally favor the cooler side of this notable mid-level thermal gradient," with "potential late-night redevelopment on the eastern edge of the cap."[17]
A cap like this one is not a failed forecast; it is the normal state of a hot Plains summer under a ridge. The energy under it is real, and it is the reason capped days are watched: where the cap does give way, at its edge, along a boundary or under an approaching trough, the storms that form have 5,000 J/kg or more to use.
Fog, smog, freezing rain and radar
- Fog
- Radiation fog forms "when radiational cooling reduces the air temperature to or below its dewpoint," and the AMS lists what favors it: "a shallow surface layer of relatively moist air beneath a dry layer and clear skies" and "light surface winds." It is the radiation inversion made visible, and "often does not dissipate until after sunrise."[1] The mixing-out temperature at North Platte is the same calculation a forecaster uses to time its end.
- Smog
- A cold pool or a strong subsidence inversion keeps what is emitted near the ground in a shallow layer, day after day. Salt Lake City's January 2013 is the example above.
- Freezing rain
- A frontal inversion whose warm air is above 0 °C melts falling snow; a shallow subfreezing layer under it turns the rain to glaze on contact. The skew-T lesson reads one such warm nose.
- Radar
- Radio waves bend too. The AMS: superrefraction, the "greater than normal downward bending of radio waves," is "caused primarily by propagation through layers near the earth's surface in which the dewpoint temperature is rapidly decreasing or the temperature is increasing with height." The result is anomalous propagation, and "AP clutter is an extended region of ground echoes caused by superrefraction."[1] On a clear, calm night the radar can show a speckle of echoes near the site that is ground, not rain, bent back to the antenna by the radiation inversion.
Reading an inversion
With a sounding in front of you, these questions sort out any inversion on it.
- Where is it? At the ground, it is radiational or a cold pool; aloft, it is subsidence, a front or an elevated mixed layer.
- What does the dew point do? Falling sharply through it: air that sank or came from a desert. Rising with the temperature: a front.
- What does the wind do? A sharp turn across the layer points to a front; the same direction above and below points to sinking or to a plume carried on the same flow.
- How strong and how deep? The temperature rise and the height of the top. Follow the dry adiabat from the top down to the ground: that is the surface temperature needed to mix it out.
- What is under it? Moist air under a cap means stored energy; lift a parcel and read the CAPE and CIN. Haze or fog under a valley inversion means pollution or low visibility that will last as long as the inversion.
- What will change it? Heating and moisture at the ground, cooling or lifting aloft, a front, or the edge of the plume arriving. Compare with the next sounding or a model forecast.
Check yourself
-
A morning sounding has 2 °C at the ground and 14 °C 300 m up. The forecast high is 17 °C. Will the inversion mix out?
Answer
Follow the dry adiabat from the top down to the ground: it warms about 9.8 °C per kilometer, about 3 °C over 300 m, so the ground must reach about 17 °C. The forecast high is just enough, and only in mid-afternoon; any cloud or a cooler day leaves it in place.
-
Through an inversion aloft the dew point falls from 12 °C to −10 °C. Is it more likely a front or a subsidence inversion?
Answer
Subsidence, or an elevated mixed layer: both bring dry air from above or from a desert. Through a frontal inversion the dew point usually rises with the temperature, because the air above the front is warm, moist air that came from somewhere else at a similar height.
-
Why can a winter cold pool in a mountain valley last a week, when a radiation inversion over the Plains ends by early afternoon?
Answer
The winter sun cannot heat the valley floor to the temperature of the dry adiabat through the inversion top; at Salt Lake City on January 23, 2013 that meant warming from −15.5 to 16.4 °C. The surrounding ridges also block the wind. It ends when the weather aloft changes: colder air and stronger winds arriving with a trough or front.
-
Where does the hot, dry air of the elevated mixed layer over the southern Plains come from?
Answer
From the deep afternoon mixed layers over the Mexican Plateau and, later in spring, the high terrain of the southwestern United States, the central Rockies and the Great Basin. Westerly winds carry it over the lower Plains, where it rides above humid air from the Gulf of Mexico.
-
Two spring mornings have the same CAPE. One has 8 °C at 700 hPa, the other 16 °C. Which is more likely to see storms that afternoon, and which more likely to see only a few, severe ones?
Answer
Storms of some kind are more likely on the 8 °C morning, with less inhibition. On the 16 °C morning storms are less likely, but Graziano and Carlson found that for a given buoyancy a stronger lid makes the storms that do form more likely to be severe, and they tend to form at the edge of the cap.
-
On April 22, 2001 the ground at Norman warmed only 4 °C between 7 am and 1 pm, yet the CIN fell by almost 90 percent. What did the work?
Answer
Cooling aloft. The layer around 700 to 750 hPa cooled 5 to 7 °C, carried in on the wind after rising motion cooled the air upstream, according to Carbin and colleagues. A cap can be removed from above as well as from below.
-
A clear, calm night, and the radar shows a ring of weak echoes around the site that does not move. What is it likely to be?
Answer
Anomalous propagation: the radiation inversion bends the radar beam down to the ground, and the echoes are ground clutter, not precipitation. They fade as the inversion mixes out in the morning.
Video


Methods
Soundings are the observed radiosonde records from the University of Wyoming's archive (North Platte, Salt Lake City, Hilo and Norman in 2021) and, where Wyoming has no record, the Iowa Environmental Mesonet's (Norman in 2001 and 2022). They are plotted and analyzed by WeatherOverTime's own code, the same used in How to read a skew-T diagram: saturation vapor pressure from Bolton (1980), pseudoadiabats integrated in 1 hPa steps, and the virtual temperature correction in CAPE and CIN. Because this lesson is about caps, CAPE and CIN here take the level of free convection as the bottom of the highest layer in which the parcel is warmer than its surroundings, so that the whole cap counts toward CIN. The other lessons take the first positive level above the LCL; the two agree unless a thin positive layer lies under the cap. At Norman at 7 am on April 22, 2001 they do not: the first definition gives −32 J/kg of CIN, counting only the layer below a thin positive layer at 854 hPa, and this one −607 J/kg.
Inversion strength is the warmest temperature within 2 km of the ground (1.5 km at North Platte) minus the ground temperature. The mixing-out temperature follows the dry adiabat from the inversion's warmest level to the surface pressure. The lid strength index follows Clark (1988): the mean wet-bulb potential temperature of the layer 30 to 80 hPa above the ground, the largest saturation wet-bulb potential temperature between there and 600 hPa, and the saturation value at 500 hPa, each taken down the pseudoadiabat to 1000 hPa. Sunrise uses NOAA's solar position approximation.
The 700 hPa test uses every 12 UTC sounding from March to June, 2015 to 2024, at Norman,
Dodge City and Amarillo in the Iowa Environmental Mesonet archive, with soundings of fewer
than 12 levels or implausible values dropped: 3,468 in all, 551 with most-unstable CAPE of
at least 1,000 J/kg. A day counts as a storm day when the Storm Prediction Center's
database lists a tornado, hail or damaging wind report within 150 km of the station between
18 and 06 UTC. Reports depend on where people are, and storms within 150 km may have formed
farther away, so the shares are indicators, not probabilities. PM2.5 is the 24-hour filter
sample (POC 1) at Hawthorne, AQS site 49-035-3006. The code and the data are in the site's
repository, under scripts/learn/.
Related
Lapse rates and stability explains why an inversion is so stable and traces an elevated mixed layer from New Mexico to Kansas. CAPE, CIN and instability computes the energy a cap holds back and the ways to lift a parcel through it, and How to read a skew-T diagram reads the loaded-gun sounding and the marine layer. How tornadoes form puts the cap together with wind shear. The latest soundings are on the radar's balloon layer, and observations show the morning's temperatures across the country. Terms are in the glossary.
Sources
Quotations are verbatim from the source named. Figures and values marked "computed here" are described under Methods.
- American Meteorological Society, Glossary of Meteorology, entries inversion, capping inversion, lid, mixing height, radiation inversion, cold-air pool, subsidence inversion, trade-wind inversion, frontal inversion, convective condensation level, air pollution episode, smog, radiation fog, superrefraction and anomalous propagation.
- National Weather Service glossary, entries inversion (with frontal, nocturnal, subsidence and temperature inversion) and cap.
- University of Wyoming, Department of Atmospheric Science, upper-air soundings: North Platte, NE (72562) 00 and 12 UTC October 10 and 00 UTC October 11, 2024; Salt Lake City, UT (72572) 12 UTC January 1 to 31, 2013; Hilo, HI (91285) 00 UTC July 15, 2024; Norman, OK (72357) 12 UTC February 14, 2021.
- Iowa Environmental Mesonet, Iowa State University, RAOB sounding archive (Norman, OK, 12 and 18 UTC April 22, 2001, 12 UTC June 12 and 00 UTC June 13, 2022; Norman, Dodge City and Amarillo, March to June 2015 to 2024) and ASOS observations (North Platte, October 10, 2024).
- Utah Department of Environmental Quality, Division of Air Quality, Inversions.
- US Environmental Protection Agency, AirData pre-generated data files, daily PM2.5 (parameter 88101), 2013, Salt Lake City Hawthorne, site 49-035-3006.
- US Environmental Protection Agency, NAAQS Table.
- Guangxia Cao, Thomas W. Giambelluca, Duane E. Stevens and Thomas A. Schroeder, Inversion Variability in the Hawaiian Trade Wind Regime, Journal of Climate 20, 1145 to 1160, 2007, abstract.
- T. N. Carlson and F. H. Ludlam, Conditions for the occurrence of severe local storms, Tellus 20 (2), 203 to 226, 1968.
- T. N. Carlson, S. G. Benjamin, G. S. Forbes and Y.-F. Li, Elevated Mixed Layers in the Regional Severe Storm Environment: Conceptual Model and Case Studies, Monthly Weather Review 111, 1453 to 1474, 1983, abstract.
- John M. Lanicci and Thomas T. Warner, A Synoptic Climatology of the Elevated Mixed-Layer Inversion over the Southern Great Plains in Spring. Part I: Structure, Dynamics, and Seasonal Evolution, Weather and Forecasting 6, 181 to 197, 1991, abstract.
- John M. Lanicci and Thomas T. Warner, Part III: Relationship to Severe-Storms Climatology, Weather and Forecasting 6, 214 to 226, 1991, abstract.
- Thomas M. Graziano and Toby N. Carlson, A Statistical Evaluation of Lid Strength on Deep Convection, Weather and Forecasting 2, 127 to 139, 1987, abstract.
- Terrance James Clark, The Lubbock Tornado: An Elevated Mixed Layer Case Study, M.S. thesis, Texas Tech University, 1988, chapter III, on the lid strength index of Carlson et al. (1980) as revised by Graziano (1985).
- Gregory W. Carbin, John S. Kain, Melissa S. Bukovsky and Michael E. Baldwin, Mesoscale Processes Associated with the Rapid Erosion of the "Cap", preprints, 10th Conference on Mesoscale Processes, Portland, Oregon, 2003.
- Storm Prediction Center, Storm reports for April 22, 2001.
- Storm Prediction Center, Day 1 Convective Outlook, 1630 UTC June 12, 2022.
- Storm Prediction Center, Severe weather database files, tornado, hail and wind reports, 2015 to 2024.
- Derrellwilliams, Inversion in Salt Lake City, Wikimedia Commons, January 16, 2022, CC BY-SA 4.0; cropped.
- NWS Medford, The Inversion, YouTube.
- Met Office, Learn About Weather, Temperature Inversions, YouTube.
- NWS Springfield, Weather Unlocked 36: Capping Inversion, YouTube.
- David Stang, METR2023, Lecture 23, Segment 5: Elevated Mixed Layer, YouTube.

Corrections: contact@weatherovertime.com.
Unit 2: Stability and instability
- Air parcels and adiabatic cooling
Why rising air cools, at the dry rate and then the moist rate.
- Lapse rates and stability
Stable, unstable and conditionally unstable air, read from the temperature profile.
- CAPE, CIN and instability
The energy for an updraft, the energy against one, and the three ways to lift a parcel.
- Inversions and the cap
Radiation, subsidence and frontal inversions, and the elevated mixed layer.