Unit 2 · Stability and instability
Lapse rates and stability
- Read first
- Air parcels and adiabatic cooling
- Key terms
- Lapse rate, Environmental lapse rate, Process lapse rate, Static stability, Absolute stability, Neutral stability, Conditional instability, Absolute instability, Superadiabatic lapse rate, Potential instability, Elevated mixed layer, Mixed layer, Stable boundary layer, Brunt–Väisälä frequency
Whether air rises on its own, or sinks back when pushed, is decided by one comparison: how fast the temperature falls with height around it, against how fast a parcel of air would cool if it were lifted. That comparison is atmospheric stability. It explains why fog sits in a valley all morning, why the afternoon is gusty and full of cumulus, why a column of smoke spreads flat at dawn, and why the Great Plains see more severe thunderstorms than almost anywhere else. This lesson defines each kind of stability from its governing source, then reads them in real soundings: an Arctic inversion, a desert afternoon, a Kansas evening under an elevated mixed layer, and ten years of balloons at four stations.
- Two lapse rates: the one a balloon measures and the one a lifted parcel follows, and the test that compares them.
- Four states of a layer: absolutely stable, neutral, conditionally unstable and absolutely unstable, in the words of the American Meteorological Society.
- Stability through the day: the morning inversion, the superadiabatic layer over hot ground and the afternoon mixed layer, in two soundings eleven hours apart.
- Potential instability and the elevated mixed layer, the two reasons the Plains produce such violent storms.
- How lapse rates are reported, what values are normal, and what stable and unstable air look like from the ground.
Two lapse rates
A lapse rate is, in the American Meteorological Society's definition, "the decrease of an atmospheric variable with height, the variable being temperature, unless otherwise specified." The AMS adds a warning: "The term applies ambiguously to the environmental lapse rate and the process lapse rate, and the meaning must often by ascertained from the context."[1] The whole subject of stability rests on keeping the two apart.
- Environmental lapse rate
- What the atmosphere is doing. The environmental lapse rate "is determined by the distribution of temperature in the vertical at a given time and place," which is what a weather balloon measures. It changes from day to day, hour to hour and layer to layer, and it can be negative: in an inversion temperature rises with height.[1]
- Process lapse rate
- What a parcel of air would do. The process lapse rate is "the rate of decrease of the temperature of an air parcel as it is lifted," determined "by the character of the fluid processes." In the atmosphere it "is usually assumed to be either the dry-adiabatic lapse rate or the moist-adiabatic lapse rate."[1]
The previous lesson, Air parcels and adiabatic cooling, derived the two process rates. Unsaturated air cools at the dry adiabatic rate, g/cp, about 9.8 °C per kilometer. Saturated air cools at the moist adiabatic rate, which is slower because condensation releases heat, and which depends on temperature and pressure: computed here, 3.5 °C per kilometer for saturated air at 30 °C near sea level, 6.5 at 0 °C, and 8.7 at −30 °C and 500 hPa, where so little water vapor is left that it nearly matches the dry rate. The environmental rate has no fixed value at all. The standard atmosphere, the agreed average profile used to calibrate altimeters, assumes 6.5 °C per kilometer up to 11 km;[1] real soundings in this lesson range from −22.7 to +24.8.
The displacement test
Stability is found by a thought experiment the AMS calls the parcel method: "a method of testing for instability in which a displacement is made from a steady state under the assumption that only the parcel or parcels displaced are affected, the environment remaining unchanged." The displaced parcel changes temperature adiabatically, "and the buoyant force resulting from its contrast with the unchanged environment leads to the criterion for stability, γ < Γ," where γ is the environmental lapse rate and Γ the dry or saturated adiabatic rate, "according to the condition of the parcel."[1]
The Federal Aviation Administration's Aviation Weather Handbook spells out the three outcomes. "If the lifted parcel is colder than the surrounding air, it will be denser (heavier) and sink back to its original level. In this case, the parcel is stable because it resists upward displacement. If the lifted parcel is the same temperature as the surrounding air, it will be the same density and remain at the same level. In this case, the parcel is neutrally stable. If the lifted parcel is warmer and, therefore, less dense (lighter) than the surrounding air, it will continue to rise on its own until it reaches the same temperature as its environment." And: "Greater temperature differences result in greater rates of vertical motion."[2]
- Temperature of the surrounding air
- Dry adiabat: the path the moved parcel follows
- Parcel warmer than its surroundings
- Parcel colder
- Same temperature
The test is about density, and moist air is slightly less dense than dry air at the same temperature. Strictly, the comparison is made in virtual temperature, which the AMS criterion names: γ is "the lapse rate of virtual temperature with height."[1] Computed here, virtual temperature exceeds actual temperature by under 0.5 °C in dry air and by about 3 °C in very humid air near the ground, holding 15 grams of water vapor per kilogram. The rest of this lesson, like most forecasting practice, speaks of temperature.
Two limits of the test matter later. It assumes the surroundings do not change when the parcel moves, which is true of one small parcel and false of a whole layer that is lifted, the case taken up under potential instability. And it describes small displacements: a layer can be stable to a nudge and still release a great deal of energy if a parcel is pushed far enough, which is the subject of the next lesson, CAPE, CIN and instability.
Four states of a layer
Because a lifted parcel can follow either of two process rates, a measured lapse rate falls into one of three ranges, with neutral boundaries between them. The FAA handbook lists "four unique types of atmospheric stability," and the definitions below are the AMS's own.[1][2]
| State | Environmental lapse rate | Unsaturated parcel | Saturated parcel |
|---|---|---|---|
| Absolutely stable | Less than the moist rate, including isothermal layers and inversions | Stable | Stable |
| Neutral | Equal to the dry rate (unsaturated) or the moist rate (saturated) | Neutral at the dry rate | Neutral at the moist rate |
| Conditionally unstable | Between the moist and dry rates | Stable | Unstable |
| Absolutely unstable | Greater than the dry rate (superadiabatic) | Unstable | Unstable |
- Absolute stability
- "The state of a column of air in the atmosphere when its lapse rate of temperature is less than the saturation-adiabatic lapse rate. An air parcel displaced upward by an adiabatic process would then be more dense than its environment and would tend to sink back to its level of origin." The FAA adds that this "includes both isothermal and inversion temperature profiles."[1][2]
- Neutral stability
- A layer "in which an ascending (or descending) air parcel always has the same temperature (density) as the surrounding environmental air": the dry rate for an unsaturated column, the moist rate for a saturated one. The AMS's general term is neutral equilibrium, "a condition of a system for which a small perturbation of a parcel of the system causes it to neither depart from its new position nor return to its previous one."[1][2]
- Conditional instability
- "The state of a layer of unsaturated air when its lapse rate of temperature is less than the dry-adiabatic lapse rate but greater than the moist-adiabatic lapse rate. Under such conditions a parcel of air at the environmental temperature is unstable to upward vertical displacements if it is saturated, unstable to downward displacements if it is saturated and contains cloud water, but stable to all small vertical displacements if it is unsaturated."[1]
- Absolute instability
- "The state of a column of air in the atmosphere when it has a superadiabatic lapse rate of temperature (i.e., greater than the dry-adiabatic lapse rate). An air parcel displaced vertically would be accelerated in the direction of the displacement. The kinetic energy of the parcel would consequently increase with increasing distance from its level of origin."[1]
The AMS entry for conditional instability is unusually frank about its own history: "The choice of usage of the term 'conditional instability' has been uncertain and sometimes controversial for at least 50 years." The definition above, which it credits to Haurwitz (1941), "has been most frequently accepted." It does not require that a real parcel ever reach saturation, nor "that the energy released from latent heating (convective available potential energy, CAPE) be greater than the convective inhibition (CIN)." A second usage, which it traces to Byers (1944) and Emanuel (1994), counts a layer as conditionally unstable only if a parcel lifted from some level could actually arrive there saturated.[1] In practice, a conditionally unstable layer is a possibility, not a forecast. The FAA puts the practical meaning plainly: "Virtually all showers and thunderstorms form in an air mass that is classified as conditionally unstable," and "a conditionally unstable air mass needs a lifting mechanism."[2]
- Saturated adiabatic rate, 1000 hPa
- 700 hPa
- 500 hPa
- Dry adiabatic rate
Table: the saturated adiabatic lapse rate at several temperatures and pressures, computed here
| Temperature, °C | Pressure, hPa | Saturated rate, °C/km |
|---|---|---|
| 30 | 1000 | 3.5 |
| 20 | 1000 | 4.2 |
| 10 | 1000 | 5.2 |
| 0 | 1000 | 6.5 |
| 0 | 700 | 5.8 |
| −10 | 500 | 6.4 |
| −30 | 500 | 8.7 |
| −40 | 300 | 9.0 |
Table: the observed layers marked on the chart
| Layer | Lapse rate, °C/km | Mean temperature, °C |
|---|---|---|
| Dodge City, KS, 700–500 hPa, 00 UTC June 7, 1990 | 9.1 | 3.4 |
| Norman, OK, 700–500 hPa, 12 UTC May 20, 2013 | 8.5 | −2.7 |
| Las Vegas, NV, 300 to 3,500 m above ground, 00 UTC June 21, 2024 | 9.8 | 17.9 |
| Fairbanks, AK, 700–500 hPa, 12 UTC January 24, 2024 | 5.4 | −29.0 |
| Fairbanks, AK, ground to 906 m, same sounding | −22.7 | |
| Las Vegas, NV, ground to 137 m, 00 UTC June 21, 2024 | 24.8 |
The chart shows why the same lapse rate can mean different things. At 6.5 °C per kilometer, the standard atmosphere's value, a layer at 25 °C near sea level is conditionally unstable, because warm saturated air cools at under 4 °C per kilometer. The same lapse rate at −20 °C and 500 hPa is absolutely stable. Cold air must have a much steeper lapse rate than warm air before saturated parcels can rise through it, which is one reason winter thunderstorms are rare and summer ones common.
Stability in potential temperature
There is a quicker way to read dry stability. Potential temperature is the temperature air would have if brought dry-adiabatically to 1000 hPa, so it stays constant along a dry adiabat. A layer cooling at exactly the dry rate therefore has the same potential temperature all the way up; a layer cooling more slowly has potential temperature rising with height; and a superadiabatic layer, in the AMS's words, is one with a lapse rate "greater than the dry-adiabatic lapse rate, such that potential temperature decreases with height."[1]
| Potential temperature with height | For unsaturated air |
|---|---|
| Increases | Stable |
| Constant | Neutral |
| Decreases | Absolutely unstable |
This is how the AMS frames static stability itself: "the ability of a fluid at rest to become turbulent or laminar due to the effects of buoyancy." Air "tending to become or remain turbulent is said to be statically unstable; one tending to become or remain laminar is statically stable; and one on the borderline between the two ... is statically neutral." Turbulence then works against the instability that made it, "by moving less dense fluid up and more dense fluid down, and by creating a neutrally buoyant mixture," unless something keeps destabilizing the air, "such as heating of the bottom of a layer of air by contact with the warm ground during a sunny day."[1] That sentence is the afternoon mixed layer, which the sections below find in a real sounding.
Absolutely stable: an Arctic morning
Very stable air forms over snow in the Alaskan interior in midwinter, when the days are short and the snow radiates heat to a clear sky. Around 3 am on January 24, 2024, the Fairbanks airport reported −36 °F (−38 °C), a clear sky and calm wind.[6] The 12 UTC balloon found this.
- Observed temperature
- Surface air lifted dry-adiabatically
Table: Fairbanks, 12 UTC January 24, 2024, by height
| Height above ground, m | Temperature, °C | Potential temperature, K |
|---|---|---|
| 0 | −40.0 | 233.3 |
| 25 | −32.7 | 240.8 |
| 101 | −32.3 | 242.0 |
| 253 | −31.3 | 244.5 |
| 501 | −23.0 | 255.4 |
| 753 | −22.7 | 258.2 |
| 901 | −19.4 | 263.1 |
| 1,255 | −21.6 | 264.4 |
| 1,503 | −22.1 | 266.4 |
| 2,005 | −19.2 | 274.8 |
| 2,503 | −21.9 | 277.1 |
Nothing that starts near the ground here can rise far. The sharpest part of the inversion is in the lowest few tens of meters: the sounding reads −32.7 °C only 25 m up, 7.3 °C warmer than the ground. Anything released at the ground, smoke or water vapor, stays in the bottom of this layer. Above about 1.5 km the profile turns ordinary: the 700 to 500 hPa lapse rate the same morning was 5.4 °C per kilometer.
How stiff stable air is
Stable air does more than resist a push; it springs back and overshoots, and a displaced parcel oscillates about its starting level. The Brunt–Väisälä frequency, N, is "the frequency ... at which a displaced air parcel will oscillate when displaced vertically within a statically stable environment," N = √((g/θv) ∂θv/∂z), and "this frequency is also sometimes used as a measure of the stability within a statically stable environment." It "is not defined in statically unstable air and is zero in statically neutral air."[1] Across the lowest 896 m at Fairbanks, where potential temperature rises 30 K, N is 0.036 per second: a displaced parcel would bob up and down about once every 3 minutes. A layer with the standard atmosphere's 6.5 °C per kilometer near the ground gives about 0.011 per second and a period near 10 minutes. Computed here. The same restoring force, spread over a whole airstream crossing a ridge, is what makes the mountain waves described below.
Superadiabatic air over hot ground
The opposite extreme lives in the same place every sunny day: the air just above hot ground. The FAA: "Convective currents are most active on warm summer afternoons when winds are light. Heated air at the surface creates a shallow, absolutely unstable layer within which bubbles of warm air rise upward." Bare ground heats most: "Barren surfaces such as sandy or rocky wastelands and plowed fields become hotter than open water or ground covered by vegetation."[2]
Las Vegas balloons start from the desert floor, 698 m above sea level. On June 20, 2024 the airport reported a clear sky from before dawn until noon and a few clouds after 1 pm. The temperature rose from 78 °F (26 °C) at dawn to 104 °F (40 °C) by 4 pm, and the wind, calm or light all morning, gusted to 16 to 18 knots in the early afternoon.[6] The two soundings that day bracket the change from night to afternoon at the ground.
- 5 am PDT
- 5 pm PDT
- Dry adiabatic rate, 9.8 °C/km
A superadiabatic layer cannot last, because it is unstable to any disturbance: warm bubbles (thermals) break away from the ground and rise, and cooler air sinks to replace them. It persists only as long as the sun keeps reheating the ground, which is why it is found on sunny afternoons and in the lowest one or two hundred meters. There is still a ceiling on how steep it can get before the air overturns by itself. The AMS defines an autoconvective lapse rate, at which density would be constant with height, "approximately +3.4 × 10⁻⁴ °C per cm" for dry air, 34 °C per kilometer; beyond it, "the air density would increase with elevation."[1] Even the Las Vegas afternoon, at 24.8 °C per kilometer over the lowest 137 m, stays below it. The AMS notes that the term "is useful in optics, since it defines the transition between upward and downward refraction of light in the atmosphere."[1]
Stability through the day
Pull back from the lowest 400 m and the two Las Vegas soundings show the whole daily cycle of the boundary layer, the part of the atmosphere the ground heats and cools.
- 5 am PDT (12 UTC)
- 5 pm PDT (00 UTC)
Table: Las Vegas, June 20, 2024, temperature (°C) / potential temperature (K) by height
| Height above ground, m | 5 am PDT (12 UTC) | 5 pm PDT (00 UTC June 21) |
|---|---|---|
| 0 | 25.3 / 305.0 | 39.3 / 319.5 |
| 50 | 27.6 / 307.8 | 37.6 / 318.3 |
| 100 | 27.7 / 308.4 | 36.5 / 317.7 |
| 200 | 27.1 / 308.8 | 34.9 / 317.0 |
| 500 | 26.8 / 311.5 | 31.3 / 316.3 |
| 1,000 | 22.7 / 312.3 | 26.5 / 316.4 |
| 2,000 | 13.1 / 312.5 | 16.8 / 316.4 |
| 3,000 | 4.9 / 314.2 | 7.1 / 316.4 |
| 3,500 | 2.7 / 317.2 | 2.3 / 316.5 |
| 4,000 | 1.8 / 321.9 | −1.3 / 318.0 |
| 4,500 | −1.4 / 323.8 | −1.5 / 323.5 |
- Stable boundary layer
- "A cool layer of air adjacent to a cold surface of the earth, where temperature within that layer is statically stably stratified. SBLs can form at night over land when the earth is cooled by net loss of radiation, and they can form at any time when air moves over a relatively cooler land or water surface." Within it, the AMS notes, "patchy sporadic turbulence, internal gravity waves, drainage flows, inertial oscillations, and nocturnal jets."[1]
- Mixed layer
- A boundary layer "characterized by vigorous turbulence tending to stir and uniformly mix, primarily in the vertical, quantities such as conservative tracer concentrations, potential temperature, and momentum or wind speed. Moisture is often not so well mixed." Buoyantly driven mixed layers "are usually statically unstable," and "during fair weather over land, mixed layers are usually daytime phenomena generated buoyantly, with growth caused by entrainment of free-atmosphere air into the mixed-layer top."[1]
The afternoon Las Vegas profile is a textbook mixed layer: thermals from the superadiabatic layer at the ground carried heat up through 3.9 km of air, until the whole depth had the same potential temperature and cooled with height at the dry rate. The FAA's summary of the daily cycle: "Daytime heating of the surface increases temperature lapse rates and decreases stability. Conversely, nighttime cooling of the surface decreases temperature lapse rates and increases stability." The swing is largest "over land, at low latitudes, with a clear sky, dry air, and light wind," and smallest "over large bodies of water, at high latitudes, with a cloudy sky, moist air, and strong wind."[2] A desert in June is the first list exactly.
One pair of soundings could be an accident. Ten summers of them cannot. Every routine sounding at Dodge City, Kansas in June, July and August from 2015 to 2024 gives the mean lapse rate of the lowest 3 km, morning and evening.
- 12 UTC (6 am CDT), 898 soundings
- 00 UTC (6 pm CDT), 902 soundings
The Storm Prediction Center maps the same number, the 0 to 3 km lapse rate, every hour. Its help page explains why: it is "meant to identify regions of deeper mixing (e.g., steeper lapse rates) that often result in weakening convective inhibition that precedes surface-based thunderstorm development, as well as the potential for strong downdrafts in the low levels."[4] A steep low-level lapse rate on a summer afternoon means the cap is eroding from below and that rain-cooled air falling from a storm will accelerate on the way down.
What changes a lapse rate
Heating and cooling at the ground are one of three ways a lapse rate changes. The FAA handbook lists the others. "Changes in atmospheric stability are inversely related to temperature (density) changes with height. If temperature lapse rates increase, then stability decreases."[2]
- Wind (advection). "Stability increases when wind blows colder air into the bottom of the air column (cold air advection) and/or warmer air at the top (warm air advection). Conversely, stability decreases when wind blows warmer air into the bottom of the air column and/or colder air at the top."
- Sinking. A column that subsides is compressed; "the upper part of the column sinks farther and, thus, warms more than the bottom part. This process acts to decrease the temperature lapse rate and increase stability." Sustained, this is how subsidence inversions form.
- Rising. A column that is lifted stretches, and "air at the top of the column cools more than the air at the bottom of the column. This process acts to increase the temperature lapse rate and decrease stability." Large-scale rising motion, such as ahead of an upper-level trough, works this way.
- Heating and cooling. Sun on the ground, radiation from the ground at night, and latent heat released inside clouds.
Peter Banacos and Michael Ekster of the National Weather Service wrote these terms into a single lapse rate tendency equation, with a diabatic heating term, horizontal and vertical advection of the lapse rate, differential ageostrophic temperature advection and vertical stretching. Their scale analysis shows how fast one of them works: the latent heat released in a deep thunderstorm updraft "quickly eradicates any portion of the EML it processes, likely producing a trend to moist adiabatic in the layer."[7] A storm uses up the steep lapse rate that fed it.
Potential instability: lifting a layer
The displacement test lifts one parcel into unchanged surroundings. The weather often lifts a whole layer at once: ahead of a front, over a dryline, up a slope. The top and bottom of the layer then cool at different rates, and the layer's own lapse rate changes. The AMS names the result:
Potential instability (also called convective instability): "The state of an unsaturated layer or column of air in the atmosphere with a wet-bulb potential temperature (or equivalent potential temperature) that decreases with elevation. If such a column is lifted bodily until completely saturated, it will become unstable (i.e., its temperature lapse rate will exceed the saturation-adiabatic lapse rate) regardless of its initial stratification."[1]
Equivalent potential temperature, θe, counts both the heat in the air and the heat its water vapor would release on condensing. A layer whose θe falls with height has warm, humid air underneath and dry air above. Lift it, and the humid bottom saturates first and from then on cools at the slow moist rate, while the dry top keeps cooling at the fast dry rate. The top cools more than the bottom; the lapse rate steepens. The FAA describes the same process: the net effect "is to increase the lapse rate within the column and decrease stability. This process is called convective instability, and is associated with the development of thunderstorms."[2]
- The layer as observed
- The same layer lifted 280 hPa
- Observed temperature
Table: each level of the layer, before and after lifting, computed here
| Level | Pressure, hPa | Temperature, °C | Dew point, °C | θe, K | Lifted to, hPa | Lifted temperature, °C | Saturated after lifting |
|---|---|---|---|---|---|---|---|
| Ground | 920.0 | 25.8 | 19.8 | 354.4 | 640.0 | 8.4 | yes |
| 2 | 917.0 | 26.0 | 18.0 | 349.9 | 637.0 | 6.9 | yes |
| 3 | 907.1 | 25.1 | 17.9 | 350.2 | 627.1 | 6.4 | yes |
| 4 | 875.9 | 22.1 | 17.8 | 351.4 | 595.9 | 4.8 | yes |
| 5 | 850.0 | 19.6 | 17.6 | 352.2 | 570.0 | 3.3 | yes |
| 6 | 845.7 | 19.3 | 17.4 | 352.0 | 565.7 | 2.9 | yes |
| 7 | 816.3 | 17.0 | 15.7 | 349.6 | 536.3 | −0.1 | yes |
| 8 | 799.0 | 15.6 | 14.7 | 348.2 | 519.0 | −1.9 | yes |
| 9 | 787.7 | 15.4 | 13.9 | 348.0 | 507.7 | −3.0 | yes |
| 10 | 784.0 | 15.4 | 13.6 | 347.9 | 504.0 | −3.3 | yes |
| 11 | 776.0 | 17.6 | 7.6 | 339.1 | 496.0 | −7.7 | yes |
| 12 | 760.1 | 18.8 | −4.9 | 327.3 | 480.1 | −14.8 | yes |
| 13 | 753.0 | 19.4 | −10.6 | 324.9 | 473.0 | −16.8 | yes |
This is why a sounding with a strong inversion over a humid layer is not reassuring. The inversion that makes the layer stable to small nudges is the same dry air that makes it potentially unstable. Lifting on the scale of a front or a dryline does not nudge; it raises whole layers by 100 hPa or more over a few hours.
How lapse rates are measured and reported
A lapse rate is the temperature difference across a layer divided by its depth:
Lapse rate = (Tbottom − Ttop) ÷ (ztop − zbottom), in °C per kilometer. Positive when temperature falls with height, negative in an inversion.
At Dodge City on the evening of June 6, 1990, the 700 hPa level was at 3,141 m above sea level and 15.8 °C, the 500 hPa level at 5,870 m and −9.1 °C: 24.9 °C over 2,729 m, a lapse rate of 9.1 °C per kilometer.[5] A mean over a layer says nothing about what happens inside it; the same 9.1 could hide an inversion and a superadiabatic layer that average out. That is why forecasters look at the whole profile and use layer means only as summaries.
The Storm Prediction Center maps two layers on its mesoanalysis pages.[4]
| Parameter | Layer | What SPC says it is for |
|---|---|---|
| Mid-level lapse rate | 700 to 500 hPa, about 3 to 5.5 km above sea level | "meant to identify regions where deep convection is more probable (all else being equal). Likewise, steeper lapse rates correspond to the possibility of larger CAPE and stronger storm updrafts." |
| Low-level lapse rate | 0 to 3 km above the ground | "meant to identify regions of deeper mixing (e.g., steeper lapse rates) that often result in weakening convective inhibition that precedes surface-based thunderstorm development, as well as the potential for strong downdrafts in the low levels." |
Both SPC help pages use the same rule of thumb: "Values less than 5.5-6.0 C km-1 ('moist' adiabatic) represent 'stable' conditions, while values greater than 9.8 C km-1 ('dry' adiabatic) are considered 'absolutely unstable.' In between these two values, lapse rates are considered 'conditionally unstable.'"[4] The 5.5 to 6.0 stands in for the moist rate at typical mid-level temperatures; the chart in Four states of a layer shows how much that boundary really moves with temperature. The 700 to 500 hPa layer is fixed in pressure, so it sits at different heights above the ground at different stations: at Dodge City on June 6, 1990 its base was 2,350 m above the ground, and near sea level it is about 3 km up. The 0 to 3 km layer follows the ground.
The elevated mixed layer
The steepest mid-level lapse rates over the central United States come from one source. The afternoon mixed layer over the high deserts and plateaus of the West and Mexico grows several kilometers deep, as at Las Vegas. When the westerly wind carries that air east, it passes over the lower Plains, where warm, humid air from the Gulf of Mexico is flowing north at the ground. The desert air rides over the top.
Banacos and Ekster describe it: "During late spring and summer, it is common downstream of major mountain ranges to find evidence of displaced hot, dry, and deeply mixed boundary layer air that has moved with the prevailing horizontal flow over areas of lower terrain." This air "is manifest as an elevated mixed layer (EML; Carlson and Ludlam 1968)," and it was a readily identified feature to forecasters "dating back to the conceptual 'type 1' (or 'loaded gun') sounding as described by Fawbush and Miller (1954)." Its base "lies atop an interface of strong static stability (the 'capping' inversion), which, given a moist local boundary layer, creates convective inhibition for surface lifted parcels and allows for a strong buildup of convective available potential energy (CAPE), potentially prior to the initiation of deep moist convection."[7]
The paper's first figure lays two soundings side by side: Albuquerque, New Mexico and Dodge City, Kansas, at 00 UTC June 7, 1990, showing "the surface-based mixed layer extending upward to 450 mb at Albuquerque ... has advected in a quasi-conservative manner to Dodge City ... with nearly dry-adiabatic lapse rates present in the 700–450-mb layer."[7] The same two soundings, replotted from the archive:
- Dodge City temperature
- Dodge City dew point
- Albuquerque temperature
- Dry adiabat
Table: potential temperature (K) at 700, 600 and 500 hPa, 00 UTC June 7, 1990
| Station | 700 hPa | 600 hPa | 500 hPa | 700–500 hPa lapse, °C/km |
|---|---|---|---|---|
| Albuquerque, NM (1,620 m) | 320.4 | 320.7 | 321.1 | 9.5 |
| Dodge City, KS (790 m) | 319.9 | 321.1 | 321.8 | 9.1 |
The consequences follow from the sections above. Under the cap, the humid layer is heated and moistened and stores energy, while the cap holds convection off. The EML above supplies a lapse rate near the dry rate, far steeper than the moist rate of a saturated updraft, so a parcel that breaks through is much warmer than its surroundings for kilometers: computed here, the Dodge City surface parcel that evening had 2,142 J/kg of CAPE. And the whole profile is potentially unstable, as the previous section showed, ready to be lifted. The Norman, Oklahoma sounding eight hours before the 2013 Moore tornado, read in How to read a skew-T, had the same structure, with 8.5 °C per kilometer between 700 and 500 hPa.[8]
EML air does not stay on the Plains. Banacos and Ekster found identifiable EML air in regional soundings before 34 of 447 significant severe weather days in the northeastern United States from 1970 to 2006, 7.6 percent, and that those 36 events, with two earlier ones added, "compose a noteworthy list of historically significant derechos and tornadic events to affect the northeastern United States." They defined an EML sounding by "an elevated (not surface-based) environmental lapse rate greater than or equal to 8.0°C km−1 through a depth of 200 mb or greater" with humidity rising from a minimum at its base; the criteria, they note, "were arrived at subjectively."[7] The next lesson in this unit, Inversions and the cap, takes up the cap itself.
Typical values
The standard atmosphere's 6.5 °C per kilometer is an average of the whole troposphere, not a typical day in any particular layer. Ten years of balloons at four stations give a better sense of the range. Every 00 and 12 UTC sounding from 2015 to 2024 at Dodge City, Norman, Albany and Miami gives a 700 to 500 hPa lapse rate, some 26,000 in all.
- Dodge City, KS
- Norman, OK
- Albany, NY
- Miami, FL
Table: 700–500 hPa lapse rate by month, 2015–2024, median °C/km and share of soundings at or above 8 °C/km
| Month | Dodge City, KS | Norman, OK | Albany, NY | Miami, FL |
|---|---|---|---|---|
| Jan | 6.3 / 4% | 6.2 / 2% | 5.6 / 1% | 6.0 / 1% |
| Feb | 6.4 / 6% | 6.3 / 4% | 5.3 / 1% | 6.0 / 0% |
| Mar | 6.8 / 11% | 6.5 / 10% | 5.5 / 0% | 6.1 / 0% |
| Apr | 7.0 / 21% | 6.9 / 15% | 5.8 / 1% | 6.0 / 0% |
| May | 7.1 / 20% | 7.0 / 19% | 5.7 / 1% | 5.8 / 1% |
| Jun | 7.1 / 22% | 6.5 / 11% | 5.6 / 0% | 5.7 / 1% |
| Jul | 6.7 / 12% | 6.2 / 5% | 5.5 / 0% | 5.9 / 0% |
| Aug | 6.6 / 10% | 6.2 / 3% | 5.6 / 0% | 5.8 / 0% |
| Sep | 6.6 / 6% | 5.9 / 1% | 5.6 / 0% | 5.7 / 0% |
| Oct | 6.3 / 6% | 6.1 / 2% | 5.7 / 0% | 5.6 / 0% |
| Nov | 6.4 / 4% | 6.1 / 2% | 5.6 / 0% | 5.8 / 0% |
| Dec | 6.3 / 3% | 6.2 / 1% | 5.6 / 0% | 5.8 / 0% |
| 700 to 500 hPa, 2015 to 2024 | Soundings | Median, °C/km | 10th to 90th percentile | At or above 8 |
|---|---|---|---|---|
| Dodge City, KS | 7,005 | 6.6 | 5.1 to 8.0 | 10.2% |
| Norman, OK | 6,327 | 6.3 | 5.1 to 7.7 | 6.1% |
| Miami, FL | 6,585 | 5.8 | 5.0 to 6.7 | 0.3% |
| Albany, NY | 6,025 | 5.6 | 4.3 to 6.7 | 0.3% |
Three things stand out. The median mid-level lapse rate is conditionally unstable almost everywhere, between the moist and dry rates; conditional instability is the atmosphere's normal state, and what varies is how steep. The spread between stations is small in the middle and large in the tail: Miami's median is only 0.8 °C per kilometer below Dodge City's, but lapse rates of 8 or more are more than thirty times as common at Dodge City. And the steep lapse rates of the Plains are seasonal, most frequent from April to June and least in winter, while Miami's barely change through the year: its 10th to 90th percentile range, 5.0 to 6.7, is the narrowest of the four.
What stable and unstable air look like
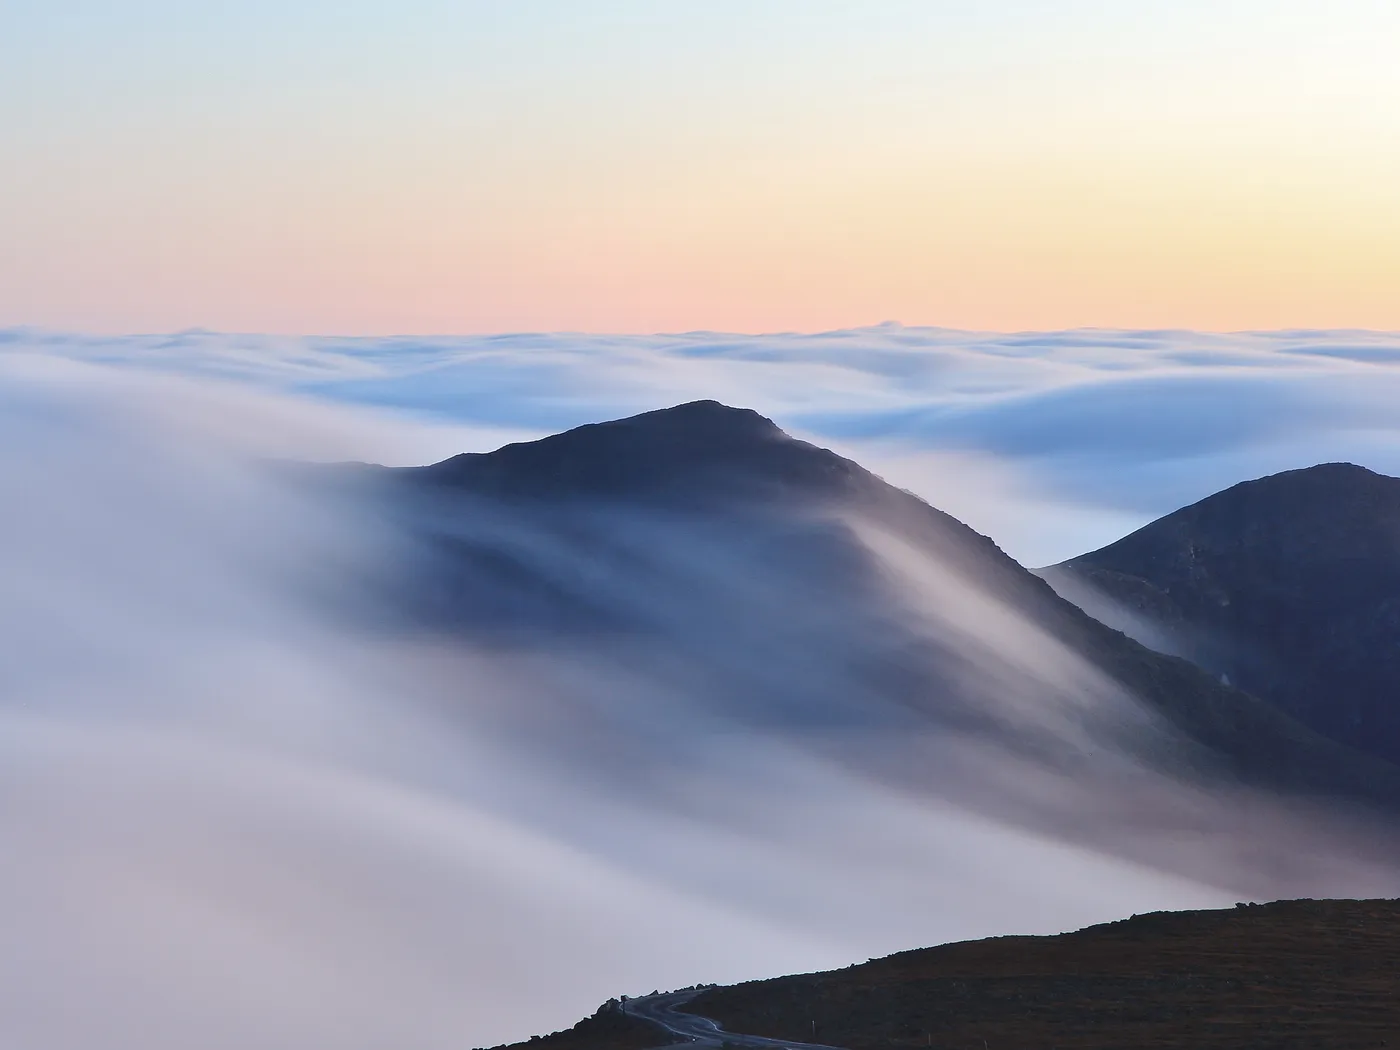
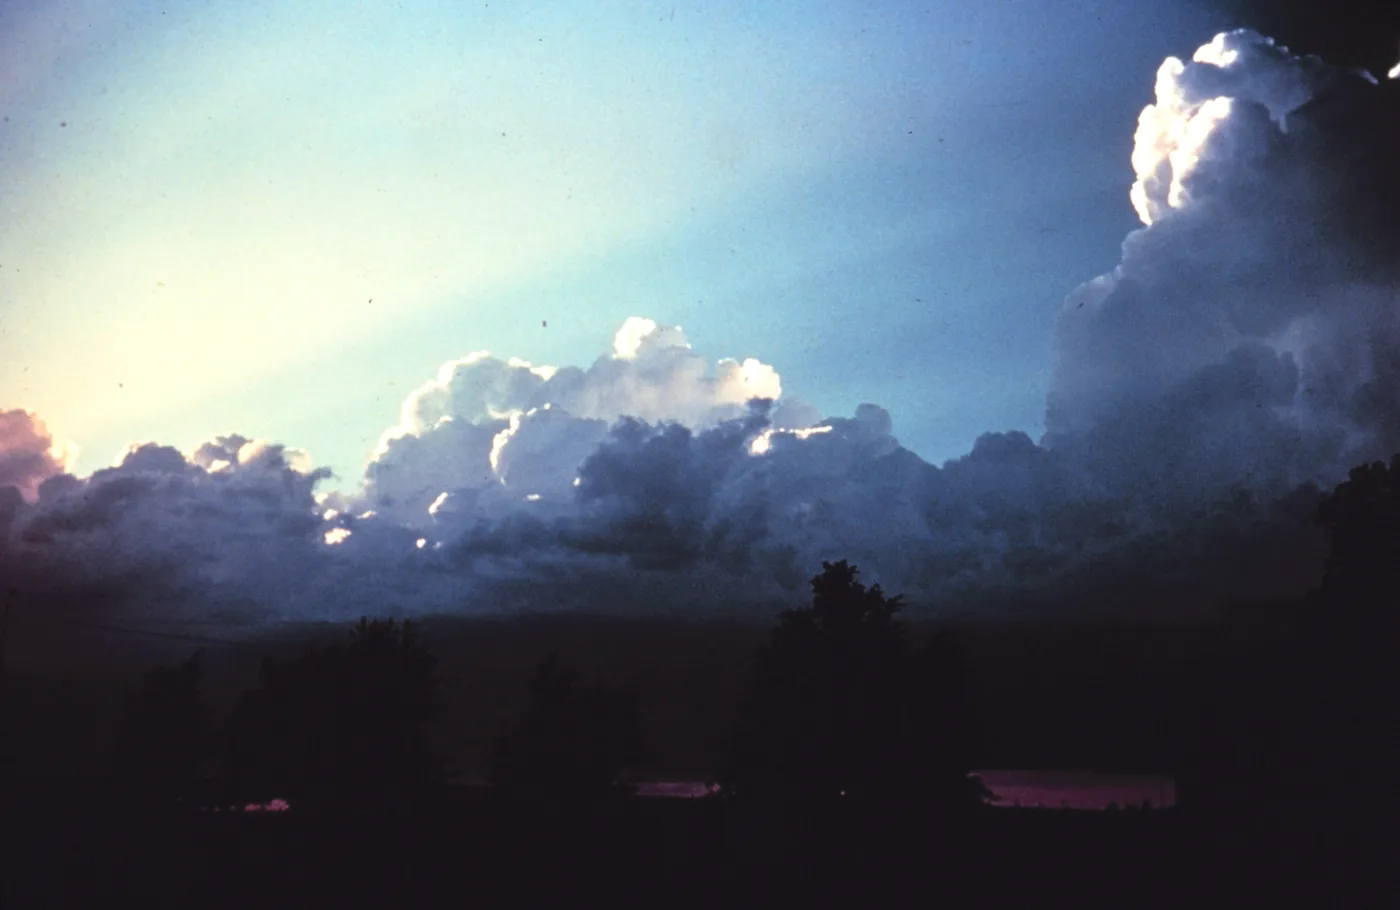
Stability can be read from the ground. The FAA's Pilot's Handbook of Aeronautical Knowledge gives the two air masses. An air mass warmed from below develops convective currents: "This creates an unstable air mass with good surface visibility. Moist, unstable air causes cumulus clouds, showers, and turbulence to form." One passing over a colder surface "does not form convective currents but instead creates a stable air mass with poor surface visibility. The poor surface visibility is due to the fact that smoke, dust, and other particles cannot rise out of the air mass and are instead trapped near the surface. A stable air mass can produce low stratus clouds and fog."[3]
| Stable air | Unstable air | |
|---|---|---|
| Clouds | Stratus and other layered, stratiform clouds; fog; lens-shaped wave clouds over mountains | Cumulus, towering cumulus, cumulonimbus |
| Precipitation | Drizzle, steady rain or snow | Showers, thunderstorms |
| Visibility | Poor near the ground: haze, smoke and dust trapped | Good: particles mixed upward |
| Flight | Smooth air | Turbulence below and in cumulus |
| A smoke plume | Spreads flat (fanning) | Loops up and down |
Sources for each row: the FAA handbooks for clouds, precipitation, visibility and turbulence ("Drizzle ... forms in stable air, falls from stratiform clouds, and is typically accompanied by fog"; "Haze occurs in stable air and is usually only a few thousand feet thick"; beneath cumulus "a pilot can expect to encounter turbulence beneath or in the clouds, while above the clouds, air generally is smooth"), and the AMS for smoke. Fanning is "a pattern of smokestack plume dispersion in a statically stable atmosphere, in which the plume spreads out in the horizontal like an oriental fan and meanders about at a fixed height with little vertical spread." In statically neutral air the plume cones out evenly, and "during unstable atmospheric conditions," large turbulent eddies make it loop: it "waves upward and downward like a garden hose." The Las Vegas afternoon above, with its gusts to 18 knots under a superadiabatic layer, is the unstable column.[1][2][3]
Mountain waves
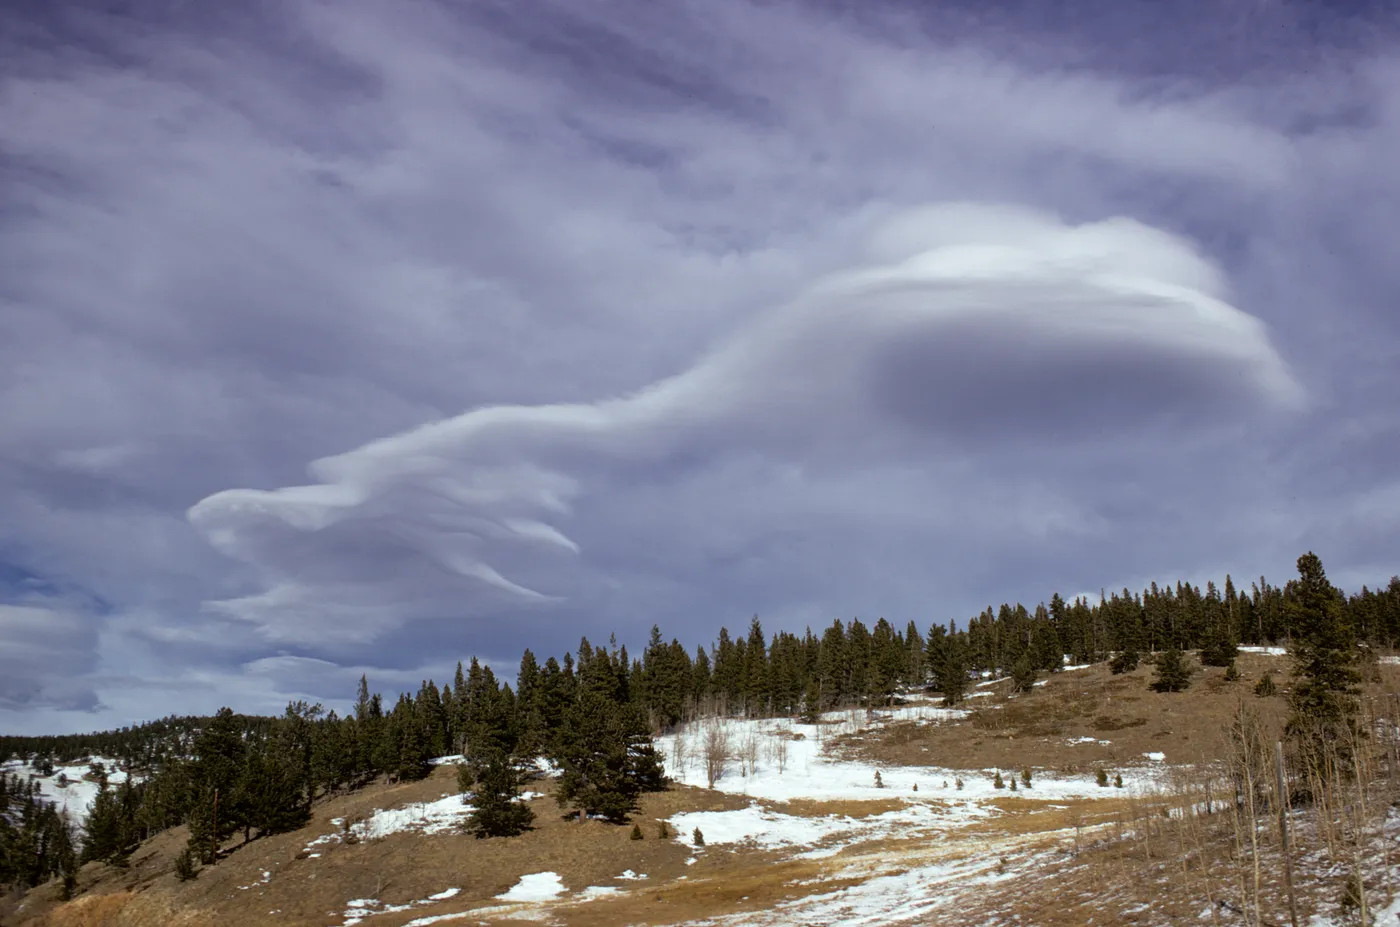
Stable air forced over a ridge shows its springiness on a large scale. The FAA: "In order for gravity waves to develop, the atmosphere must possess at least some degree of static stability. As stable air is deflected vertically by an obstacle (e.g., when an air mass moves over a mountain ridge), it resists the displacement because as it rises, it is heavier than the air surrounding it, and gravity is acting to return it to its equilibrium level." It overshoots on the way down, then back up, "and continues through a period of oscillations before the resulting wave motion dampens out." When the air is moist enough, the waves produce "sharp-edged, lens-shaped (or almond-shaped) lenticular clouds," which "provide visual proof that mountain waves exist. However, these clouds may be absent if the air is too dry." The handbook also warns that "extremely severe wind events can occur with little or no visual warning of their presence."[2]
Reading stability from a sounding
With a sounding in front of you, this order covers stability before any index.
- The ground. Is there an inversion at the surface (night, stable boundary layer) or a superadiabatic layer (sunny afternoon)? Compare the time of the sounding with the time you care about.
- The mixed layer. Where does the temperature trace follow a dry adiabat, and how deep is it? Its top is where thermals stop and, if the air is humid enough, where cumulus bases form.
- Stable layers aloft. Inversions and isothermal layers, and whether the dew point drops through them (a subsidence inversion or an EML base) or rises (a frontal inversion).
- The mid-levels. The 700 to 500 hPa lapse rate. Near 6 is ordinary; 8 or more usually means an elevated mixed layer.
- Moisture with height. Does θe fall with height? If the moist layer is under dry air, the column is potentially unstable, and large-scale lifting will steepen it.
- The parcel. Only now lift a parcel and read CAPE and CIN, which combine all of the above into two numbers. The next lesson covers them.
Check yourself
-
A layer cools 7 °C per kilometer. Unsaturated air is lifted through it. Does the air keep rising?
Answer
No. Unsaturated air cools at the dry rate, 9.8 °C per kilometer, faster than the surroundings, so after 1 km it is 2.8 °C colder than the air around it and sinks back. The layer is conditionally unstable: stable for unsaturated air, unstable for saturated air.
-
Is a layer with a lapse rate of 6 °C per kilometer stable or conditionally unstable?
Answer
It depends on its temperature and pressure. Warm saturated air near sea level cools at 3.5 to 4.5 °C per kilometer, so a warm layer at 6 is conditionally unstable; saturated air at −10 to −30 °C and 500 hPa cools at about 6.4 to 8.7, so a cold layer at 6 is absolutely stable.
-
Potential temperature is constant from 300 m to 3.9 km and decreases below 300 m. Describe the layers.
Answer
A superadiabatic, absolutely unstable layer at the ground, under a well-mixed layer that is neutral for unsaturated air: the afternoon boundary layer over hot ground, as at Las Vegas on June 20, 2024.
-
Why is fog often thickest and longest-lasting on clear, calm winter nights?
Answer
The ground radiates heat to the clear sky and cools the air in contact with it, forming a stable boundary layer or surface inversion. Calm wind does not mix it away, and the short winter day may not heat the ground enough to break it.
-
θe is 350 K at the ground and 325 K at 2 km, and there is an inversion between them. Is the column dangerous?
Answer
Potentially. It is stable to small displacements because of the inversion, but θe falls with height, so it is potentially unstable: lifted bodily until saturated by a front, dryline or upper-level trough, its lapse rate becomes steeper than the moist rate.
-
The 700 to 500 hPa lapse rate over Kansas is 8.8 °C per kilometer in May. What is the likely source of the air?
Answer
An elevated mixed layer: air mixed nearly dry adiabatically over the high terrain of the Southwest or Mexico and carried east above the humid Gulf air. Such values occur in about one May sounding in five at Dodge City.
-
Smoke from a chimney spreads out flat at a fixed height at dawn. What does that say about the air?
Answer
It is statically stable, probably an inversion: the plume is fanning. As morning heating mixes the stable layer away, the plume can be expected to spread vertically, and to loop once the air above hot ground turns unstable.
Video


Methods
Soundings are the observed radiosonde records in the University of Wyoming archive, plotted
by WeatherOverTime's own code; the Las Vegas and Fairbanks soundings are the high-resolution
records, about one level per second. Lapse rates over a layer are the temperature difference
between its ends divided by the height difference, with temperatures interpolated linearly
in the logarithm of pressure (named pressure levels) or in height (named heights). The moist
adiabatic lapse rate is the pseudoadiabatic rate, without ice or water loading, from the
same thermodynamics as the skew-T lesson (Bolton 1980 saturation vapor pressure), converted
to height with the hydrostatic equation. Potential temperature uses Rd/cp
= 0.2857 and θe Bolton's equation 43. The Las Vegas mixed layer is the highest level above
300 m still within 0.5 K of the mean potential temperature between 300 and 1,500 m. The
Brunt–Väisälä frequencies use dry potential temperature, not virtual. In the lifted-layer
figure, every reported level from the ground to 753 hPa is lifted by the same pressure
difference, dry-adiabatically to its own lifted condensation level and pseudoadiabatically
above it; the lifted layer's depth comes from the hypsometric equation with its mean
temperature. The climatology uses every 00 and 12 UTC sounding in the Iowa Environmental
Mesonet archive from 2015 through 2024 at Dodge City, Norman, Albany and Miami, at the
surface and mandatory pressure levels; the 0 to 3 km lapse rate interpolates the
temperature at 3 km above the surface linearly in height between mandatory levels, and
values outside −5 to 11 °C per kilometer (700 to 500 hPa) or −15 to 14 (0 to 3 km) were
discarded as bad data. The displacement figure and the regime chart's curves are
idealized. The code and data are in the site's repository under
scripts/learn/.
Related
The process rates this lesson compares against are derived in Air parcels and adiabatic cooling. The next lesson, CAPE, CIN and instability, turns a lifted parcel into energy; Inversions and the cap follows the stable layers. How to read a skew-T reads all of it off the chart forecasters use, and in Storm Lab a storm can be grown from an observed sounding. Unfamiliar terms are in the glossary.
Sources
Quotations are verbatim from the source named. The AMS Glossary refused automated requests during the research, so its entries were read from Internet Archive copies of the same pages, captured 2023 to 2025. Figures and values marked "computed here" are described under Methods.
- American Meteorological Society, Glossary of Meteorology, entries lapse rate, environmental lapse rate, process lapse rate, parcel method, static stability, absolute stability, neutral equilibrium, conditional instability, absolute instability, superadiabatic lapse rate, autoconvective lapse rate, Brunt–Väisälä frequency, stable boundary layer, mixed layer, potential instability, standard atmosphere and fanning.
- Federal Aviation Administration, Aviation Weather Handbook, FAA-H-8083-28, 2022: chapter 13 (atmospheric stability), section 16.2.1 (gravity waves), sections 18 (haze, drizzle) and 19.2.1 (convective turbulence), and the thunderstorm chapter.
- Federal Aviation Administration, Pilot's Handbook of Aeronautical Knowledge, FAA-H-8083-25, chapter 12, Weather Theory: atmospheric stability, air masses.
- Storm Prediction Center, mesoanalysis help: mid-level lapse rates and low-level lapse rates.
- University of Wyoming, Department of Atmospheric Science, upper-air soundings: Fairbanks, AK (70261) 12 UTC January 24, 2024; Las Vegas, NV (72388) 12 UTC June 20 and 00 UTC June 21, 2024; Dodge City, KS (72451) and Albuquerque, NM (72365) 00 UTC June 7, 1990; Norman, OK (72357) 12 UTC May 20, 2013.
- Iowa Environmental Mesonet, Iowa State University, RAOB sounding archive (Dodge City, Norman, Albany and Miami, 2015 to 2024) and ASOS observations (Las Vegas Harry Reid International Airport, June 20 to 21, 2024; Fairbanks International Airport, January 24, 2024).
- Peter C. Banacos and Michael L. Ekster, The Association of the Elevated Mixed Layer with Significant Severe Weather Events in the Northeastern United States, Weather and Forecasting 25, 1082 to 1102, 2010 (doi:10.1175/2010WAF2222363.1), copy hosted by Penn State; including its citations of Carlson and Ludlam (1968) and Fawbush and Miller (1954).
- WeatherOverTime, How to read a skew-T diagram, for the Norman sounding of May 20, 2013.
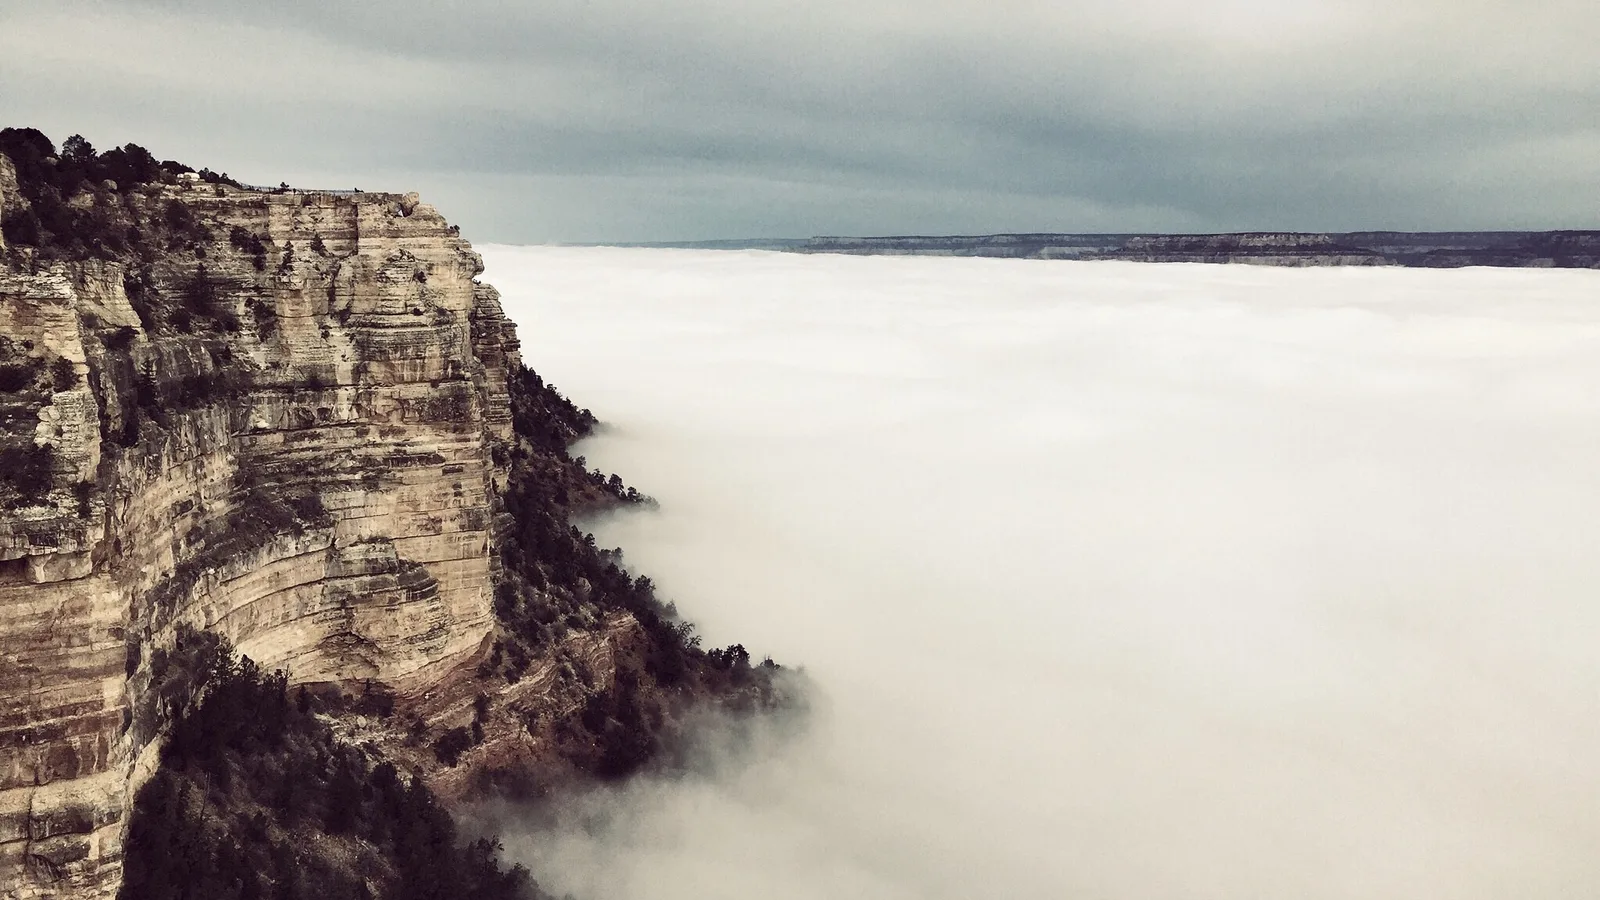
- Kyle Holmquist, NOAA Photo Library image con00320, A temperature inversion causing a sea of fog at the Grand Canyon, December 11, 2014, NOAA Weather in Focus Photo Contest 2015, public domain.
- Ryan Knapp, NOAA Photo Library image con00393, Stratus over Mount Washington, New Hampshire, September 2014, NOAA Weather in Focus Photo Contest 2015, public domain.
- NOAA OAR/ERL Historical Collection, NOAA Photo Library image wea03600, Lenticular clouds over the Front Range of the Rocky Mountains, about 1975, public domain.
- National Severe Storms Laboratory, NOAA Photo Library image nssl0082, Towering Cumulus, September 1969, public domain.
- The COMET Program/MetEd, Static Stability Defined, YouTube.
- The COMET Program/MetEd, Conditional Stability, YouTube.
- The COMET Program/MetEd, Potential Stability, YouTube.
- NWS Burlington (NWSBurlington), The Elevated Mixed Layer and its role in Severe Weather in the Northeast (Part 1), YouTube.
.jpg)
.jpg)
.jpg)

Corrections: contact@weatherovertime.com.
Unit 2: Stability and instability
- Air parcels and adiabatic cooling
Why rising air cools, at the dry rate and then the moist rate.
- Lapse rates and stability
Stable, unstable and conditionally unstable air, read from the temperature profile.
- CAPE, CIN and instability
The energy for an updraft, the energy against one, and the three ways to lift a parcel.
- Inversions and the cap
Radiation, subsidence and frontal inversions, and the elevated mixed layer.