Unit 2 · Stability and instability
CAPE, CIN and instability
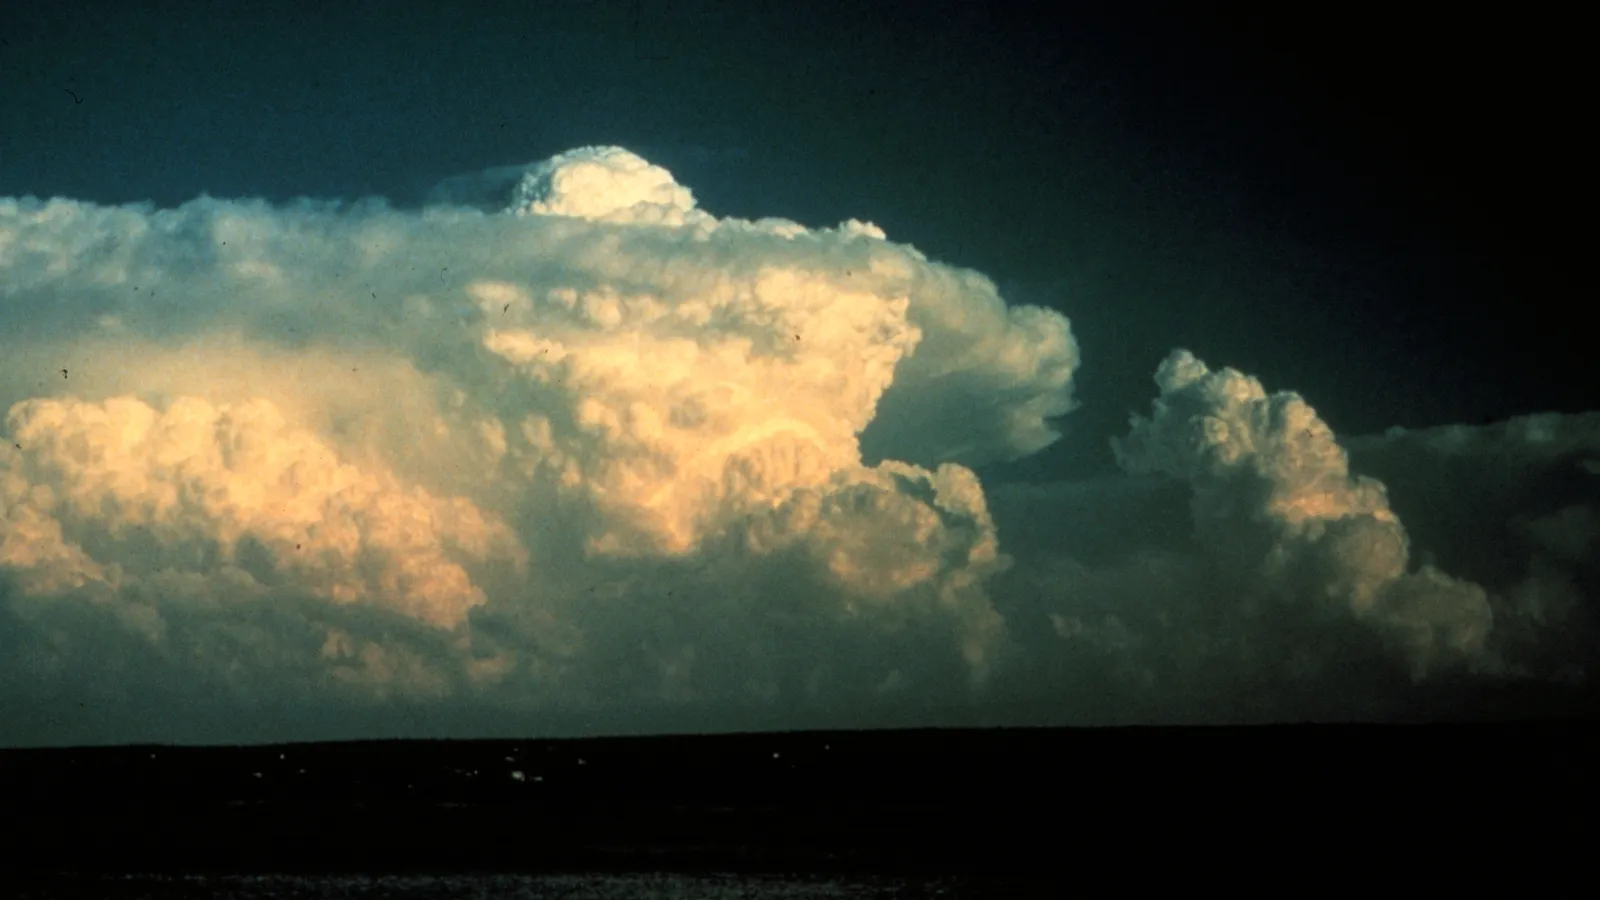
Every thunderstorm starts with air that is warmer than the air around it and rises for that reason alone. CAPE measures how much energy that warmth can supply to a rising parcel, and CIN measures how much energy has to be spent to get the parcel to the point where it rises on its own. This lesson writes both out as the sums they are, shows what they say about updraft speed and what they leave out, compares the parcels forecasters lift, and follows one day from a capped morning to an evening with more than 5,000 J/kg of CAPE outside Washington: June 29, 2012, a few hours before a derecho arrived.
- CAPE and CIN as integrals: buoyancy summed over height, and why the virtual temperature correction matters most when CAPE is small.
- From CAPE to updraft speed: the square root of twice the CAPE, and why real updrafts reach about half of it.
- Which CAPE: surface-based, mixed-layer, most-unstable, downdraft and 0 to 3 km, and what each is for.
- The shape of the positive area, fat against skinny, and normalized CAPE.
- How much is a lot: ten years of soundings at five stations, and the largest values in the record.
- How CIN is removed, and the three ways air is lifted to its level of free convection.
- A worked day from two observed soundings, computed here and checked against two other programs.
Buoyancy
The AMS Glossary defines buoyancy in the atmosphere as "the upward force exerted upon a parcel of fluid (or an object within the fluid) in a gravitational field by virtue of the density difference between the parcel (or object) and that of the surrounding fluid."[1] Per kilogram of air, the force is an acceleration:
B = g (Tvp − Tve) / Tve
where g is the acceleration of gravity, 9.81 m/s², and Tvp and Tve are the virtual temperatures of the parcel and of the environment in kelvins. Density is what matters, and virtual temperature is the temperature that stands in for it: in the AMS definition, "the temperature that dry air would have if its pressure and density were equal to those of a given sample of moist air."[1] Water vapor is lighter than dry air, so moist air has a virtual temperature slightly above its real one.
The numbers are small. A parcel 1 K warmer than air at 300 K has a buoyancy of 9.81 / 300, 0.033 m/s², a third of a percent of gravity. What makes it matter is distance: that small push, kept up over ten kilometers of rising, is what drives a thunderstorm updraft. The lessons on air parcels and lapse rates explain why a lifted parcel ends up warmer or colder than its surroundings; this one measures how much energy follows from it.
CAPE and CIN as integrals
Convective available potential energy is buoyancy added up over the height through which it acts. The AMS writes it as "the following vertical integral," from the parcel's level of free convection (LFC) to its level of neutral buoyancy, the equilibrium level (EL), "where B is the buoyancy of an undiluted air parcel," and adds that "to determine B, the virtual temperature is commonly used."[1]
CAPE = ∫LFCEL g (Tvp − Tve) / Tve dz
Buoyancy is an acceleration and height a distance, so their product has units of m²/s², the same as joules per kilogram: work done per kilogram of air. With the hydrostatic equation the same integral can be taken in pressure instead of height, which is how convective inhibition is written in the AMS entry: the integral of Rd (Tvp − Tve) d ln p from the parcel's starting pressure to the LFC, where Rd is the gas constant for dry air, 287 J/(kg·K).[1] The AMS defines CIN as "the energy needed to lift an air parcel upward adiabatically to the lifting condensation level (LCL) and then as a pseudoadiabatic process from the LCL to its level of free convection (LFC)."[1] Where the parcel is colder than its surroundings, the integrand is negative, so CIN is reported as a negative number or as the size of that negative area.
- Positive buoyancy (CAPE)
- Negative buoyancy (CIN)
- Parcel speed, √(2 × CAPE so far)
- Half the parcel speed
Table: buoyancy and undiluted speed of the mixed-layer parcel, Sterling, 00 UTC June 30, 2012
| Height, km | Buoyancy, m/s² | Virtual temperature excess, K | Undiluted speed, m/s |
|---|---|---|---|
| 1 | −0.007 | −0.2 | 0 |
| 2 | 0.043 | 1.3 | 3 |
| 3 | 0.156 | 4.5 | 15 |
| 4 | 0.238 | 6.8 | 24 |
| 6 | 0.493 | 13.2 | 47 |
| 8 | 0.579 | 14.7 | 66 |
| 10 | 0.636 | 15.3 | 82 |
| 12 | 0.503 | 11.4 | 95 |
| 13 | 0.405 | 8.9 | 100 |
| 14 | 0.320 | 6.8 | 103 |
Read this way, CAPE is a profile before it is a number. The figure shows where the energy is: very little in the first few kilometers above the LFC, most of it between 5 and 14 km, where the parcel, having condensed most of its water vapor and released the latent heat, is far warmer than the cold upper troposphere around it. Two soundings with the same CAPE can put it in very different places, which is the subject of the section on fat and skinny CAPE.
Three assumptions sit inside the integral, and the AMS names them: the parcel is undiluted (it mixes with nothing); its pressure is "the same as that of the environment"; and "the value depends on whether the parcel is lifted adiabatically (no water loss, condensates retained) or pseudo-adiabatically (all condensates fall out immediately upon forming)."[1] Operational CAPE uses the pseudoadiabatic version. Each assumption is broken by a real updraft, and each comes back in the section on updraft speed.
The virtual temperature correction
A parcel lifted from the moist air near the ground carries more water vapor than the air it rises through, and so is lighter than its temperature alone suggests. Using temperature in place of virtual temperature leaves that out. Doswell and Rasmussen (1994) worked out how much it matters: "while ignoring the virtual correction does not introduce much error for large CAPE values, the relative error can become substantial for small CAPE." Their examples: 4,737 J/kg with the correction and 4,390 without at Wallops Island, Virginia, a difference of 7.3 percent, and 402 against 341 at Tallahassee, Florida, 15.2 percent.[6]
Table: CAPE with and without the virtual temperature correction, every parcel plotted
| Sounding, parcel | Without, J/kg | With, J/kg | Added, % |
|---|---|---|---|
| LBF 1999-07-03 00, SB | 8,925 | 9,471 | 5.8 |
| ILX 2016-07-25 00, SB | 8,237 | 8,830 | 6.7 |
| ABR 2011-07-19 00, MU | 6,820 | 7,315 | 6.8 |
| ABR 2011-07-19 00, SB | 6,493 | 6,964 | 6.8 |
| IAD 2012-06-30 00, MU | 6,338 | 6,754 | 6.2 |
| LBF 1999-07-03 00, ML | 6,403 | 6,741 | 5.0 |
| DVN 2012-06-29 12, MU | 6,294 | 6,686 | 5.9 |
| ABR 2011-07-19 00, ML | 5,983 | 6,411 | 6.7 |
| SGF 2022-06-13 00, SB | 5,573 | 5,874 | 5.1 |
| IAD 2012-06-30 00, ML | 5,110 | 5,458 | 6.4 |
| OUN 2013-05-20 18, SB | 4,564 | 4,892 | 6.7 |
| IAD 2012-06-30 00, SB | 4,486 | 4,802 | 6.6 |
| OUN 2013-05-20 12, MU | 4,166 | 4,458 | 6.5 |
| ILX 2016-07-25 00, ML | 4,028 | 4,333 | 7.0 |
| SGF 2022-06-13 00, ML | 3,860 | 4,058 | 4.9 |
| ILX 2022-06-13 00, SB | 3,416 | 3,669 | 6.9 |
| SGF 2022-06-12 12, MU | 3,347 | 3,571 | 6.2 |
| IAD 2012-06-29 12, MU | 3,314 | 3,552 | 6.7 |
| MFL 2023-07-22 12, MU | 3,064 | 3,389 | 9.6 |
| SGF 2022-06-12 12, ML | 3,005 | 3,205 | 6.2 |
| ILX 2022-06-12 12, MU | 2,885 | 3,069 | 6.0 |
| OUN 2013-05-20 18, ML | 2,730 | 2,920 | 6.5 |
| DDC 2016-05-24 12, MU | 2,722 | 2,879 | 5.5 |
| MFL 2023-07-22 12, SB | 2,336 | 2,610 | 10.5 |
| ILX 2022-06-13 00, ML | 2,410 | 2,588 | 6.9 |
| CHS 2025-07-15 12, MU | 2,213 | 2,492 | 11.2 |
| SGF 2022-06-12 12, SB | 2,221 | 2,380 | 6.7 |
| MFL 2023-07-22 12, ML | 2,069 | 2,321 | 10.9 |
| OUN 2013-05-20 12, ML | 2,119 | 2,284 | 7.2 |
| DDC 2016-05-24 12, ML | 2,154 | 2,282 | 5.6 |
| DDC 1990-06-07 00, SB | 1,965 | 2,142 | 8.2 |
| BGI 2025-07-15 12, MU | 1,826 | 2,063 | 11.5 |
| BGI 2025-07-15 12, SB | 1,823 | 2,060 | 11.5 |
| DDC 2016-05-24 12, SB | 1,935 | 2,052 | 5.7 |
| DVN 2012-06-29 12, ML | 1,902 | 2,031 | 6.3 |
| OUN 2013-05-20 12, SB | 1,686 | 1,829 | 7.8 |
| IAD 2012-06-29 12, ML | 1,665 | 1,799 | 7.5 |
| DDC 1990-06-07 00, ML | 1,639 | 1,780 | 7.9 |
| ILX 2022-06-12 12, ML | 1,654 | 1,773 | 6.7 |
| IAD 2025-07-15 12, SB | 1,535 | 1,753 | 12.4 |
| SJU 2025-07-15 12, SB | 1,216 | 1,416 | 14.1 |
| CHS 2025-07-15 12, SB | 1,135 | 1,357 | 16.4 |
| CHS 2025-07-15 12, ML | 937 | 1,142 | 18.0 |
| BGI 2025-07-15 12, ML | 902 | 1,087 | 17.0 |
| TOP 1992-04-09 12, MU | 956 | 1,047 | 8.7 |
| ILX 2022-06-12 12, SB | 829 | 904 | 8.3 |
| SJU 2025-07-15 12, ML | 360 | 444 | 18.9 |
| ABQ 1990-06-07 00, SB | 366 | 422 | 13.2 |
| CRP 2017-08-26 00, SB | 316 | 380 | 16.9 |
| ALB 2025-07-15 12, MU | 171 | 263 | 35.1 |
| IAD 2025-07-15 12, ML | 180 | 262 | 31.5 |
| DNR 2013-06-11 00, SB | 196 | 219 | 10.6 |
| BGI 2025-01-15 12, MU | 123 | 213 | 42.3 |
| BGI 2025-01-15 12, SB | 111 | 197 | 43.4 |
| IAD 2012-06-29 12, SB | 143 | 188 | 23.9 |
| CRP 2017-08-26 00, ML | 147 | 180 | 18.3 |
| CAR 2025-07-15 12, MU | 83 | 141 | 41.0 |
| ITO 2024-07-15 12, MU | 87 | 131 | 33.5 |
| LBF 2024-10-10 12, MU | 62 | 118 | 47.6 |
| OAK 2024-07-15 12, MU | 73 | 116 | 37.6 |
| LBF 2024-10-10 00, SB | 68 | 88 | 22.3 |
| LBF 2024-10-10 00, MU | 68 | 88 | 22.3 |
| ITO 2024-07-15 12, ML | 39 | 65 | 39.8 |
| CAR 2025-07-15 12, SB | 34 | 63 | 46.4 |
| ALB 2025-07-15 12, SB | 23 | 45 | 48.4 |
| FWD 2013-12-06 00, MU | 35 | 39 | 11.7 |
| ITO 2024-07-15 00, SB | 16 | 38 | 58.0 |
| ITO 2024-07-15 12, SB | 18 | 33 | 45.7 |
| SJU 2025-01-15 12, SB | 24 | 31 | 20.6 |
| ABQ 1990-06-07 00, ML | 15 | 23 | 34.0 |
| ALB 2025-07-15 12, ML | 5 | 17 | 70.0 |
| BGI 2025-01-15 12, ML | 1 | 16 | 95.9 |
| SJU 2025-01-15 12, ML | 10 | 12 | 18.0 |
| YVP 2025-07-15 12, SB | 11 | 12 | 6.5 |
| DVN 2012-06-29 12, SB | 9 | 11 | 21.9 |
The correction also shrinks CIN, because the parcel is lighter through the stable layer as well: the same Sterling parcel has −35 J/kg of CIN without it and −14 with it. Doswell and Rasmussen recommended a standard, whose first two points the Storm Prediction Center's parameters follow: "(i) Use the simple pseudoadiabatic, pure parcel theory calculation for the lifted parcel ascent. (ii) Make the virtual correction. (iii) Pick the most unstable parcel in the lowest 300 mb."[4][6] Not every program does. The Iowa Environmental Mesonet computes CAPE for every archived US sounding with the MetPy library, and its CAPE values for the soundings in this lesson match the calculation here without the correction to within 2 percent: 5,121 J/kg for the Sterling parcel above.[3] The practical rule is the one Doswell and Rasmussen stated: compare CAPE values only when they were computed the same way.
From CAPE to updraft speed
If buoyancy were the only force on a parcel, the work it does would all become kinetic energy, ½w², and the vertical speed at the EL would follow directly:
wmax = √(2 × CAPE)
The National Weather Service office in Louisville gives the formula and a range: "a range of CAPE of 1500-2500 J/kg gives a w-max range of about 50-70 m/s (100-140 kts). However, due to water loading, mixing, entrainment, and evaporative cooling, the actual w-max is approximately one-half that calculated above."[5] The AMS makes the same point in its definition: "not all of the work done by the buoyancy force is converted to kinetic energy," and CAPE "can be viewed as the maximum kinetic energy that could be gained by a rising air parcel due to work done by buoyancy."[1]
| CAPE, J/kg | √(2 CAPE), m/s | mph | Half, m/s |
|---|---|---|---|
| 500 | 32 | 71 | 16 |
| 1,000 | 45 | 100 | 22 |
| 2,500 | 71 | 158 | 35 |
| 5,000 | 100 | 224 | 50 |
Why real updrafts fall short:
- Entrainment
- Entrainment is "the mixing of environmental air into a preexisting organized air current so that the environmental air becomes part of the current."[1] The air drawn in is cooler and drier than the updraft, and evaporating cloud into it cools the updraft further, so a real updraft is less buoyant than the undiluted parcel. Peters and coauthors (2023) summarize the modeling: weakly sheared updrafts with large entrainment "often only realize a small fraction (e.g., 20-30%)" of their CAPE as kinetic energy, while "squall lines and supercells with smaller fractional entrainment rates and less dilution can realize much larger fractions of their CAPE as KE (i.e., 80-100%)."[7]
- Water loading
- Cloud and rain carried in the updraft add weight, which the AMS calls liquid water loading: "The higher the liquid water loading, the greater the average density and colder the virtual temperature of the parcel."[1] By the AMS form of virtual temperature that includes condensate, each gram of water per kilogram of air lowers the virtual temperature by about 0.1 percent of the temperature: 0.25 K at −23 °C, the equivalent of losing a quarter of a degree of buoyancy for every gram carried.
- Pressure
- The integral assumes the parcel's pressure equals the environment's. In a real storm the updraft pushes air aside above it and is pushed back, and the pressure differences this sets up can slow it or speed it. Peters and coauthors note that in supercells the maximum updraft can exceed √(2 CAPE) "for extended periods of time," and name "vertical pressure gradient accelerations" as one reason updrafts are "sometimes more intense than buoyancy alone would suggest."[7]
The two rules of thumb agree. Half the speed is a quarter of the kinetic energy, the low end of the 20 to 30 percent that weakly sheared updrafts realize. In the simulations Peters and coauthors examined, √(2 CAPE) explained only 38 percent of the variation in the actual maximum updraft, with a typical error of about 15 m/s; a version of CAPE that accounts for entrainment cut the error to 6.4 m/s.[7] CAPE sets a ceiling on updraft strength. How close a storm comes to it depends on how wide its updraft is, and so on the wind shear that organizes it.
Which CAPE
CAPE belongs to a parcel, and the number depends on which air is lifted. The skew-T lesson introduces the three that the Storm Prediction Center reports. Each of the three help pages says: "No parcel entrainment is considered. The CAPE and CIN calculations use the virtual temperature correction."[4]
| Quantity | Air lifted (SPC) | Sterling, 7 pm, J/kg | When it matters |
|---|---|---|---|
| Surface-based CAPE | "a parcel of air originating at the surface" | 4,802 (CIN −33) | Storms rooted at the ground; overstates CAPE when a thin layer at the ground is much moister than the air above it |
| Mixed-layer CAPE | "parcels of air located in the lowest 100-mb" | 5,458 (CIN −14) | Afternoon storms, which draw on a deep layer; the default for severe weather and the parcel in the tornado parameters |
| Most-unstable CAPE | "the maximum equivalent potential temperature (within the lowest 300-mb of the atmosphere)" | 6,754 (CIN −5) | Night, and north of fronts, where the best air is above a stable layer; SPC shows its starting height so that "the largest CAPE is 'elevated'" can be seen |
| 0 to 3 km CAPE | "CAPE in the lowest 3-km above ground level" | 116 (mixed layer) | Tornadoes: large values "tend to favor strong low-level stretching" |
| Downdraft CAPE | Rain-cooled air sinking to the ground | 1,605 | Damaging winds: "Larger DCAPE values are associated with stronger downdrafts" |
Quotations are from the Storm Prediction Center's mesoanalysis help pages; the values are computed here from the 00 UTC sounding at Sterling, Virginia, launched at 7:11 pm EDT on June 29, 2012.[2][3][4] On this evening the order is unusual: the mixed-layer CAPE exceeds the surface-based, because the air at the ground (36.0 °C, dew point 23.0 °C) was slightly drier than the air just above it, and the most-unstable parcel starts only 101 m up, at 984 hPa, where the dew point was 25.0 °C. The three numbers span 2,000 J/kg on one sounding, and the most unstable of them depends on a single reported level. The spread is itself information: the more the numbers disagree, the more the answer depends on details of the lowest kilometer that a single balloon may not represent.
The 0 to 3 km value is small here because the LFC was nearly 2 km up, leaving only a kilometer of positive area below 3 km. SPC's help for its violent tornado parameter says that "0-3 km CAPE and 0-3 km lapse rate were notable discriminators of violent tornado environments"; the value matters most where the LFC is low and the air near the ground accelerates quickly.[4]
Downdraft CAPE
The same arithmetic runs in reverse for air that sinks. The AMS defines downdraft CAPE as "the maximum energy available to a descending parcel, according to parcel theory," taken from the parcel's "level of free sink to some lower level, usually the surface."[1] The descending parcel is air from the dry middle levels into which rain falls: evaporation cools it to its wet-bulb temperature, and it then sinks, warming at the saturated adiabatic rate while rain keeps evaporating into it. If it stays colder than the air around it all the way down, it arrives at the ground as a strong downdraft and spreads out as a gust front.
- Temperature
- Dew point
- Descending parcel
- Downdraft CAPE
Like CAPE, DCAPE is a ceiling, not a forecast of wind speed: the parcel is assumed to stay saturated all the way down, which needs a great deal of rain. The University of Wyoming's program, with its own choice of starting parcel, gives 1,860 J/kg for the same sounding.[2] Either value is large. About three hours after this balloon went up, the derecho's gust front crossed Dulles Airport, next to the launch site, with a measured gust of 71 mph.[14]
Fat and skinny CAPE
The integral adds up buoyancy without regard to where it is. Blanchard (1998) proposed dividing CAPE by the depth over which it accumulates: "The normalized CAPE (NCAPE) is defined as the total CAPE divided by the depth of the FCL," his name for the layer from the LFC to the EL, and "has units of joules per kilogram per meter, which simplifies to meters per second squared (i.e., an acceleration)."[8] Normalized CAPE is the average buoyancy over the free convective layer. He cited Lucas and coauthors' contrast between oceanic and continental soundings: over the ocean "the positive area on the sounding is generally 'skinny' with small instability, but is maintained through a large fraction of the troposphere," while over land it is "'fat' with large instability but over a shallower depth of the troposphere."[8]
Table: the two mixed-layer parcels
| Dodge City | Miami | |
|---|---|---|
| CAPE, J/kg | 2,282 | 2,321 |
| CIN, J/kg | −199 | −11 |
| LFC, km above ground | 2.6 | 1.2 |
| EL, km above ground | 11.3 | 14.8 |
| Normalized CAPE, m/s² | 0.263 | 0.171 |
| Peak buoyancy, m/s² | 0.390 | 0.281 |
| Peak virtual temperature excess, K | 9.7 | 7.5 |
Blanchard's point is about acceleration: "Parcels will experience greater accelerations when large values of CAPE are a result of large buoyancy rather than great depth between the LFC and EL."[8] The Louisville office draws the forecasting consequence: a long, narrow profile means "slower updraft acceleration but taller thunderstorms which is best for high precipitation efficiency," a short, fat one "a more rapid vertical acceleration which would be important for potential development of updraft rotation within the storm."[5] Tropical soundings are the skinny case: deep, moist, with modest buoyancy through most of the troposphere, and heavy rain rather than violent updrafts. The Plains sounding, with its steep lapse rates aloft, is the fat one.
How much is a lot
The Storm Prediction Center assigns words to CAPE in its forecasts, and asks that the product "specify which lifted parcel was used":[16]
| CAPE, J/kg | SPC descriptor |
|---|---|
| 0 to 1,000 | Marginally unstable |
| 1,000 to 2,500 | Moderately unstable |
| 2,500 to 4,000 | Very unstable |
| 4,000 and more | Extremely unstable |
What counts as a lot also depends on where and when. Brooks, Lee and Craven (2003), comparing reanalysis soundings, found that "while 1000 J kg⁻¹ of CAPE is not common in the United States (≈7% of all soundings), it occurs much less often in Europe (≈1%) and 2000 J kg⁻¹ is almost unknown in Europe."[9] Taszarek and coauthors (2020) put the tail of the US distribution for thunderstorm environments at "6000–8000 J kg⁻¹ over the United States," against 3000–4000 for Europe.[10]
- Miami, FL
- Norman, OK
- Omaha, NE
- Aberdeen, SD
- Albany, NY
Table: evening (00 UTC) mixed-layer CAPE by month, 2015–2024, median / 90th percentile, J/kg
| Month | Miami, FL | Norman, OK | Omaha, NE | Aberdeen, SD | Albany, NY |
|---|---|---|---|---|---|
| Jan | 0 / 379 | 0 / 0 | 0 / 0 | 0 / 0 | 0 / 0 |
| Feb | 1 / 423 | 0 / 0 | 0 / 0 | 0 / 0 | 0 / 0 |
| Mar | 2 / 540 | 0 / 200 | 0 / 0 | 0 / 0 | 0 / 0 |
| Apr | 62 / 1,176 | 0 / 895 | 0 / 33 | 0 / 0 | 0 / 0 |
| May | 422 / 1,528 | 178 / 2,607 | 0 / 423 | 0 / 141 | 0 / 32 |
| Jun | 1,004 / 2,014 | 791 / 2,725 | 129 / 1,927 | 1 / 1,052 | 0 / 210 |
| Jul | 1,237 / 2,212 | 916 / 2,432 | 433 / 2,818 | 82 / 2,029 | 6 / 594 |
| Aug | 1,342 / 2,256 | 718 / 2,213 | 195 / 2,297 | 22 / 1,773 | 6 / 599 |
| Sep | 1,087 / 1,975 | 188 / 1,451 | 0 / 1,379 | 0 / 839 | 0 / 80 |
| Oct | 391 / 1,385 | 0 / 726 | 0 / 4 | 0 / 0 | 0 / 2 |
| Nov | 26 / 842 | 0 / 0 | 0 / 0 | 0 / 0 | 0 / 0 |
| Dec | 1 / 722 | 0 / 0 | 0 / 0 | 0 / 0 | 0 / 0 |
Over all months, at least half of Norman's evening soundings have no mixed-layer CAPE at all, and 16 percent have 1,000 J/kg or more; at Miami, 26 percent do, at Omaha 9, at Aberdeen 5 and at Albany fewer than 1 in 100. Miami has instability more often; the Plains stations have more of it on their best days. Norman's 99th percentile is 3,290 J/kg, Miami's 2,529.[3]
The largest values
Nobody keeps an official record of CAPE, and the largest values are the least certain, because they rest on the few meters of air at the ground. The Storm Prediction Center's baseline study of sounding parameters inspected by hand "all soundings with MUCAPE and/or MLCAPE greater than 5000 J kg⁻¹" before using them.[11] Four soundings, computed here three ways:
| Sounding | Surface air | Surface-based | Mixed-layer | Most-unstable | Wyoming MU |
|---|---|---|---|---|---|
| North Platte, NE, 7 pm CDT July 2, 1999 | 31.6 °C, dew point 25.6 | 9,471 | 6,741 | 9,471 | 7,763 |
| Lincoln, IL, 7 pm CDT July 24, 2016 | 33.0 °C, dew point 28.9 | 8,830 | 4,333 | 8,830 | 5,132 |
| Aberdeen, SD, 7 pm CDT July 18, 2011 | 32.6 °C, dew point 26.6 | 6,964 | 6,411 | 7,315 | 7,249 |
| Sterling, VA, 7 pm EDT June 29, 2012 | 36.0 °C, dew point 23.0 | 4,802 | 5,458 | 6,754 | 5,875 |
CAPE in J/kg, computed here with the virtual temperature correction; the last column is the most-unstable CAPE the University of Wyoming publishes with each sounding.[2] The North Platte and Lincoln values, 9,471 and 8,830, are among the largest CAPE values computed from any US sounding, and both rest on the ground-level reading. At Lincoln the surface dew point of 28.9 °C (84 °F) was 3 °C higher than the reading 100 m up; averaged over the lowest 100 hPa, the CAPE halves. Aberdeen's sounding, from the July 2011 heat wave, is the more robust extreme: every parcel gives more than 6,400 J/kg. Values like these are possible because the air near the ground held more than 20 grams of water vapor per kilogram under a lapse rate steep enough to let a parcel that saturates near 1 km stay warmer than its surroundings to the tropopause.
What CIN means
CAPE is energy the parcel gains once it is free; CIN is energy it must be given first. The AMS: "The negative area typically arises from the presence of a lid, or the amount of kinetic energy that must be added to a parcel to enable that parcel to reach the LFC. Even though other factors may be favorable for development of convection, if convective inhibition is sufficiently large, deep convection will not form."[1]
Read as kinetic energy, CIN converts to a speed the same way CAPE does. To coast through −50 J/kg of CIN on momentum alone, a parcel would need to start upward at √(2 × 50), 10 m/s; through −200 J/kg, at 20 m/s. Air near the ground does not move upward at those speeds except in the strongest lifting, which is why moderate CIN stops convection and why it is removed, not overpowered: the sounding changes until the negative area is small. The Louisville office: "The smaller (larger) the CIN is, the weaker (stronger) must be the amount of synoptic and especially mesoscale forced lift to bring the parcel to its LFC."[5]
The LCL and LFC give the same information in heights. SPC's help for the LCL: "The smaller the difference between the LCL and the LFC, the more likely deep convection becomes. The LFC-LCL difference is similar to CIN (convective inhibition)."[4] At Sterling on the evening of June 29, the surface parcel's LCL was at 1,667 m and its LFC at 1,901 m: little more than 200 m of lifting after the cloud base formed.
Three ways to lift a parcel
NOAA's JetStream lists the ingredients: "All thunderstorms require three ingredients for their formation: Moisture, Instability, and a lifting mechanism," and "the upward motion doesn't happen spontaneously; there needs to be a mechanism which initiates it."[13] Lifting and removing CIN are two views of the same thing. Three kinds of lift do the work, at very different scales and speeds.
1. Heating from below
The sun heats the ground and the ground heats the air above it. The AMS calls convection driven by density differences free convection, and adds that on "a sunny day with a little wind where the ground temperature rises, both kinds of convection," free and forced, "take place."[1] On a skew-T, heating moves the start of the parcel's path to a warmer dry adiabat, which clears more of the cap. Added moisture does the same from the other side: a higher dew point lowers the LCL and puts the parcel on a warmer saturated adiabat. JetStream adds differential heating: "The sun does not uniformly heat the Earth's surface," and the sea breeze is the example of the circulation that results.[13]
- Surface dew point 19.5 °C (7 am)
- Surface dew point 23.0 °C (7 pm)
Table: surface parcel lifted through the 7 am Sterling sounding, J/kg
| Surface temperature, °C | CAPE, dew point 19.5 | CIN, dew point 19.5 | CAPE, dew point 23.0 | CIN, dew point 23.0 |
|---|---|---|---|---|
| 24 | 235 | −944 | 1,623 | −478 |
| 26 | 445 | −793 | 2,052 | −382 |
| 28 | 702 | −642 | 2,457 | −292 |
| 30 | 1,020 | −490 | 2,925 | −195 |
| 32 | 1,381 | −335 | 3,418 | −95 |
| 34 | 1,777 | −187 | 3,889 | −25 |
| 36 | 2,205 | −95 | 4,456 | −2 |
| 38 | 2,618 | −35 | 4,977 | 0 |
| 40 | 3,054 | −8 | 5,505 | 0 |
| 42 | 3,524 | 0 | 5,970 | 0 |
| 44 | 4,024 | 0 | 6,524 | 0 |
| 46 | 4,483 | 0 | 7,024 | 0 |
The figure holds the rest of the sounding fixed, which the atmosphere does not. Heating also deepens the mixed layer and changes the air above the ground, which is why a forecast parcel should be lifted through a forecast sounding. It still shows the order of magnitude: at 7 am the cap needed about 15 °C of heating at the old dew point, or 11 °C with more moisture.
2. Forced ascent at boundaries
Where two air masses meet, the denser one wedges under the other and lifts it. JetStream lists the boundaries: fronts, which "lift warmer, less dense air overtop colder, more dense air"; drylines, where "moist, less dense air is lifted up and over the drier, more dense air"; and outflow boundaries, the leading edge of a storm's rain-cooled air, which "acts as a mini cold front" and "can cause new thunderstorms to form." Terrain does the same: "As air encounters a mountain, it is forced up."[13] The AMS entry for orographic lifting separates "the upward deflection of horizontal larger-scale flow by the orography acting as an obstacle or barrier" from "the daytime heating of mountain surfaces," which is why storms over mountains so often begin on the peaks by early afternoon.[1] Boundaries lift air quickly and along a line, which is why storms so often form in lines along them. A derecho carries its own boundary: the gust front of June 29 lifted the air ahead of it as it went, all the way to the Atlantic.
3. Ascent on the large scale
Ahead of an upper-level trough, a whole region of air rises slowly. Doswell (1987) put the speed in context: "The magnitude of large-scale vertical motion (on the order of a few centimeters per second) is simply too small to accomplish the needed lift in a reasonable time." At 3 cm/s, lifting air one kilometer takes more than nine hours. His conclusion: "large-scale flows create the favorable thermodynamic environment while mesoscale processes serve to provide the lift needed for convective initiation."[12] Large-scale ascent does its work on the cap rather than the parcel: lifting a whole layer cools it, which weakens the inversion and steepens the lapse rate, until a boundary or heating can finish the job.
Elevated instability
When the air at the ground is cool and stable, the CAPE can be above it. The AMS defines elevated convection as "convection that originates from an atmospheric layer above the boundary layer."[1] North of a warm or stationary front, and at night after the ground has cooled the lowest layer, the most-unstable parcel starts above an inversion, and its CAPE is the relevant one; surface-based and even mixed-layer CAPE can be near zero. Storms of this kind are fed by air flowing up over the stable layer, often on a low-level jet, and they tend to produce hail more than tornadoes. The derecho of June 29, 2012 began this way.
- Temperature
- Dew point
- Most-unstable parcel
- Surface parcel
- CAPE of the most-unstable parcel
The National Weather Service's assessment of the event: "The initial thunderstorms that formed the derecho developed north of the west-east oriented boundary over Iowa around sunrise (not shown) and became severe in extreme northeast Illinois around noon."[14] The Davenport sounding, launched about that time, shows what they fed on: nothing at the ground and one of the largest most-unstable CAPE values in the lesson a few hundred meters above it. As the storms moved south and east into the heated air of the Ohio Valley, their outflow lifted surface air as well.
A worked day: June 29, 2012
The Storm Prediction Center's account of the day: "afternoon temperatures near 100 °F and surface dewpoints around 70 °F," and in Washington "the maximum of 104 was the hottest ever observed in June in 142 years." The derecho "moved approximately 700 miles in twelve hours."[15] The National Weather Service counted 13 deaths from the winds and 34 more from heat in the areas left without power.[14] The balloon at Sterling, Virginia, 40 km west of Washington, was launched at 7:11 am and 7:11 pm EDT.[3]
- Temperature
- Dew point
- Surface parcel
- CIN
- CAPE
Table: parcels at Sterling, June 29, 2012, with and without the virtual temperature correction, J/kg
| Parcel | CAPE | CIN | CAPE, no correction | CIN, no correction |
|---|---|---|---|---|
| 7 am, surface | 188 | −981 | 143 | −997 |
| 7 am, mixed-layer | 1,799 | −241 | 1,665 | −287 |
| 7 am, most-unstable | 3,552 | −11 | 3,314 | −44 |
| 7 pm, surface | 4,802 | −33 | 4,486 | −49 |
| 7 pm, mixed-layer | 5,458 | −14 | 5,110 | −35 |
| 7 pm, most-unstable | 6,754 | −5 | 6,338 | −30 |
The steps, in the order a forecaster would take them:
- Morning, all three parcels. Surface-based 188 J/kg with −981 of CIN; mixed-layer 1,799 with −241; most-unstable, from 833 hPa (1.6 km up), 3,552 with −11. The morning's instability is aloft. The surface number describes a thin cooled layer that the sun would remove within hours, and the mixed-layer number is closer to what the afternoon would bring.
- What removes the CIN. Lifted through the morning profile, a surface parcel at the morning's dew point needs 38.5 °C to bring its CIN under 25 J/kg; with the evening's dew point, 34.5 °C (figure above). The day reached both conditions near enough, and the evening sounding shows the inversion mixed out.
- Evening, all three parcels. Surface-based 4,802 with −33; mixed-layer 5,458 with −14; most-unstable 6,754 with −5. Every parcel is extremely unstable by SPC's descriptors, and none is capped.
- Updraft ceiling. √(2 × 5,458) is 104 m/s; half of it, 52 m/s.
- Downdraft potential. DCAPE 1,605 J/kg: dry air at 4.4 km that rain can cool by more than 5 °C.
- Shape. The mixed-layer CAPE is spread from 1.8 to 15.1 km, a normalized CAPE of 0.41 m/s², larger than Dodge City's 0.26: large and fat.
The same soundings, run through two other programs:
| Sterling, June 29, 2012 | This lesson | This lesson, no virtual correction | Iowa Environmental Mesonet | University of Wyoming |
|---|---|---|---|---|
| 7 am, surface-based CAPE / CIN | 188 / −981 | 143 / −997 | 145 / −991 | – |
| 7 am, mixed-layer | 1,799 / −241 | 1,665 / −287 | 1,696 / −274 | – |
| 7 am, most-unstable | 3,552 / −11 | 3,314 / −44 | 3,299 / −42 | 3,525 / −11 |
| 7 pm, surface-based | 4,802 / −33 | 4,486 / −49 | 4,490 / −47 | – |
| 7 pm, mixed-layer | 5,458 / −14 | 5,110 / −35 | 5,121 / −51 | – |
| 7 pm, most-unstable | 6,754 / −5 | 6,338 / −30 | 6,324 / −30 | 5,875 / −8 |
| 7 pm, downdraft CAPE | 1,605 | – | – | 1,860 |
J/kg. Sources: the soundings and Wyoming's indices from its archive; the Mesonet's values from its computed sounding parameters.[2][3] The Mesonet's CAPE values match this lesson's uncorrected ones to within 2 percent, and its CIN values to within 16 J/kg; CIN is small and depends on exactly where the LFC falls. Wyoming's most-unstable CAPE matches this lesson's within 1 percent in the morning, when the most unstable air was 1.6 km up, and is 13 percent lower in the evening, when it was a single reported level 101 m above the ground; Wyoming's program evidently chooses or averages that parcel differently. None of this is an error: it is the spread that any one CAPE number carries, and the reason to know which program and which parcel produced it.
What CAPE does not decide
CAPE says how strong updrafts can be. It does not say what kind of storm will form, and on its own it separates severe from ordinary thunderstorms poorly. Craven and Brooks (2004), in a baseline climatology of sounding parameters, found that "90 percent of the no thunder events had less than 250 J kg⁻¹ of MLCAPE," but that for severe weather "individual parameters did not discriminate well between thunder and severe events. However, when considering both instability and shear ... simultaneously, the results showed a noticeable improvement."[11] The combination of CAPE and wind shear, and the composite parameters built from it, are the subject of a later lesson on severe weather parameters. On June 29, 2012 the deep-layer shear was moderate, 18 m/s (35 knots) between the ground and 6 km in the Mesonet's analysis of the evening Sterling sounding; what made the day exceptional was the instability, and a storm system that organized itself to use it.[3]
Check yourself
-
A parcel is 3 K warmer (in virtual temperature) than air at 270 K. What is its buoyancy?
Answer
9.81 × 3 / 270, about 0.11 m/s².
-
Why is CAPE measured in J/kg, and why is the same quantity also m²/s²?
Answer
It is buoyancy, an acceleration, multiplied by the height over which it acts: m/s² × m = m²/s². That is energy per unit mass, J/kg, the work buoyancy does on each kilogram of rising air.
-
A sounding gives 300 J/kg of CAPE with the virtual temperature correction. Roughly what might a program without it report?
Answer
Noticeably less: for CAPE this small the correction is often 20 to 40 percent of the total, so perhaps 200 J/kg. For 3,000 J/kg it would be only about 7 percent.
-
What updraft speed does 2,000 J/kg of CAPE allow in theory, and what is a more realistic figure?
Answer
√(2 × 2,000) = 63 m/s in theory. Entrainment, water loading and pressure effects cut that to roughly half, about 30 m/s, though a large supercell updraft can come closer to the limit.
-
At 3 am, surface-based CAPE is 0 and most-unstable CAPE is 2,500 J/kg from 850 hPa. What does that mean for storms?
Answer
The ground has cooled and the air near it is stable, but there is unstable air above the inversion. Storms can form in that layer, fed by air flowing up over the stable layer: elevated storms, whose main hazard is usually hail.
-
Two soundings have 2,500 J/kg of CAPE: one between 2 and 10 km, the other between 1 and 15 km. Which favors the faster-accelerating updraft?
Answer
The first. Its normalized CAPE is 2,500 / 8,000 ≈ 0.31 m/s², against 2,500 / 14,000 ≈ 0.18 for the second: more buoyancy per meter, so faster acceleration, while the second is the skinny, tropical kind of profile.
-
Name three ways the CIN on a morning sounding can be removed by afternoon.
Answer
Heating at the ground, which puts the parcel on a warmer dry adiabat; added moisture, which lowers the LCL and puts it on a warmer saturated adiabat; and lifting, by a front, dryline, outflow boundary or terrain, or slow large-scale ascent that cools the layer and weakens the cap.
Video


Methods
The soundings are the observed radiosonde records from the University of Wyoming's archive;
the most recent is thinned to one level per 50 m of height. Parcels are lifted with the
site's sounding code (scripts/learn/skewt.mjs): saturation vapor pressure from
Bolton (1980), dry-adiabatic ascent to the LCL, then a pseudoadiabat integrated in 1 hPa
steps without ice or water loading. CAPE and CIN are summed as Rd
(Tvp − Tve) d ln p with virtual temperature for
both parcel and environment, unless marked as uncorrected, in which case temperature
replaces virtual temperature with everything else unchanged. The LFC is the first level
above the LCL where the parcel is buoyant, the EL the top of the highest buoyant layer;
CAPE is every positive area between them, CIN every negative area below the LFC. The
mixed-layer parcel averages potential temperature and mixing ratio over the lowest 100 hPa;
the most-unstable parcel is the level of highest equivalent potential temperature in the
lowest 300 hPa. Buoyancy in the figures is g (Tvp −
Tve) / Tve against height interpolated from the
sounding, and the undiluted speed is √(2 × the CAPE accumulated from the LFC). Downdraft CAPE
starts at the level of lowest equivalent potential temperature within 400 hPa of the ground,
at its wet-bulb temperature, and descends along the saturated adiabat; the energy is the
virtual temperature deficit integrated in ln p. The 0 to 3 km value is the positive
area between the LFC and 3 km above the ground. The water loading figure uses the AMS
approximation Tv ≈ T(1 + 0.61rv −
rl).
The climatology uses the Iowa Environmental Mesonet's mixed-layer CAPE for every 00 UTC
sounding at each station from 2015 to 2024, with values of 10,000 J/kg or more discarded as
bad data. The Mesonet computes them with MetPy and warns that they are "subject to
garbage-in, garbage-out issues"; they match this lesson's uncorrected values closely (see the
worked day). The code and data are in the site's repository, under
scripts/learn/.
Related
Lapse rates and stability explains why a lifted parcel ends up warmer or colder than its surroundings, and Inversions and the cap covers the layers that make CIN. How to read a skew-T diagram shows how to find every level used here on a chart, and How tornadoes form puts CAPE together with wind shear before real tornadoes. In Storm Lab a storm can be grown from an observed sounding, and the soundings layer on the radar shows the latest balloon at each station. Terms are in the glossary.
Sources
Quotations are verbatim from the source named. Figures and values marked "computed here" are described under Methods.
- American Meteorological Society, Glossary of Meteorology, entries buoyancy, virtual temperature, convective available potential energy, convective inhibition, entrainment, liquid water loading, downdraft convective available potential energy, convection, orographic lifting and elevated convection.
- University of Wyoming, Department of Atmospheric Science, upper-air soundings and their indices: Sterling, VA (72403) 12 UTC June 29 and 00 UTC June 30, 2012; Davenport, IA (74455) 12 UTC June 29, 2012; Dodge City, KS (72451) 12 UTC May 24, 2016; Miami, FL (72202) 12 UTC July 22, 2023; North Platte, NE (72562) 00 UTC July 3, 1999; Lincoln, IL (74560) 00 UTC July 25, 2016; Aberdeen, SD (72659) 00 UTC July 19, 2011; and the other soundings in the course's archive for the virtual temperature figure.
-
Iowa Environmental Mesonet, Iowa State University,
computed sounding parameters
(
raobs_by_yearservice): Sterling, Norman, Miami, Omaha, Aberdeen and Albany, and launch times. - Storm Prediction Center, mesoanalysis help: surface-based CAPE/CIN, 100-mb mixed layer CAPE/CIN, most unstable CAPE, downdraft CAPE, 3-km CAPE and surface vorticity, violent tornado parameter and lifting condensation level.
- National Weather Service Louisville, Environmental parameters and indices.
- Charles A. Doswell III and Erik N. Rasmussen, The Effect of Neglecting the Virtual Temperature Correction on CAPE Calculations, Weather and Forecasting 9, 625–629, 1994.
- John M. Peters, Daniel R. Chavas, Chun-Yian Su, Hugh Morrison and Brice E. Coffer, An Analytic Formula for Entraining CAPE in Midlatitude Storm Environments, Journal of the Atmospheric Sciences 80, 2023 (preprint).
- David O. Blanchard, Assessing the Vertical Distribution of Convective Available Potential Energy, Weather and Forecasting 13, 870–877, 1998, including its summary of Lucas, Zipser and LeMone (1994).
- Harold E. Brooks, James W. Lee and Jeffrey P. Craven, The spatial distribution of severe thunderstorm and tornado environments from global reanalysis data, Atmospheric Research 67–68, 73–94, 2003.
- Mateusz Taszarek, John T. Allen, Tomáš Púčik, Kimberly A. Hoogewind and Harold E. Brooks, Severe Convective Storms across Europe and the United States. Part II: ERA5 Environments Associated with Lightning, Large Hail, Severe Wind, and Tornadoes, Journal of Climate 33, 10263–10286, 2020.
- Jeffrey P. Craven and Harold E. Brooks, Baseline Climatology of Sounding Derived Parameters Associated with Deep, Moist Convection, National Weather Digest 28, 2004 (Storm Prediction Center copy).
- Charles A. Doswell III, The Distinction between Large-Scale and Mesoscale Contribution to Severe Convection: A Case Study Example, Weather and Forecasting 2, 3–16, 1987.
- NOAA JetStream, Ingredients for a thunderstorm.
- National Weather Service, Service Assessment: The Historic Derecho of June 29, 2012, January 2013: event overview, special weather statement of 9:35 pm EDT and appendix E (peak gusts).
- Storm Prediction Center, The Ohio Valley / Mid-Atlantic Derecho of June 2012.
- Storm Prediction Center, Instability and CAPE, descriptor table.
- NOAA Photo Library, image wea00106, Cumulonimbus, via Wikimedia Commons, public domain.
- The COMET Program/MetEd, Cape And Thunderstorm Severity, YouTube.
- EZWxBrief, Understanding Convective Available Potential Energy (CAPE), YouTube.
- Tom Wachs, Hot, Humid, Unstable… So Why Do Storms Struggle?, YouTube.
- NWS El Paso, Convective Soundings, EPZ Spring Science Sharing, YouTube.

Corrections: contact@weatherovertime.com.
Unit 2: Stability and instability
- Air parcels and adiabatic cooling
Why rising air cools, at the dry rate and then the moist rate.
- Lapse rates and stability
Stable, unstable and conditionally unstable air, read from the temperature profile.
- CAPE, CIN and instability
The energy for an updraft, the energy against one, and the three ways to lift a parcel.
- Inversions and the cap
Radiation, subsidence and frontal inversions, and the elevated mixed layer.