Unit 2 · Stability and instability
Air parcels and adiabatic cooling
- Read first
- Air pressure, Dew point and humidity
Air that rises cools, and air that sinks warms, with no heater or refrigerator involved: the change comes from expansion and compression alone. That one fact explains why cumulus clouds have flat bases, why mountains are wetter on one side than the other, why a chinook can melt a foot of snow in an afternoon, and, in the lessons that follow, why some air keeps rising into a thunderstorm. This lesson follows a single sample of air up and down, from the first law of thermodynamics to the 9.8 °C per kilometer every forecaster knows, the slower rate inside a cloud, and the cloud base you can compute from a surface observation, checked against nearly 14,000 real ones.
- The air parcel and the assumptions of the parcel method.
- Why rising air cools: the first law of thermodynamics in words, and the dry adiabatic lapse rate of 9.8 °C per kilometer derived from it.
- Potential temperature, the number that stays fixed while air rises and sinks.
- The cloud base: the lifted condensation level, the 125 m per °C rule, and how well both match reported cloud bases.
- The moist adiabatic lapse rate: why saturated air cools more slowly, and how the rate depends on temperature and pressure.
- Sinking air: the rain shadow, the chinook that set a national record, and the Santa Ana winds.
What an air parcel is
The atmosphere is continuous, with no edges to follow. To reason about air that moves up or down, meteorologists imagine a piece of it. The American Meteorological Society defines an air parcel as "an imaginary volume of air to which may be assigned any or all of the basic dynamic and thermodynamic properties of atmospheric air." It is large enough to hold a very great number of molecules and small enough that its properties are roughly uniform inside it. The glossary declines to give it a size, then offers one: "a cubic foot of air might fit well into most contexts where air parcels are discussed, particularly those related to static stability."[1]
Following a parcel is the parcel method, in the AMS's words a way of testing for instability "in which a displacement is made from a steady state under the assumption that only the parcel or parcels displaced are affected, the environment remaining unchanged." In its familiar vertical form, "the parcel displaced is assumed to undergo adiabatic temperature changes," and the contrast between its temperature and the unchanged air around it decides whether it keeps going.[1] Spelled out, the method assumes four things:
- No heat crosses the parcel's boundary. Air conducts heat poorly: the FAA's Aviation Weather Handbook notes that air "has low thermal conductivity," so heat transfer by conduction "is negligibly small."[3]
- No air mixes in or out. The parcel keeps its own mass and its own water vapor.
- Its pressure always equals the pressure around it. Pressure adjusts far faster than air rises, so a parcel lifted to 700 hPa is at 700 hPa.
- The surrounding air does not respond. The environment is the same before and after the parcel moves.
None of these is exactly true, and the last section says where they fail. Together they make the problem one that can be solved with a pencil, and they are what every line on a skew-T diagram assumes.
Why rising air cools
Pressure falls with height, by about half in the lowest 5.5 km. A parcel that rises therefore finds less pressure around it and expands until its own pressure matches. The question is what the expansion does to its temperature, and the answer is the first law of thermodynamics.
The AMS states the law this way: "The total internal energy U of an isolated system is constant." A system that is not isolated can change its internal energy in two ways: "working (a force exerted through a distance) and heating (energy exchange by virtue of a temperature difference between the system and its surroundings)."[1] For a gas, internal energy is temperature. In words, then: the change in a parcel's temperature equals the heat it receives minus the work it does on its surroundings.
An adiabatic process is "a process in which there is no exchange of heat or mass with the environment," so that "a change in internal energy is solely a consequence of work." And: "For an ideal gas and most atmospheric conditions, compression results in warming, whereas expansion results in cooling."[1] A rising parcel expands, pushing back the air around it; the energy for that push comes out of its own internal energy, and it cools. The FAA handbook puts it in one line: the expansion "requires energy (or work), which takes heat away from the parcel, so the air cools as it rises."[3]
| Lifted to | Pressure, hPa | Temperature, °C | Volume, times the start |
|---|---|---|---|
| The ground | 1000 | 20.0 | 1.00 |
| 1 km | 888 | 10.2 | 1.09 |
| 3 km | 692 | −9.3 | 1.30 |
| 5.5 km | 493 | −33.6 | 1.66 |
| 10 km | 243 | −77.5 | 2.75 |
The table follows a parcel of dry air lifted from 20 °C at 1000 hPa (computed here; see Methods). By 5.5 km it has fallen to about half the pressure, grown by two thirds, and cooled by more than 50 °C, without losing any heat to anything. Real rising air usually saturates long before that; the rest of this lesson is about what happens then.
The dry adiabatic lapse rate
How fast does the rising parcel cool? Three steps give the answer, and each is a sentence before it is an equation.
- The first law, with no heat. For a parcel of air at constant pressure the heat needed to warm it 1 degree is its specific heat, cp. With no heat added, the law becomes cp dT = (1/ρ) dp: any change in temperature is paid for by the change in pressure, weighted by the air's volume per kilogram, 1/ρ.
- Hydrostatic balance. Pressure falls with height by the weight of the air: dp = −ρ g dz, where g is gravity. The AMS notes that for weather-scale motion the error in this hydrostatic equation is "less than 0.01%."[1]
- Put them together. The density cancels: cp dT = −g dz, so dT/dz = −g/cp. The rate does not depend on the parcel's temperature, its pressure or where it is.
The AMS defines the dry-adiabatic lapse rate as "the rate of decrease of temperature with height of a parcel of dry air lifted by a reversible adiabatic process through an atmosphere in hydrostatic equilibrium," equal to g/cpd, "approximately 9.8°C km⁻¹."[1] With g = 9.807 m/s² and cp = 1,005.7 J/(kg·K), the value the site's code uses, it is 9.75 °C per kilometer; with cp = 1,004 it is 9.77. The FAA gives the aviation form, "approximately 3 °C per 1,000 ft (9.8 °C per km)"; in Fahrenheit it is 5.4 °F per 1,000 feet.[3]
"Dry" here means unsaturated, not free of water vapor. The AMS lists a separate moist-unsaturated rate for air containing vapor, which differs from the dry one by a factor that depends on the mixing ratio.[1] The difference is small: for very humid tropical air holding 20 grams of vapor per kilogram, the rate works out to 9.6 °C per kilometer instead of 9.75 (computed here). Forecasters use 9.8 for all unsaturated air.
The process runs both ways. The FAA handbook: "This process is reversible if the parcel remains unsaturated," and a descending parcel "compresses as it moves into an area of higher pressure. The atmosphere surrounding the parcel does work on the parcel," warming it at the same 9.8 °C per kilometer.[3] Unsaturated air lifted 2 km and brought back down returns to exactly its starting temperature.
Potential temperature
Because the dry rate is fixed, every unsaturated parcel carries a label that does not change as it rises or sinks: the temperature it would have if brought to a standard pressure. That label is the potential temperature, written θ (theta): "the temperature that an unsaturated parcel of dry air would have if brought adiabatically and reversibly from its initial state to a standard pressure, p₀, typically 100 kPa," which is 1000 hPa.[1]
It is computed from the temperature T in kelvins and the pressure p as θ = T (1000/p)κ, the Poisson equation. The exponent κ is the ratio of the gas constant to the specific heat, "often assumed to be 2/7," or 0.286.[1] Two examples show why it is useful.
- The Denver sounding on the evening of June 10, 2013, the dry microburst day in the skew-T lesson, measured 34.6 °C at 834 hPa at the ground. Its potential temperature is 51 °C: that is how hot the same air would be if it were brought down to 1000 hPa, about 1.6 km lower. Measured by potential temperature, the air over a high city on a hot afternoon is far warmer than its thermometer reading.
- A parcel lifted from 20 °C at 1000 hPa in the table above cools to −77.5 °C at 10 km, yet its potential temperature is 20 °C (293 K) the whole way.
On a thermodynamic diagram every dry adiabat is "a line of constant potential temperature," which is why the AMS also calls it an isentrope.[1] A layer whose potential temperature is the same from bottom to top has exactly the dry adiabatic lapse rate; a layer whose potential temperature rises with height is stable to dry air, the first idea of the next lesson. Potential temperature is also a tracer: two samples of unsaturated air with the same θ could be the same air, one lifted or lowered. The chinook section uses exactly that.
Where the cloud begins
As a parcel rises, its dew point falls too, but more slowly. Its water vapor content, the mixing ratio, does not change while it is unsaturated, but the vapor's share of the falling pressure does, and the dew point follows it down. The FAA handbook gives the rate: "the dewpoint decreases approximately 0.5 °C per 1,000 ft (1.8 °C per km)."[3] The temperature falls 9.8 per kilometer and the dew point 1.8, so the gap between them, the dew point depression, closes by about 8 °C per kilometer. Where it reaches zero the parcel is saturated and cloud begins.
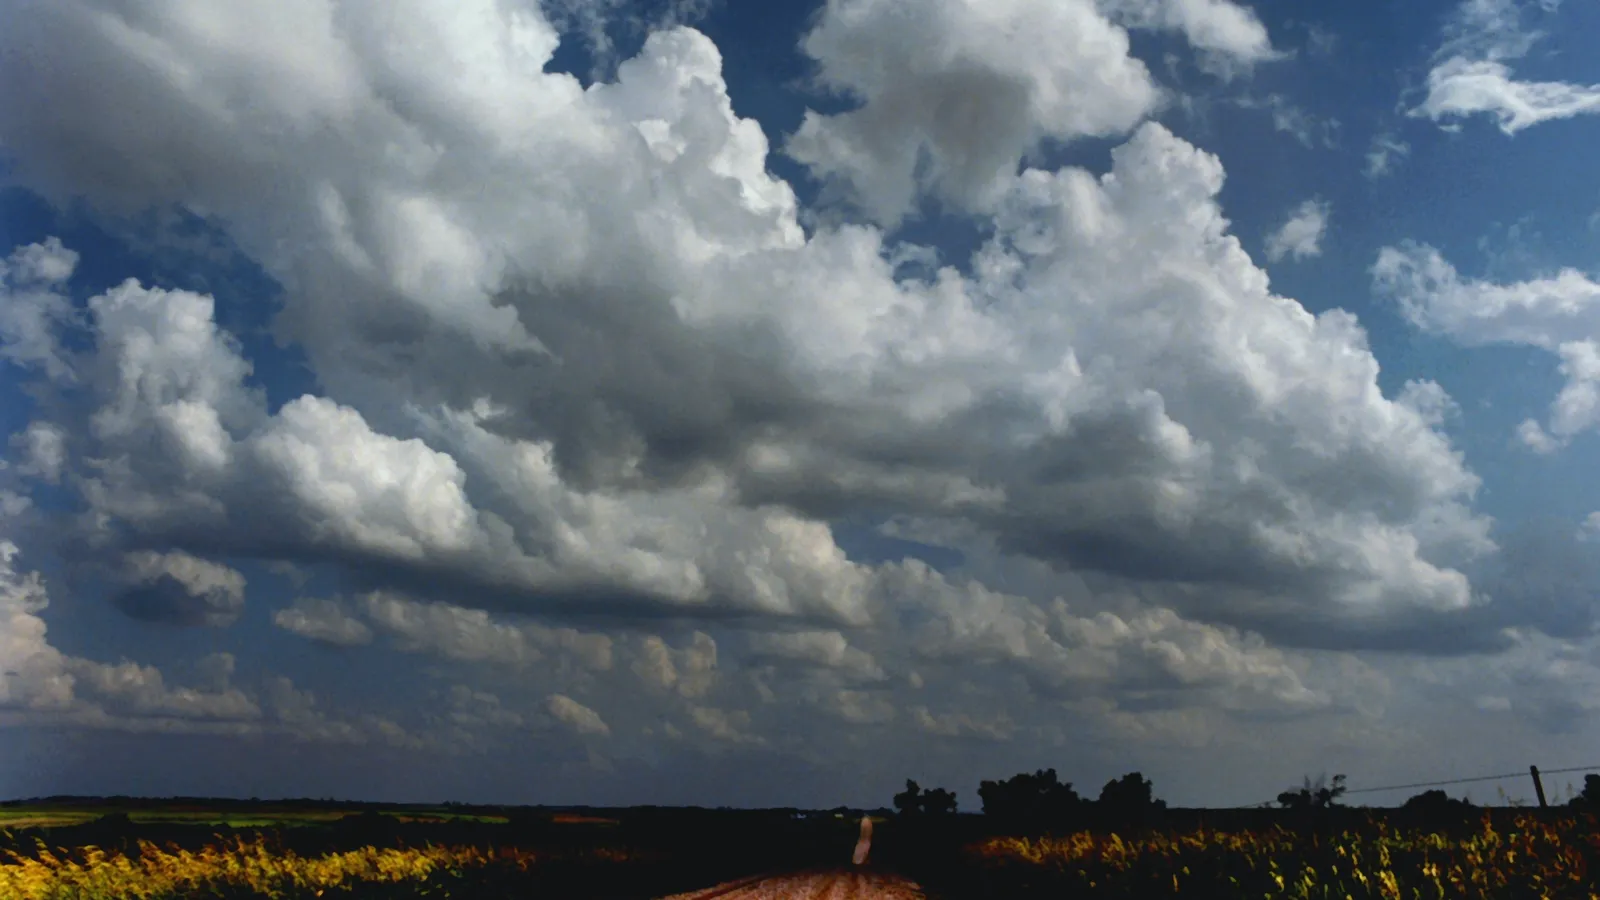
That height is the lifted condensation level, the LCL: "the level at which a parcel of moist air lifted dry-adiabatically would become saturated."[1] Every parcel that rises from the same surface air saturates at the same height, which is why a field of fair-weather cumulus, like the one in the photograph at the top of this page, has bases in a flat line.
- Temperature of the lifted air
- Its dew point
- Above the LCL, saturated
The time of the photograph is not recorded, and Topeka is not Everest, so the match is illustration rather than proof. The next section tests the same calculation on nearly 14,000 observations.
The 125 meter rule, tested
Since the spread closes at about 8 °C per kilometer, each degree of dew point depression at the ground is worth about 1/8 km of height. The University of British Columbia's course notes by Roland Stull give the rule: "A quick way to estimate height (zLCL) of the LCL is: zLCL = a (T – Td) where a = 0.125 km / degC," a height above the ground.[4] A temperature of 30 °C and a dew point of 20 °C gives a cloud base near 1,250 m.
Two questions follow: how close is the rule to the exact LCL, and how close is the LCL to real cloud bases? Automated airport stations report both halves. Their ceilometers measure the height of cloud passing overhead, and every report carries the temperature and dew point. From the Iowa Environmental Mesonet's archive, this lesson took the routine hourly reports from Kansas, Nebraska and Oklahoma between June 1 and August 31, 2024, for 19 to 22 UTC, about 2 to 5 pm in the Central time zone, whose lowest cloud layer was few or scattered and which reported no precipitation or other weather: 13,854 reports from 156 stations of the kind of sky in the photograph.[6]
- Reported base, median
- Middle half of reports
- Computed LCL, median
- 125 m per °C
Table: reported cloud base and computed LCL by dew point depression, meters
| Dew point depression, °C | Reports | Reported base, median | Middle half | Computed LCL, median |
|---|---|---|---|---|
| 0 to 2 | 110 | 701 | 274 to 1,676 | 148 |
| 2 to 4 | 286 | 701 | 457 to 1,524 | 406 |
| 4 to 6 | 682 | 792 | 640 to 1,372 | 641 |
| 6 to 8 | 1,361 | 1,006 | 853 to 1,311 | 899 |
| 8 to 10 | 1,894 | 1,250 | 1,097 to 1,463 | 1,135 |
| 10 to 12 | 2,515 | 1,463 | 1,311 to 1,676 | 1,394 |
| 12 to 14 | 2,271 | 1,676 | 1,524 to 1,829 | 1,644 |
| 14 to 16 | 1,652 | 1,829 | 1,676 to 2,134 | 1,889 |
| 16 to 18 | 1,215 | 2,134 | 1,981 to 2,438 | 2,126 |
| 18 to 20 | 777 | 2,286 | 2,134 to 2,743 | 2,380 |
| 20 to 22 | 508 | 2,591 | 2,438 to 2,896 | 2,627 |
| 22 to 24 | 292 | 2,896 | 2,591 to 3,048 | 2,859 |
| 24 to 26 | 139 | 3,048 | 2,896 to 3,658 | 3,112 |
| 26 to 28 | 81 | 3,353 | 3,048 to 3,658 | 3,345 |
The rule and the exact calculation are nearly indistinguishable: across the reports, the rule's height is a median 99 percent of the exact LCL, and 90 percent of the time between 98 and 100 percent. Against what the ceilometers saw, the computed LCL does well where the spread is 6 °C or more, which is most dry-season and summer afternoons on the Plains. Where the spread is small the medians separate: the computed base is a few hundred meters, but the reported lowest layer sits near 700 m, and the middle half of the reports spans more than a kilometer. The lowest reported layer is whatever cloud was overhead, not necessarily a cumulus from the ground, and on very humid afternoons, when few such reports exist, that matters more. Across all the reports, 79 percent of reported bases were within 500 m of the computed LCL and 68 percent within 300 m.
The rule is for cumulus that form from air heated at the ground. It says nothing about stratus under an inversion, clouds aloft, or cloud formed where one air mass slides over another.
Inside the cloud: the moist rate
Above the LCL the parcel keeps rising and keeps cooling, but now its cooling condenses vapor into cloud droplets, and condensation releases heat. The AMS entry on latent heat: "When the temperature of a system of dry air and water vapor is lowered to the dewpoint and water vapor condenses, the enthalpy released by the vapor heats the air–vapor–liquid system, reducing or eliminating the rate of temperature reduction."[1] The amount is large. Condensing 1 gram of vapor per kilogram of air releases enough heat to warm that air by about 2.5 °C (the latent heat of vaporization, 2.5 million joules per kilogram, divided by the specific heat; computed here).
The rising saturated parcel therefore cools at the moist adiabatic lapse rate, also called the saturated rate: "the rate of decrease of temperature with height along a moist adiabat."[1] Unlike the dry rate it is not a constant. In warm air a kilometer of lift condenses a lot of vapor and releases a lot of heat; in cold air there is little vapor left to condense, and the rate approaches the dry one. The FAA handbook gives the range: from "approximately 1.2 °C per 1,000 ft (4 °C per km) for very warm saturated parcels to 3 °C per 1,000 ft (9.8 °C per km) for very cold saturated parcels."[3]
- Unsaturated: dry adiabat
- Saturated: saturated adiabat
Table: temperature of lifted air at 5 km, °C
| Starting temperature | Dry, at 5 km | Saturated, at 5 km | Difference | Difference at 10 km |
|---|---|---|---|---|
| 30 °C | -18.8 | 11.5 | 30.2 | 55.4 |
| 20 °C | -28.8 | -4.4 | 24.3 | 35.7 |
| 10 °C | -38.8 | -22.6 | 16.1 | 18.9 |
| 0 °C | -48.8 | -40 | 8.8 | 9.3 |
The rate depends on temperature most and on pressure second. At the same temperature, saturated air at lower pressure holds more vapor per kilogram of air, condenses more as it rises and cools a little more slowly. The table gives the rate at four levels, over the temperatures each commonly has.
- 1000 hPa, near sea level
- 850 hPa, about 1.5 km
- 700 hPa, about 3 km
- 500 hPa, about 5.5 km
Table: saturated adiabatic lapse rate, °C per km
| Pressure | -40 °C | -30 °C | -20 °C | -10 °C | 0 °C | 10 °C | 20 °C | 30 °C |
|---|---|---|---|---|---|---|---|---|
| 1000 hPa | 9.5 | 9.2 | 8.6 | 7.7 | 6.5 | 5.2 | 4.2 | 3.5 |
| 850 hPa | 9.5 | 9.1 | 8.4 | 7.4 | 6.1 | 4.9 | 4 | |
| 700 hPa | 9.4 | 9 | 8.2 | 7.1 | 5.8 | 4.6 | ||
| 500 hPa | 9.3 | 8.7 | 7.7 | 6.4 | 5.1 |
| Saturated rate, °C per km | −20 °C | 0 °C | 10 °C | 20 °C | 30 °C |
|---|---|---|---|---|---|
| 1000 hPa, near sea level | 8.6 | 6.5 | 5.2 | 4.2 | 3.5 |
| 850 hPa, about 1.5 km | 8.4 | 6.1 | 4.9 | 4.0 | |
| 700 hPa, about 3 km | 8.2 | 5.8 | 4.6 | ||
| 500 hPa, about 5.5 km | 7.7 | 5.1 |
This is the root of thunderstorm energy. A saturated parcel stays warmer than dry air lifted the same distance, and in the middle troposphere it can end up warmer than the air around it, which the temperature profile on a real day usually cools at somewhere between the two rates. Whether it does is the subject of Lapse rates and stability, and how much warmer, measured as energy, is CAPE.
Where the water goes
The moist rate depends on what happens to the condensed water, and the AMS distinguishes two limits. In a pseudoadiabatic process, "the liquid water that condenses is assumed to be removed as soon as it is formed, by idealized instantaneous precipitation." In a reversible moist-adiabatic process the water is carried along with the parcel, "so that subsequent compression occurs with moist-adiabatic warming, leading to the original state," which "can only happen if the condensed water drops are small enough to have negligible fallout velocities."[1]
For the lapse rate itself the choice hardly matters: the AMS gives the pseudoadiabatic rate as "usually within 1 percent" of the others. It matters a great deal for what happens next. "The pseudoadiabatic process is only defined for expansion, since a parcel that is compressed after such expansion will follow the dry-adiabatic lapse rate."[1] Air that has rained out its water and then sinks warms at 9.8 °C per kilometer all the way down, and arrives warmer than it started. That asymmetry is the rest of this lesson.
The saturated adiabats printed on thermodynamic diagrams, including the skew-T, are drawn for the pseudoadiabatic process.[1] Freezing adds one more complication: when most of the condensed water is ice, the AMS notes that the latent heat of vaporization in the expression may be "replaced by the latent heat of sublimation," which is larger by the heat of freezing.[1] The figures and tables here, like most charts, leave ice out.
Sinking air warms
Everything above runs in reverse for sinking air, with one difference: sinking air is almost never saturated for long. Compression warms it, its dew point rises only 1.8 °C per kilometer, and within a short descent it is unsaturated. The FAA handbook: "A descending saturated air parcel quickly becomes unsaturated," after which its temperature-dew point spread and relative humidity fall steadily.[3]
Air sinking over a broad area is subsidence, and the AMS notes that because downslope flow produces subsidence, downslope winds "experience warming, drying, increasing stability, and clearing if clouds are present."[1] The numbers are large even for a modest descent. Air at 1,500 m with a temperature of 15 °C and a relative humidity of 50 percent, brought down to the ground without gaining or losing any water, arrives at 29.6 °C and 25 percent humidity (computed here). This is why high pressure, where air sinks over wide areas, brings clear skies, and why the subsidence inversion tops so many layers of haze and marine stratus.
Over a mountain
Put the rising and sinking together over a mountain range and the two rates stop canceling. On the windward side the air rises, cools to its LCL, and then rises in cloud at the slower saturated rate, losing water as rain or snow. On the lee side it sinks, dry, at the full 9.8 °C per kilometer.
Table: the parcel at each stage
| Stage | Height, m | Pressure, hPa | Temperature, °C | Dew point, °C | Relative humidity, % | Water vapor, g/kg |
|---|---|---|---|---|---|---|
| Start, windward | 0 | 1000 | 20 | 14 | 68 | 10.1 |
| Cloud base (LCL) | 755 | 915.2 | 12.6 | 12.6 | 100 | 10.1 |
| Crest | 3,000 | 696.9 | 1 | 1 | 100 | 5.9 |
| Lee side | 0 | 1000 | 30.8 | 6.2 | 21 | 5.9 |
The FAA handbook works the same exercise with rounded rates, a parcel of 15 °C and a 10 °C dew point at 2,000 feet lifted over a 12,000-foot summit, and ends "with a temperature of 23 °C, dewpoint of −2 °C, and a relative humidity of 33 percent at 2,000 ft, much warmer and drier than at the beginning."[3] The pattern holds at every scale. The AMS defines a rain shadow as "a region of sharply reduced precipitation on the lee side of an orographic barrier," where "the sinking air warms, dries, and becomes more stable, suppressing precipitation," and gives three examples:
| Barrier | Windward | Lee |
|---|---|---|
| Ghats, western India | More than 600 cm a year | 60 cm or less |
| Island of Hawaii | Up to 450 cm | Less than 100 cm |
| Sierra Nevada | Most of the moisture falls on the western slopes | The Great Basin desert |
Source: the AMS glossary, "rain shadow."[1] The FAA handbook gives the Pacific Northwest as its example: the Cascade Range makes the western slopes "exceptionally cloudy" and rainy, while "semiarid weather characterizes the eastern slopes and areas farther east."[3]
Chinook and foehn
When the air that crosses a range comes down onto cold air on the other side, the lee warming can be sudden. The AMS defines the foehn as "a warm, dry, downslope wind descending the lee side of the Alps as a result of synoptic-scale, cross-barrier flow over the mountain range." Its air "originates at or above the main crest height" and "achieves its warmth and dryness as a result of adiabatic descent," and when it replaces cold air it can produce "dramatic temperature rises that reach 10°C and occasionally even 20°C or more, sometimes in a matter of minutes."[2]
The North American form is the chinook, "especially on the plains to the lee or eastern side of the Rocky Mountains in the United States and Canada." It often "begins to blow at the surface as an arctic front retreats to the east." The glossary's numbers: "Jumps of 10°–20°C can occur in 15 minutes, and at Havre, Montana, a jump from -12° to +5°C in 3 minutes was recorded." Its most important effect "is to melt or sublimate snow: A foot of snow may disappear in a few hours."[2] A chinook is often announced by the chinook arch, a band of wave cloud with a sharp western edge over the mountains that "often presages a chinook."[2]
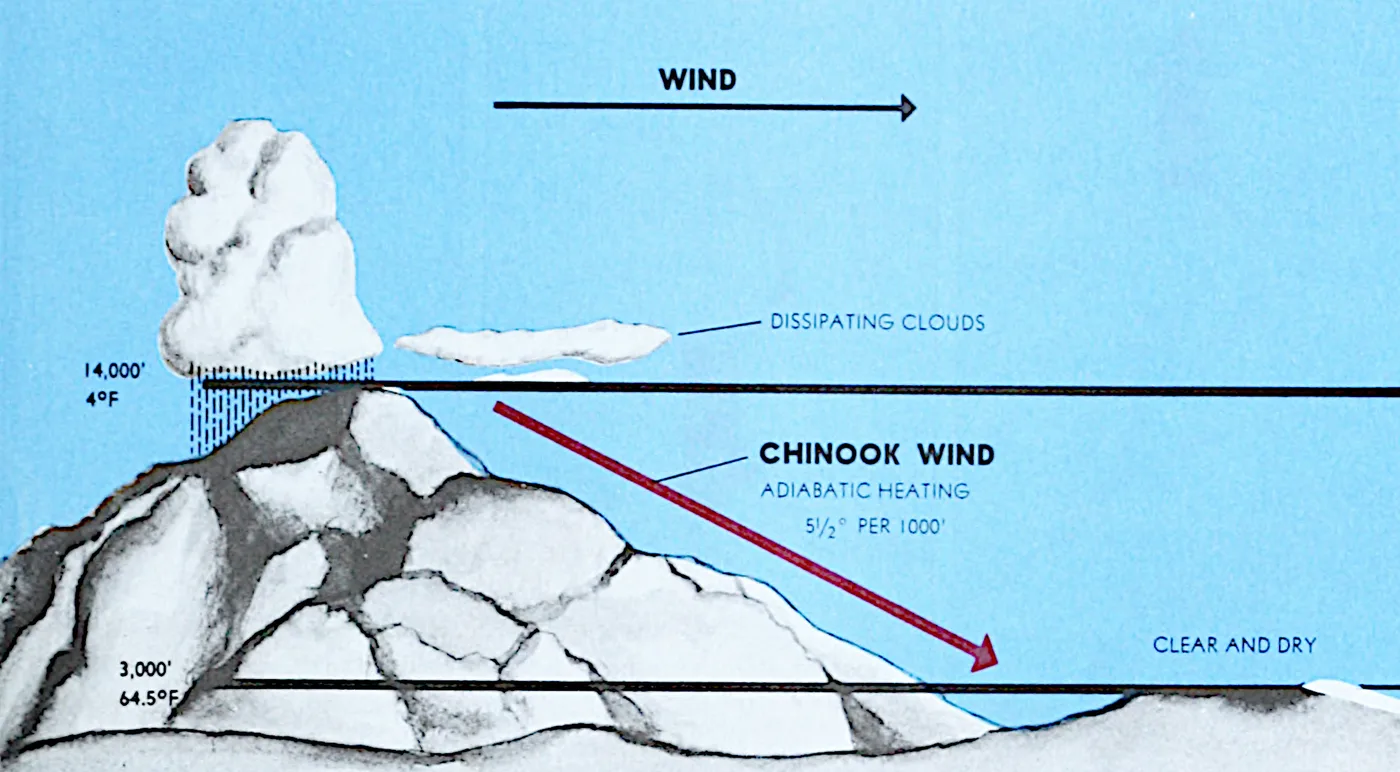
Loma, Montana, January 1972
The largest 24-hour temperature change on record in the United States was a chinook. In the words of the National Climatic Data Center's report: "On January 14th-15th, 1972, a National Weather Service cooperative observer site located in Loma, Montana recorded a 103F temperature change (-54F to 49F) within twenty-four hours, thereby breaking the previous national record of 100F set on January 23-24th, 1916 in Browning, Montana." The record was not recognized until 2002, when the National Climate Extremes Committee evaluated it at the request of the Great Falls office; in 1972 the change had been set aside because it spanned two calendar days.[5]
The airports on either side of Loma kept regular records through the event: Great Falls, about 80 km to the southwest, and Havre, about 90 km to the northeast.
- Great Falls (every 3 hours)
- Havre (hourly)
Table: Great Falls, every report
| Time, MST | Temperature, °F | Temperature, °C | Wind from, ° | Speed, kt |
|---|---|---|---|---|
| 1972-01-13 02:00 | -23 | -30.6 | 300 | 13 |
| 1972-01-13 05:00 | -23 | -30.6 | 300 | 6 |
| 1972-01-13 08:00 | -26 | -32.2 | 300 | 6 |
| 1972-01-13 11:00 | -23 | -30.6 | 210 | 8 |
| 1972-01-13 14:00 | -20 | -28.9 | 220 | 3 |
| 1972-01-13 17:00 | -22 | -30 | 120 | 3 |
| 1972-01-13 20:00 | -22 | -30 | 50 | 2 |
| 1972-01-13 23:00 | -30 | -34.4 | 240 | 9 |
| 1972-01-14 02:00 | -30 | -34.4 | 230 | 8 |
| 1972-01-14 05:00 | -30 | -34.4 | 230 | 3 |
| 1972-01-14 08:00 | -29 | -33.9 | 230 | 5 |
| 1972-01-14 11:00 | -18 | -27.8 | 220 | 7 |
| 1972-01-14 14:00 | 5 | -15 | 220 | 14 |
| 1972-01-14 17:00 | 17 | -8.3 | 220 | 23 |
| 1972-01-14 20:00 | 24 | -4.4 | 220 | 20 |
| 1972-01-14 23:00 | 26 | -3.3 | 220 | 22 |
| 1972-01-15 02:00 | 28 | -2.2 | 230 | 25 |
| 1972-01-15 05:00 | 32 | 0 | 220 | 27 |
| 1972-01-15 08:00 | 33 | 0.6 | 220 | 29 |
| 1972-01-15 11:00 | 39 | 3.9 | 230 | 34 |
| 1972-01-15 14:00 | 39 | 3.9 | 220 | 30 |
| 1972-01-15 17:00 | 43 | 6.1 | 240 | 34 |
| 1972-01-15 20:00 | 41 | 5 | 230 | 28 |
| 1972-01-15 23:00 | 40 | 4.4 | 220 | 28 |
Great Falls, February 2008: the same air, lowered
A chinook can be traced with potential temperature. On February 10, 2008, Great Falls had a shallow layer of arctic air at the ground, and the morning weather balloon measured it: −21.9 °C at the surface, and above a sharp inversion 470 m up, air at 2.0 °C. By mid-afternoon a chinook had replaced the arctic air at the ground.
- Surface temperature (left); 5 pm MST sounding (right)
- 5 am MST sounding
Table: the two Great Falls soundings, lowest 2.6 km
| Pressure, hPa | Height above ground, m | Temperature, °C | Potential temperature, °C |
|---|---|---|---|
| 5 am MST (12 UTC) | |||
| 887 | 0 | -21.9 | -13.2 |
| 881 | 51 | -22.1 | -12.9 |
| 876.6 | 88 | -22 | -12.4 |
| 861 | 222 | -21.5 | -10.5 |
| 850 | 320 | -8.7 | 3.9 |
| 847 | 348 | -6.1 | 6.9 |
| 843 | 385 | -0.9 | 12.7 |
| 842.2 | 393 | -0.4 | 13.3 |
| 840 | 414 | 1 | 15 |
| 834 | 471 | 2 | 16.6 |
| 824 | 569 | 1.4 | 17 |
| 810.9 | 698 | 0.8 | 17.7 |
| 793 | 877 | 0 | 18.7 |
| 780.5 | 1,003 | -0.9 | 19.1 |
| 751.1 | 1,307 | -3.2 | 19.8 |
| 722.7 | 1,612 | -5.5 | 20.5 |
| 711 | 1,741 | -6.5 | 20.8 |
| 700 | 1,863 | -7.1 | 21.4 |
| 642.1 | 2,527 | -10.9 | 24.4 |
| 5 pm MST (00 UTC Feb. 11) | |||
| 880 | 0 | 5.8 | 16.2 |
| 870.5 | 88 | 6.4 | 17.7 |
| 867 | 121 | 6.6 | 18.2 |
| 850 | 281 | 5.2 | 18.4 |
| 806.9 | 698 | 1.6 | 19 |
| 776.8 | 1,003 | -1 | 19.3 |
| 747.9 | 1,307 | -3.6 | 19.7 |
| 736 | 1,435 | -4.7 | 19.8 |
| 719.6 | 1,612 | -5.9 | 20.4 |
| 700 | 1,828 | -7.3 | 21.2 |
| 638.7 | 2,527 | -12.3 | 23.3 |
The evening sounding also shows the chinook's other signature. Its potential temperature rises less than 4 °C in the lowest 1.4 km, close to constant: the air near the ground has been mixed down from above and is lying on its dry adiabat. The warmth at the ground is not heat brought from somewhere warmer. It is air that was already there, 500 m up, compressed on its way down.
Santa Ana winds
Southern California's Santa Ana is a foehn without a rainy windward side. The AMS describes it as "a dry, foehnlike desert wind in southern California, generally blowing from the northeast or east," "driven by strong pressure gradients from an anticyclone over the Great Basin of the western United States." It "blows, often hot and sometimes with great force, from the deserts to the east of the Sierra Nevada Mountains," and "the combination of heat, dryness, and strong winds make it an especially hazardous fire weather condition." It "most frequently occurs in late fall and winter (October–March)."[2]
The air starts dry, over the high desert, and has no rain to lose. Its heating and drying come from the descent alone, from the Great Basin and the passes to the coastal basins near sea level: every kilometer of descent adds about 10 °C and, as the 1,500 m example above shows, can halve the relative humidity. That is why a Santa Ana can bring heat and very low humidity to the coast in autumn and winter, the combination behind its fire danger.
What the parcel leaves out
The parcel method is a model, and its assumptions fail in known ways.
- Mixing. A real rising plume draws in the air around it, which is usually cooler and drier; a real updraft is less buoyant than the parcel that stands for it.
- The environment responds. When a parcel rises, air elsewhere must sink to replace it, warming by compression. The AMS lists the slice method as the alternative that takes this into account.[1]
- Water and ice. Real clouds carry some condensate and drop the rest, somewhere between the reversible and pseudoadiabatic limits, and freeze partway up.
- Pressure is not only hydrostatic. In thunderstorm updrafts and mountain waves, vertical accelerations can reach "1% of gravity or more in extreme situations," as the AMS notes of the hydrostatic equation.[1]
With those caveats it remains the most useful single idea in the study of clouds and storms. The comparison between a lifted parcel and the air around it is how stability is defined, how CAPE and CIN are computed, and what a skew-T is drawn to show.
Check yourself
-
Air at 25 °C is lifted, unsaturated, from the ground to 2 km. What is its temperature?
Answer
About 5.4 °C: it cools 9.8 °C per kilometer, so 19.6 °C in 2 km.
-
Why does rising air cool even though no heat leaves it?
Answer
It expands into lower pressure and does work on the air around it. With no heat added, the energy for that work comes from its internal energy, so its temperature falls.
-
The temperature at the ground is 28 °C and the dew point 16 °C. Where will the bases of afternoon cumulus be?
Answer
About 12 × 125 = 1,500 m above the ground (about 4,900 feet).
-
Saturated air at 25 °C near sea level and saturated air at −30 °C at 500 hPa are both lifted 1 km. Which cools more, and why?
Answer
The cold air, at nearly 9 °C per kilometer against about 4 for the warm air. Warm air holds far more vapor, condenses more as it rises, and gains more latent heat to offset the cooling.
-
Two samples of unsaturated air have the same potential temperature, one at 900 hPa and one at 700 hPa. Which is colder, and could they be the same air?
Answer
The sample at 700 hPa is colder, but they could be the same air: bring either dry-adiabatically to the other's pressure and it has the other's temperature.
-
Air crosses a mountain range and descends to the same height on the other side. Why is it warmer and drier there?
Answer
On the way up it saturated and cooled at the slower moist rate, and the water it condensed fell out as rain or snow. On the way down it warmed at the full dry rate, with less water vapor than it started with. The latent heat released by the rain stays in the air.
-
During a chinook, where does the warm air at the ground come from?
Answer
From aloft, at or above the height of the mountain crests. It warms by compression as it descends, about 10 °C per kilometer, and replaces the cold air that was at the ground.
Video


Methods
Every number marked "computed here" comes from WeatherOverTime's own code, which uses the same thermodynamics as the site's skew-T figures: saturation vapor pressure from Bolton (1980), mixing ratio 0.622 e/(p − e), g = 9.80665 m/s², cp = 1,005.7 J/(kg·K), R = 287.04 J/(kg·K) and a constant latent heat of 2.501 × 10⁶ J/kg. Parcels are followed in height: unsaturated air cools at exactly g/cp, saturated air at the AMS glossary's approximate moist-adiabatic lapse rate with condensate removed and no ice, and pressure is stepped hydrostatically with the parcel's own virtual temperature, as if it rose through air of its own temperature; the heights in the lifted-parcel table and the adiabat figure are for that idealized column. The moist-unsaturated rate uses cpv = 1,875 J/(kg·K). The mountain parcel returns down the lee side dry-adiabatically to its starting pressure.
Surface observations are from the Iowa Environmental Mesonet's archive of airport reports.
Station pressure is computed from the altimeter setting and the station elevation. For the
cloud base test, the LCL of each report is found by lifting the surface air to saturation
and converting the pressure difference to height with the layer's mean temperature; reports
were kept if they were routine hourly reports (made at 50 to 59 minutes past the hour) for
19 to 22 UTC, their lowest layer was few or scattered, and they carried no present
weather. The soundings are the University of
Wyoming's archive of the Great Falls, Montana (72776) radiosonde. The code and data are in
the site's repository, under scripts/learn/.
Related
The next lesson, Lapse rates and stability, compares the two adiabatic rates with the measured temperature profile to decide whether air rises on its own. How to read a skew-T diagram draws every line in this lesson on one chart. How clouds form and Dew point and humidity cover condensation and moisture from the ground up. Current temperatures and dew points for working out a cloud base are on the observations page, and in Storm Lab a parcel can be lifted through an observed sounding. Terms are in the glossary.
Sources
Quotations are verbatim from the source named. Figures marked "computed here" are described under Methods.
- American Meteorological Society, Glossary of Meteorology, entries air parcel, parcel method, first law of thermodynamics, adiabatic process, hydrostatic equation, adiabatic lapse rate (dry, moist-unsaturated and moist-adiabatic), potential temperature, dry adiabat, moist adiabat, lifting condensation level, latent heat, pseudoadiabatic process, pseudoadiabatic lapse rate, reversible moist-adiabatic process, subsidence, downslope wind and rain shadow.
- American Meteorological Society, Glossary of Meteorology, entries foehn, chinook, chinook arch and Santa Ana.
- Federal Aviation Administration, Aviation Weather Handbook, FAA-H-8083-28A, 2024: chapter 12, Vertical Motion and Clouds, sections 12.2 to 12.4.1 and table 12-1.
- Roland Stull, University of British Columbia, ATSC 113, Estimating Cloud Height, course notes.
- Scott Stephens, Michael Helfert, Grant Goodge, Andrew Horvitz, Kelly Redmond and Steve Running, A National Temperature Record at Loma, Montana, NOAA National Climatic Data Center.
- Iowa Environmental Mesonet, Iowa State University, ASOS/AWOS/METAR archive: Great Falls (GTF) and Havre (HVR), Montana, January 13 to 16, 1972; Great Falls, February 9 to 12, 2008; Topeka (TOP), Kansas, June 10, 1986; all stations in the Kansas, Nebraska and Oklahoma networks, June 1 to August 31, 2024.
- University of Wyoming, Department of Atmospheric Science, upper-air soundings: Great Falls, MT (72776), 12 UTC February 10 and 00 UTC February 11, 2008.
- Federal Aviation Administration and National Weather Service, Aviation Weather, AC 00-6A, 1975, chapter 6, figure 41, via Wikimedia Commons, public domain.
- Stephen Corfidi, NOAA/NWS/SPC, NOAA Photo Library image wea03320, Fair weather cumulus bands, Everest, Kansas, June 10, 1986, public domain.
- Djordje Romanic, Dry and Moist Adiabatic Lapse Rates | FWC CV.9, YouTube.
- The O’Fishel Weather Channel (Greg Fishel), Dry and Moist Adiabatic Lapse Rates, YouTube.
- 9NEWS, How 'Chinook wind' warms up weather in a hurry, YouTube.


Corrections: contact@weatherovertime.com.
Unit 2: Stability and instability
- Air parcels and adiabatic cooling
Why rising air cools, at the dry rate and then the moist rate.
- Lapse rates and stability
Stable, unstable and conditionally unstable air, read from the temperature profile.
- CAPE, CIN and instability
The energy for an updraft, the energy against one, and the three ways to lift a parcel.
- Inversions and the cap
Radiation, subsidence and frontal inversions, and the elevated mixed layer.