Air pressure
- Read first
- Layers of the atmosphere
- Key terms
- Atmospheric pressure, Hectopascal, Barometer, Station pressure, Sea-level pressure, Altimeter setting, Standard atmosphere, Hydrostatic balance, Scale height, Hypsometric equation, Thickness, Constant-pressure chart, Geopotential height, Isobar, Pressure tendency, Atmospheric tide, Bomb cyclone
Every weather map is drawn on pressure. The highs and lows on the evening forecast, the 850 and 500 hPa charts forecasters read each morning, the vertical axis of a skew-T and the altimeter in every aircraft all start from one measurement: how hard the air above a place presses down on it. This lesson explains what that pressure is, how it is measured, why it falls with height and why the same barometer yields three different numbers. The examples are real: a winter day at Denver, a month of hourly readings from San Juan and Des Moines, balloon soundings over Minnesota and Florida, and the barograms of a record Minnesota storm and of Hurricane Michael.
- What pressure is: the weight of the air column, and the units it is given in.
- How it is measured, from Torricelli's mercury tube to the sensors at every airport.
- Why it falls with height, how fast, and why it falls faster in cold air than in warm.
- Constant-pressure surfaces and why upper-air charts are drawn on them.
- Station pressure, sea-level pressure and the altimeter setting, and the daily pressure tide.
- Falling pressure before storms, the records, and what a home barometer's dial does and does not say.
What pressure is
The American Meteorological Society defines atmospheric pressure as "the pressure exerted by the atmosphere as a consequence of gravitational attraction exerted upon the column of air lying directly above the point in question."[1] Put simply, it is the weight of the air overhead, spread over the area it rests on. NOAA's JetStream course describes the same thing from the molecules' side: they "are constantly moving in random directions," and "when they strike a surface, they exert a force on that surface in what we observe as pressure."[2] Both descriptions hold at once. The molecules push in every direction, not only down, which is why pressure acts on the side of a building and the underside of a wing as well as on the ground.
The weight is large. Standard sea-level pressure, 101,325 pascals, divided by standard gravity is 10,332 kilograms of air above every square meter of the ground. We do not feel it because the same pressure acts inside the body and on every side of it. Computed here.
Two facts follow from the definition and carry through the rest of the course. Pressure at a place changes only when the mass of air above it changes: air has to pile up or drain away over the whole column. And pressure always falls with height, because climbing leaves part of the column below.
Units
Weather services use several units for the same quantity, and conversions between them come up constantly. Meteorologists use the hectopascal (hPa), 100 pascals, which is the same size as the older millibar: "One millibar equals one hectopascal," in the AMS glossary's words.[1] US airports report the altimeter setting in inches of mercury, the height of the mercury column the air would support; the AMS defines one inch of mercury as "that pressure exerted by a 1-in. column of mercury at standard gravity and a temperature of 0°C."[1]
| Unit | Where it is used | Standard sea-level pressure | Conversion |
|---|---|---|---|
| Hectopascal (hPa) | Weather maps and soundings | 1013.25 | 1 hPa = 100 Pa |
| Millibar (mb) | National Hurricane Center reports | 1013.25 | 1 mb = 1 hPa |
| Kilopascal (kPa) | SI multiple | 101.325 | 1 kPa = 10 hPa |
| Inch of mercury (inHg) | US altimeter settings | 29.92 | 1 inHg = 33.8639 hPa |
| Millimeter of mercury (mmHg) | Mercury barometers, older records | 760 | 1 mmHg = 1.333224 hPa |
| Pound per square inch (psi) | Engineering | 14.70 | 1 psi = 68.9476 hPa |
Conversion factors are the National Weather Service's; the standard values are those of the standard atmosphere, whose sea-level pressure is 1013.25 hPa, or 760 mm of mercury.[3][1] For quick work, 1 inch of mercury is about 34 hPa, and 0.01 inch, the resolution of a US altimeter setting, is about a third of a hectopascal.
Measuring pressure
A barometer is "an instrument for measuring atmospheric pressure."[1] The first was a glass tube. In the Museo Galileo's account: "In a famous experiment of 1644, Evangelista Torricelli (1608-1647) filled a glass tube with mercury, closed it at one end, and turned it upside down in a small basin also filled with mercury. He observed that the mercury column did not descend completely into the basin, but remained at a height of about 76 cm from the open end of the tube. Torricelli correctly identified atmospheric pressure as the cause of the phenomenon."[5] The AMS dates the experiment to 1643 and notes that the mercury barometer, "a glass tube about three feet long, closed at one end, filled with mercury, and inverted with the open end immersed in a cistern of mercury," has not changed in principle since.[1]
The column stands where its weight balances the weight of the atmosphere on the open cistern. Mercury is 13.6 times denser than water, which is why it was chosen: at standard pressure the mercury stands 760 mm tall, while a water barometer would need a tube 10.3 m tall. Computed here.
- Mercury barometer
- A column of mercury balanced against the air, read on a scale beside the tube. The AMS lists three constructions: cistern, siphon and weight barometers.[1]
- Aneroid barometer
- A partly evacuated, corrugated metal capsule held open by a spring. It flexes as pressure changes, and a linkage magnifies the motion onto a dial. It drifts as the metal ages and has to be checked against a standard.[1] The Museo Galileo dates its spread to about 1850.[5]
- Barograph
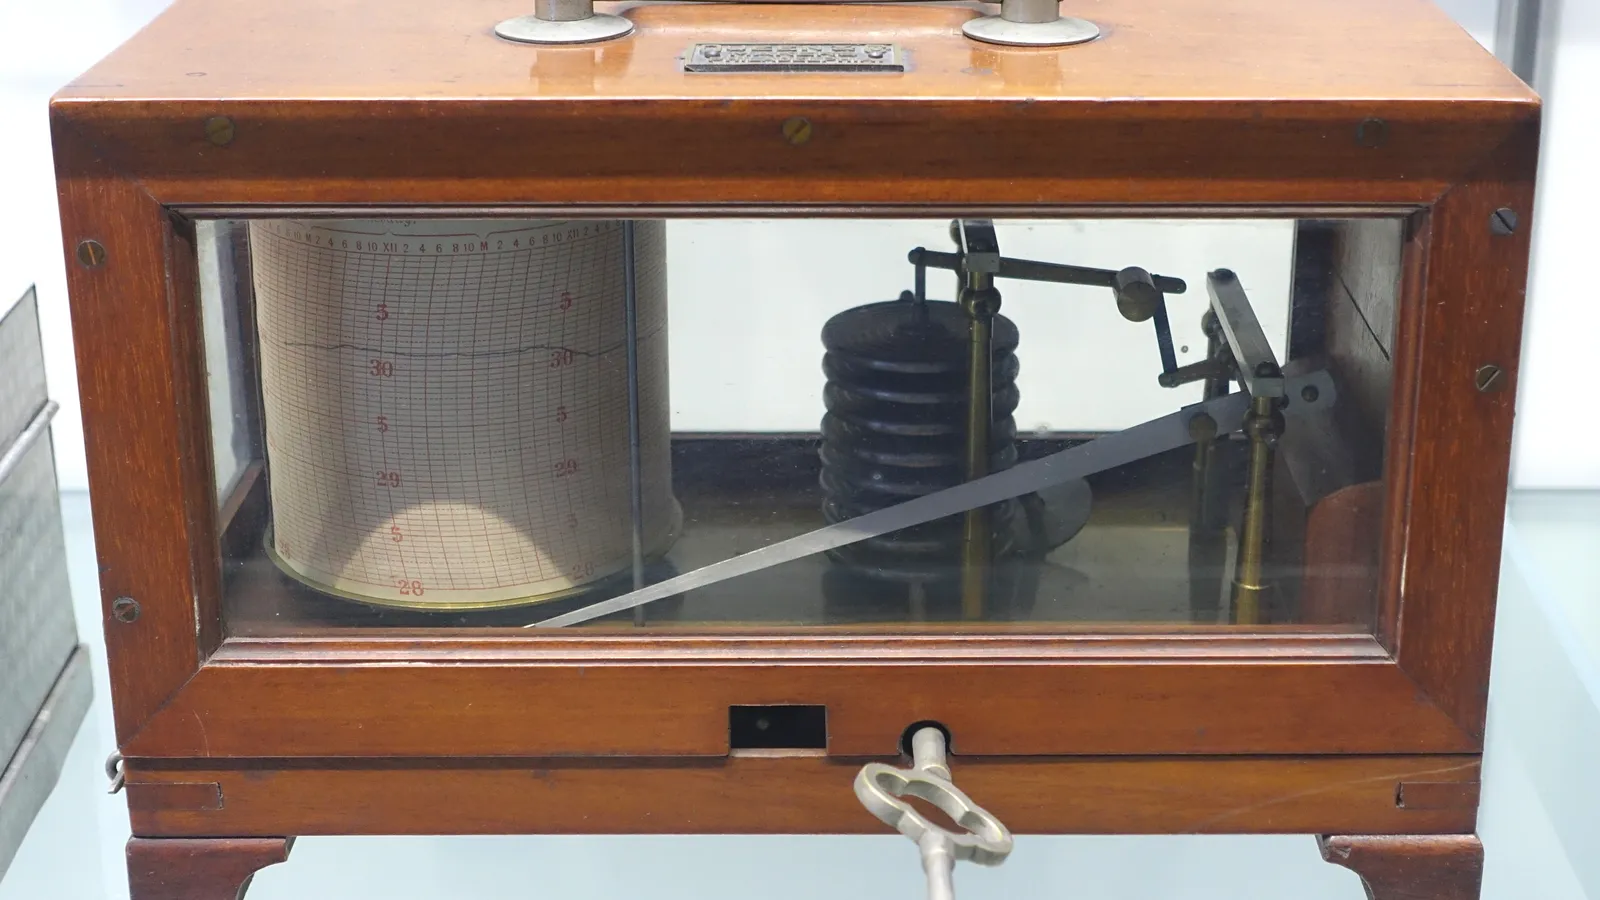
- A recording barometer, like the one at the top of this page: a stack of aneroid capsules moving a pen across a chart on a clock-driven drum.[1] Its trace is a barogram.
- Electronic sensors
- The Automated Surface Observing System (ASOS) at US airports uses "redundant digital pressure transducers, which use capacitive sensors": three at airports with a control tower, two elsewhere, accurate to ±0.02 inches of mercury (about 0.7 hPa), with a reporting resolution of 0.005 inches.[6]
Why pressure falls with height
Consider a thin slab of air. The pressure on its underside is greater than the pressure on its top by exactly the slab's weight; if it were not, the slab would accelerate. This is hydrostatic balance, written as the hydrostatic equation, dp/dz = −ρg: pressure falls with height at a rate equal to the air's density times gravity. The AMS glossary notes that for weather systems of the scale of a cyclone, "the error committed in applying the hydrostatic equation to the atmosphere is less than 0.01%."[1] The balance breaks down only in strong vertical accelerations, such as the updraft of a thunderstorm.
Air is compressible, so the lowest layers, squeezed by everything above, are the densest. Pressure therefore falls fastest near the ground and ever more slowly above. For a layer of uniform temperature the fall is exponential: pressure drops by a factor of e (about 2.72) over one scale height, "the height within which some parameter, such as pressure or density, decreases by a factor 1/e in an isothermal atmosphere."[1] The scale height is the gas constant for air times the temperature, divided by gravity.
| Mean temperature of the layer | Scale height | Pressure halves every |
|---|---|---|
| 15 °C (the standard surface) | 8.4 km | 5.8 km |
| 0 °C | 8.0 km | 5.5 km |
| −18 °C | 7.5 km | 5.2 km |
| −50 °C (upper troposphere) | 6.5 km | 4.5 km |
Computed here with the gas constant for dry air, 287.05 J kg⁻¹ K⁻¹, and standard gravity. The rule of thumb, that pressure halves about every 5.5 km, is the 0 °C row. NOAA puts it in the same terms: "one half of the air molecules in the atmosphere are contained within the first 18,000 feet (5.6 km)."[2]
- Measured, Miami radiosonde
- Exponential, scale height 6.7 km
Table: the Miami sounding, 12 UTC January 30, 2019, at standard levels
| Pressure, hPa | Height, m | Temperature, °C | Share of the air above |
|---|---|---|---|
| 1017 | 5 | 14.0 | 100.0% |
| 1000 | 148 | 18.4 | 98.3% |
| 850 | 1,521 | 9.2 | 83.6% |
| 700 | 3,112 | 2.0 | 68.8% |
| 500 | 5,790 | -8.5 | 49.2% |
| 300 | 9,530 | -36.9 | 29.5% |
| 250 | 10,760 | -47.3 | 24.6% |
| 200 | 12,210 | -55.3 | 19.7% |
| 100 | 16,430 | -71.5 | 9.8% |
| 50 | 20,500 | -66.5 | 4.9% |
| 30 | 23,620 | -61.3 | 2.9% |
| 20 | 26,210 | -49.3 | 2.0% |
| 10 | 30,860 | -40.5 | 1.0% |
The practical consequence is that a few hundred meters matter. The standard atmosphere puts 850 hPa at 1,457 m above sea level; a city at that height sits under 16 percent less air than the coast. Water boils at a lower temperature there, and every barometer reads lower. Computed here.
Warm columns and cold columns
Combining hydrostatic balance with the gas law gives the hypsometric equation, which relates "the thickness, h, between two isobaric surfaces to the mean virtual temperature of the layer."[1] Between any two pressures, a warm layer is deeper than a cold one: warm air is less dense, so it takes a taller column of it to weigh the same. The depth of such a layer is its thickness.
Table: heights of the constant-pressure surfaces, 12 UTC January 30, 2019
| Pressure, hPa | International Falls, m | Miami, m | Difference, m |
|---|---|---|---|
| 850 | 1,350 | 1,521 | 171 |
| 700 | 2,725 | 3,112 | 387 |
| 500 | 5,041 | 5,790 | 749 |
| 300 | 8,375 | 9,530 | 1,155 |
The layer from 850 to 500 hPa had a mean virtual temperature of −35.5 °C over International Falls and 1.8 °C over Miami. The hypsometric equation turns those into thicknesses of 3,690 and 4,270 m; the soundings measured 3,691 and 4,269. Rebuilding every height on the two soundings from their pressures and temperatures alone, layer by layer, reproduces the reported heights at 850, 700, 500 and 300 hPa to within 2 m. Computed here.
The same arithmetic runs in reverse. Forecasters read the thickness between 1000 and 500 hPa as a measure of the mean temperature of the lower atmosphere, and the height of a pressure surface as a map of where the air below it is warm or cold.
Constant-pressure surfaces
Near the ground, weather maps show pressure at a fixed height, sea level. Above the ground, meteorologists turn this around and map the height of a fixed pressure. A constant-pressure chart is "a weather map or chart displaying meteorological data on a constant-pressure surface," showing the "height of the surface, wind, temperature, and humidity."[1] The heights are geopotential heights, which the AMS notes are "numerically interchangeable" with ordinary heights in meters "for most meteorological purposes."[1]
Pressure makes a better vertical coordinate than height for three reasons. Radiosondes measure pressure directly. Equal pressure intervals contain equal masses of air, so a layer from 850 to 700 hPa holds the same air anywhere on Earth. And, as the last section showed, the height of a pressure surface is itself information: it is high over warm air and low over cold air, and the wind aloft blows along its contours. Every sounding launched at 00 and 12 UTC reports its heights at the same mandatory levels, which is what the standard charts are drawn from.
| Chart | Standard atmosphere | International Falls | Miami | What it is used for |
|---|---|---|---|---|
| 850 hPa | 1,457 m | 1,350 m | 1,521 m | Low-level temperature and moisture, fronts, the low-level jet |
| 700 hPa | 3,012 m | 2,725 m | 3,112 m | The cap, mid-level moisture, the steering of storms |
| 500 hPa | 5,574 m | 5,041 m | 5,790 m | Troughs and ridges, the middle of the column |
| 300 hPa | 9,164 m | 8,375 m | 9,530 m | The jet stream |
The standard atmosphere column is computed here from its definition: 15 °C and 1013.25 hPa at sea level, cooling 6.5 °C per kilometer to 11 km.[1] The station columns are 12 UTC January 30, 2019.[8] The same levels are the horizontal lines of a skew-T diagram, whose vertical axis is pressure on a logarithmic scale precisely because pressure falls roughly exponentially with height.
Station pressure and sea-level pressure
A barometer measures the station pressure, "the atmospheric pressure computed for the level of the station elevation," which the AMS calls the base value "from which sea level pressure and altimeter settings are derived."[1] Station pressure is useless on a map: the 1,600 m between Kansas City and Denver change pressure by far more than any storm does. So each reading is converted to what it would be at sea level.
The AMS describes sea-level pressure as the pressure at mean sea level, "most commonly, empirically determined from the observed station pressure." Where the ground is above sea level, "it is standard observational practice to reduce the observed surface pressure to the value that would exist at a point at sea level directly below if air of a temperature corresponding to that actually present at the surface were present all the way down to sea level. In actual practice, the mean temperature for the preceding 12 hours is employed, rather than the current temperature." It adds a warning: this reduction "is responsible for many anomalies in the pressure field in mountainous areas on the surface synoptic chart."[1]
The altimeter setting is a second reduction with a different purpose: the value "used to adjust the subscale of a pressure altimeter so that it indicates the height of an aircraft above a known reference surface."[1] It assumes the standard atmosphere below the station rather than the observed temperature. The National Weather Service's formula for going back from it to station pressure uses only the standard atmosphere's constants: 288 K at sea level and a lapse rate of 0.0065 K per meter.[4]
- Station pressure
- Sea-level pressure
- Altimeter setting
Table: Denver International Airport, hourly, March 12, 2025 (MDT)
| Time | Station pressure, hPa | Sea-level pressure, hPa | Altimeter setting, inHg | Altimeter setting, hPa | Temperature, °F |
|---|---|---|---|---|---|
| 12:53 am | 824.7 | 1002.7 | 29.75 | 1007.5 | 44 |
| 1:53 am | 824.9 | 1003.9 | 29.76 | 1007.8 | 34 |
| 2:53 am | 824.4 | 1002.4 | 29.74 | 1007.1 | 43 |
| 3:53 am | 824.4 | 1001.8 | 29.74 | 1007.1 | 44 |
| 4:53 am | 824.4 | 1002.5 | 29.74 | 1007.1 | 41 |
| 5:53 am | 824.7 | 1003.2 | 29.75 | 1007.5 | 41 |
| 6:53 am | 825.2 | 1004.4 | 29.77 | 1008.1 | 41 |
| 7:53 am | 826.0 | 1005.7 | 29.80 | 1009.1 | 43 |
| 8:53 am | 826.3 | 1005.1 | 29.81 | 1009.5 | 52 |
| 9:53 am | 826.9 | 1006.0 | 29.83 | 1010.2 | 55 |
| 10:53 am | 827.2 | 1005.4 | 29.84 | 1010.5 | 60 |
| 11:53 am | 827.2 | 1005.2 | 29.84 | 1010.5 | 61 |
| 12:53 pm | 826.9 | 1005.6 | 29.83 | 1010.2 | 63 |
| 1:53 pm | 826.3 | 1006.2 | 29.81 | 1009.5 | 62 |
| 2:53 pm | 826.0 | 1004.7 | 29.80 | 1009.1 | 63 |
| 3:53 pm | 826.0 | 1004.2 | 29.80 | 1009.1 | 65 |
| 4:53 pm | 825.8 | 1004.4 | 29.79 | 1008.8 | 64 |
| 5:53 pm | 825.8 | 1004.8 | 29.79 | 1008.8 | 63 |
| 6:53 pm | 825.8 | 1005.2 | 29.79 | 1008.8 | 58 |
| 7:53 pm | 826.0 | 1005.4 | 29.80 | 1009.1 | 56 |
| 8:53 pm | 826.3 | 1006.4 | 29.81 | 1009.5 | 41 |
| 9:53 pm | 826.0 | 1006.0 | 29.80 | 1009.1 | 40 |
| 10:53 pm | 826.3 | 1005.6 | 29.81 | 1009.5 | 40 |
| 11:53 pm | 825.8 | 1004.2 | 29.79 | 1008.8 | 47 |
At 11:53 am the station pressure was 827.2 hPa, 24.43 inches of mercury. The two reductions added 178 and 183 hPa of imagined air to it, and they disagreed with each other by 5.3 hPa: 1,005.2 hPa of sea-level pressure against an altimeter setting of 1,010.5 hPa (29.84 inches). Through the day the gap ranged from 3.1 to 5.3 hPa. On this mild day, 61 °F at noon, the sea-level reduction assumed a warmer and therefore lighter column below the station than the standard atmosphere does, and so added less. Neither number is wrong; each answers a different question. The lesson is to compare like with like: sea-level pressure with sea-level pressure on a surface map, and never the pressure at a mountain station with its value from a different reduction.
The daily pressure tide
Pressure has a daily rhythm of its own, and it is not the one temperature follows. The atmospheric tide, in the AMS definition, is an oscillation of the whole atmosphere driven by the sun and moon, and "the most prominent component is the 12-hour semidiurnal solar atmospheric tide."[1] Pressure rises and falls twice a day, not once.
Table: hourly sea-level pressure, July 1 to 7, 2025, local time, hPa
| Report | San Juan | Des Moines |
|---|---|---|
| July 1, 00:55 | 1018.7 | 1016.2 |
| July 1, 01:55 | 1018.3 | 1016.2 |
| July 1, 02:55 | 1018.0 | 1016.2 |
| July 1, 03:55 | 1017.8 | 1016.4 |
| July 1, 04:55 | 1017.9 | 1016.7 |
| July 1, 05:55 | 1018.2 | 1017.0 |
| July 1, 06:55 | 1018.6 | 1017.4 |
| July 1, 07:55 | 1018.7 | 1018.0 |
| July 1, 08:55 | 1018.9 | 1018.4 |
| July 1, 09:55 | 1019.0 | 1018.3 |
| July 1, 10:55 | 1019.1 | 1018.3 |
| July 1, 11:55 | 1018.8 | 1018.2 |
| July 1, 12:55 | 1018.5 | 1017.7 |
| July 1, 13:55 | 1017.8 | 1017.3 |
| July 1, 14:55 | 1017.5 | 1016.9 |
| July 1, 15:55 | 1017.1 | 1016.6 |
| July 1, 16:55 | 1017.0 | 1016.4 |
| July 1, 17:55 | 1017.0 | 1016.1 |
| July 1, 18:55 | 1017.0 | 1015.8 |
| July 1, 19:55 | 1017.2 | 1015.4 |
| July 1, 20:55 | 1017.6 | 1015.2 |
| July 1, 21:55 | 1017.9 | 1015.6 |
| July 1, 22:55 | 1018.0 | 1015.7 |
| July 1, 23:55 | 1016.1 | |
| July 2, 00:55 | 1017.5 | 1016.2 |
| July 2, 01:55 | 1016.5 | 1015.8 |
| July 2, 02:55 | 1016.5 | 1016.0 |
| July 2, 03:55 | 1016.5 | 1015.7 |
| July 2, 04:55 | 1016.5 | 1015.8 |
| July 2, 05:55 | 1016.8 | 1016.8 |
| July 2, 06:55 | 1017.5 | 1016.7 |
| July 2, 07:55 | 1017.8 | 1016.0 |
| July 2, 08:55 | 1018.4 | 1015.9 |
| July 2, 09:55 | 1018.6 | 1015.9 |
| July 2, 10:55 | 1018.4 | 1016.5 |
| July 2, 11:55 | 1018.2 | 1016.2 |
| July 2, 12:55 | 1017.8 | 1015.8 |
| July 2, 13:55 | 1017.3 | 1015.2 |
| July 2, 14:55 | 1017.0 | 1015.2 |
| July 2, 15:55 | 1016.3 | 1015.0 |
| July 2, 16:55 | 1016.4 | 1014.6 |
| July 2, 17:55 | 1016.6 | 1014.2 |
| July 2, 18:55 | 1017.2 | 1013.8 |
| July 2, 19:55 | 1017.7 | 1013.9 |
| July 2, 20:55 | 1013.9 | |
| July 2, 21:55 | 1018.5 | 1014.2 |
| July 2, 22:55 | 1018.7 | 1014.3 |
| July 2, 23:55 | 1018.4 | 1014.2 |
| July 3, 00:55 | 1017.7 | 1013.9 |
| July 3, 01:55 | 1017.4 | 1013.6 |
| July 3, 02:55 | 1017.5 | 1013.5 |
| July 3, 03:55 | 1017.6 | 1013.4 |
| July 3, 04:55 | 1017.5 | 1013.7 |
| July 3, 05:55 | 1017.6 | 1014.1 |
| July 3, 06:55 | 1018.3 | 1014.3 |
| July 3, 07:55 | 1018.4 | 1014.8 |
| July 3, 08:55 | 1018.4 | 1014.8 |
| July 3, 09:55 | 1018.5 | 1014.6 |
| July 3, 10:55 | 1018.5 | 1014.3 |
| July 3, 11:55 | 1018.0 | 1014.3 |
| July 3, 12:55 | 1017.6 | 1014.0 |
| July 3, 13:55 | 1016.6 | 1013.7 |
| July 3, 14:55 | 1016.1 | 1013.6 |
| July 3, 15:55 | 1016.4 | 1013.4 |
| July 3, 16:55 | 1015.9 | 1013.4 |
| July 3, 17:55 | 1015.9 | 1013.2 |
| July 3, 18:55 | 1016.6 | 1013.2 |
| July 3, 19:55 | 1017.4 | 1013.6 |
| July 3, 20:55 | 1018.2 | 1013.6 |
| July 3, 21:55 | 1018.7 | 1014.2 |
| July 3, 22:55 | 1018.8 | 1014.9 |
| July 3, 23:55 | 1018.8 | 1014.9 |
| July 4, 00:55 | 1018.1 | 1014.4 |
| July 4, 01:55 | 1017.7 | 1014.4 |
| July 4, 02:55 | 1017.4 | 1015.0 |
| July 4, 03:55 | 1017.3 | 1015.2 |
| July 4, 04:55 | 1017.7 | 1015.0 |
| July 4, 05:55 | 1018.1 | 1015.3 |
| July 4, 06:55 | 1018.6 | 1015.6 |
| July 4, 07:55 | 1018.9 | 1015.9 |
| July 4, 08:55 | 1018.9 | 1016.3 |
| July 4, 09:55 | 1019.0 | 1016.1 |
| July 4, 10:55 | 1018.7 | 1016.1 |
| July 4, 11:55 | 1018.6 | 1015.8 |
| July 4, 12:55 | 1018.3 | 1015.5 |
| July 4, 13:55 | 1017.6 | 1015.0 |
| July 4, 14:55 | 1017.1 | 1014.7 |
| July 4, 15:55 | 1016.8 | 1014.2 |
| July 4, 16:55 | 1017.1 | 1013.8 |
| July 4, 17:55 | 1017.4 | 1013.5 |
| July 4, 18:55 | 1017.8 | 1013.2 |
| July 4, 19:55 | 1018.5 | 1013.0 |
| July 4, 20:55 | 1019.1 | 1012.9 |
| July 4, 21:55 | 1019.4 | 1013.6 |
| July 4, 22:55 | 1019.4 | 1013.9 |
| July 4, 23:55 | 1019.2 | 1014.0 |
| July 5, 00:55 | 1018.3 | 1013.8 |
| July 5, 01:55 | 1017.9 | 1013.4 |
| July 5, 02:55 | 1017.9 | 1013.0 |
| July 5, 03:55 | 1017.7 | 1012.7 |
| July 5, 04:55 | 1017.9 | 1012.4 |
| July 5, 05:55 | 1017.9 | 1012.3 |
| July 5, 06:55 | 1018.5 | 1012.3 |
| July 5, 07:55 | 1018.8 | 1012.2 |
| July 5, 08:55 | 1018.9 | 1012.4 |
| July 5, 09:55 | 1018.8 | 1012.5 |
| July 5, 10:55 | 1018.6 | 1013.1 |
| July 5, 11:55 | 1018.4 | 1012.8 |
| July 5, 12:55 | 1018.0 | 1012.5 |
| July 5, 13:55 | 1017.3 | 1012.3 |
| July 5, 14:55 | 1017.0 | 1011.6 |
| July 5, 15:55 | 1016.7 | 1010.9 |
| July 5, 16:55 | 1017.0 | 1010.3 |
| July 5, 17:55 | 1017.5 | 1009.9 |
| July 5, 18:55 | 1017.8 | 1009.6 |
| July 5, 19:55 | 1018.6 | 1010.7 |
| July 5, 20:55 | 1019.2 | 1010.5 |
| July 5, 21:55 | 1019.1 | 1011.8 |
| July 5, 22:55 | 1019.3 | 1011.7 |
| July 5, 23:55 | 1018.8 | 1011.8 |
| July 6, 00:55 | 1018.3 | 1011.9 |
| July 6, 01:55 | 1017.6 | 1012.1 |
| July 6, 02:55 | 1017.4 | 1012.3 |
| July 6, 03:55 | 1017.4 | 1012.4 |
| July 6, 04:55 | 1017.5 | 1012.4 |
| July 6, 05:55 | 1018.2 | 1012.4 |
| July 6, 06:55 | 1018.9 | 1012.9 |
| July 6, 07:55 | 1019.3 | 1013.5 |
| July 6, 08:55 | 1019.4 | 1013.9 |
| July 6, 09:55 | 1019.5 | 1014.1 |
| July 6, 10:55 | 1019.5 | 1014.2 |
| July 6, 11:55 | 1019.3 | 1014.5 |
| July 6, 12:55 | 1019.1 | 1014.7 |
| July 6, 13:55 | 1018.6 | 1014.4 |
| July 6, 14:55 | 1018.0 | 1014.1 |
| July 6, 15:55 | 1017.4 | 1013.8 |
| July 6, 16:55 | 1017.4 | 1013.4 |
| July 6, 17:55 | 1017.7 | 1013.5 |
| July 6, 18:55 | 1018.2 | 1013.3 |
| July 6, 19:55 | 1018.6 | 1013.2 |
| July 6, 20:55 | 1019.1 | 1013.3 |
| July 6, 21:55 | 1019.5 | 1014.2 |
| July 6, 22:55 | 1019.4 | 1014.9 |
| July 6, 23:55 | 1019.1 | 1015.2 |
| July 7, 00:55 | 1018.1 | 1015.4 |
| July 7, 01:55 | 1017.6 | 1015.1 |
| July 7, 02:55 | 1017.4 | 1015.2 |
| July 7, 03:55 | 1017.3 | 1015.2 |
| July 7, 04:55 | 1017.3 | 1015.2 |
| July 7, 05:55 | 1017.9 | 1015.6 |
| July 7, 06:55 | 1018.3 | 1016.1 |
| July 7, 07:55 | 1018.8 | 1016.6 |
| July 7, 08:55 | 1018.9 | 1017.3 |
| July 7, 09:55 | 1019.1 | 1017.1 |
| July 7, 10:55 | 1018.8 | 1017.4 |
| July 7, 11:55 | 1018.4 | 1017.3 |
| July 7, 12:55 | 1018.2 | 1017.0 |
| July 7, 13:55 | 1017.2 | 1016.6 |
| July 7, 14:55 | 1017.0 | 1016.3 |
| July 7, 15:55 | 1016.8 | 1015.9 |
| July 7, 16:55 | 1016.7 | 1015.7 |
| July 7, 17:55 | 1015.1 | |
| July 7, 18:55 | 1017.5 | 1014.8 |
| July 7, 19:55 | 1018.1 | 1015.2 |
| July 7, 20:55 | 1018.8 | 1015.8 |
| July 7, 21:55 | 1019.4 | 1016.2 |
| July 7, 22:55 | 1019.8 | 1016.8 |
| July 7, 23:55 | 1019.6 | 1016.6 |
- San Juan, 20 days
- Des Moines, 28 days
Table: average departure from the daily mean, July 2025, hPa
| Report, local time | San Juan | Des Moines |
|---|---|---|
| 12:55 am | 0.08 | 0.12 |
| 1:55 am | -0.43 | -0.03 |
| 2:55 am | -0.66 | -0.16 |
| 3:55 am | -0.70 | -0.05 |
| 4:55 am | -0.60 | 0.01 |
| 5:55 am | -0.30 | 0.15 |
| 6:55 am | 0.27 | 0.30 |
| 7:55 am | 0.55 | 0.49 |
| 8:55 am | 0.73 | 0.73 |
| 9:55 am | 0.81 | 0.71 |
| 10:55 am | 0.77 | 0.85 |
| 11:55 am | 0.56 | 0.86 |
| 12:55 pm | 0.27 | 0.61 |
| 1:55 pm | -0.29 | 0.25 |
| 2:55 pm | -0.73 | -0.01 |
| 3:55 pm | -1.02 | -0.30 |
| 4:55 pm | -1.12 | -0.64 |
| 5:55 pm | -0.94 | -0.91 |
| 6:55 pm | -0.53 | -1.00 |
| 7:55 pm | 0.05 | -0.98 |
| 8:55 pm | 0.52 | -0.81 |
| 9:55 pm | 0.90 | -0.29 |
| 10:55 pm | 1.05 | -0.01 |
| 11:55 pm | 0.75 | 0.14 |
The cause lies far above the ground. Covey and colleagues, writing in the Journal of the Atmospheric Sciences, summarize it: "In the tropics, and in mid-latitudes after baroclinic waves are removed from consideration, the primary observed day-to-night variation of surface pressure is a semidiurnal (twice-a-day) cycle despite the obvious diurnal (once-a-day) cycle of surface temperature." Solar heating is the main driver; the gravitational tides of the moon "are about 20 times weaker." The semidiurnal tide "is primarily excited in a broad range of altitudes around 50 km by ozone heating and effectively propagates to the surface."[9]
The tide matters in practice in two ways. In the tropics, a pressure fall of 2 hPa in the afternoon is normal, and a forecaster watching for a tropical cyclone has to remove the tide before reading the tendency. Everywhere, the three-hour pressure tendency in an observation, "the character and amount of atmospheric pressure change during a specified period of time,"[1] includes the tide as well as the weather.
Highs, lows and the pressure gradient
On a surface map, lines of equal sea-level pressure, isobars, outline the highs and lows. The AMS treats "low" and "cyclone" as interchangeable, because cyclonic circulation and low pressure "typically coexist," and likewise high pressure and anticyclone. In the Northern Hemisphere air circulates counterclockwise around a low and clockwise around a high.[1]
Pressure differences push the air. The pressure gradient force is "the force due to differences of pressure within a fluid mass," and its vertical component is "approximately 10,000 times greater than the horizontal component."[1] The vertical push is almost exactly balanced by gravity, which is hydrostatic balance. The tiny horizontal remainder, a few hectopascals across hundreds of kilometers, is what drives the wind: the closer the isobars, the stronger it blows. How the Earth's rotation and friction then turn that push into the winds we observe is the subject of a later lesson, What makes the wind blow.
Falling pressure before a storm
A low deepens when air is removed from the column above it faster than it flows in near the ground, and a barometer under its path records the result. Meteorologists call the fastest of these storms bombs. The AMS defines a bomb as "a rapidly deepening extratropical surface cyclone with a central pressure that falls on the average of at least 1 hPa h⁻¹ for 24 h, after applying an adjustment to a latitude of 60°."[1]
Table: International Falls sea-level pressure, every 6 hours (CDT), hPa
| Time | Pressure |
|---|---|
| Oct. 24, 12:55 am | 1013.9 |
| Oct. 24, 6:55 am | 1011.8 |
| Oct. 24, 12:55 pm | 1008.1 |
| Oct. 24, 6:55 pm | 1004.3 |
| Oct. 25, 12:55 am | 999.4 |
| Oct. 25, 7:55 am | 995.1 |
| Oct. 25, 1:55 pm | 991.2 |
| Oct. 25, 7:55 pm | 988.6 |
| Oct. 26, 2:55 am | 981.3 |
| Oct. 26, 8:55 am | 970.5 |
| Oct. 26, 2:55 pm | 957.5 |
| Oct. 26, 8:55 pm | 958.7 |
| Oct. 27, 2:55 am | 964.9 |
| Oct. 27, 8:55 am | 972.1 |
| Oct. 27, 2:55 pm | 983.9 |
| Oct. 27, 8:55 pm | 998.9 |
| Oct. 28, 2:55 am | 1009.6 |
| Oct. 28, 8:55 am | 1017.8 |
| Oct. 28, 2:55 pm | 1022.6 |
Table: Tyndall AFB sea-level pressure (CDT), hPa, hourly then every report in the last hour
| Time | Pressure |
|---|---|
| Oct. 9, 12:56 am | 1013.8 |
| Oct. 9, 1:56 am | 1013.5 |
| Oct. 9, 2:56 am | 1013.1 |
| Oct. 9, 3:56 am | 1013.1 |
| Oct. 9, 4:56 am | 1013.1 |
| Oct. 9, 5:56 am | 1013.1 |
| Oct. 9, 6:56 am | 1013.1 |
| Oct. 9, 7:56 am | 1013.1 |
| Oct. 9, 8:46 am | 1013.1 |
| Oct. 9, 9:45 am | 1012.8 |
| Oct. 9, 10:56 am | 1012.5 |
| Oct. 9, 11:46 am | 1012.5 |
| Oct. 9, 12:36 pm | 1011.8 |
| Oct. 9, 1:56 pm | 1010.1 |
| Oct. 9, 2:56 pm | 1009.4 |
| Oct. 9, 3:56 pm | 1009.1 |
| Oct. 9, 4:56 pm | 1008.7 |
| Oct. 9, 5:56 pm | 1008.1 |
| Oct. 9, 6:56 pm | 1008.1 |
| Oct. 9, 7:56 pm | 1007.7 |
| Oct. 9, 8:56 pm | 1007.7 |
| Oct. 9, 9:56 pm | 1008.1 |
| Oct. 9, 10:56 pm | 1007.7 |
| Oct. 9, 11:56 pm | 1007.0 |
| Oct. 10, 12:56 am | 1006.0 |
| Oct. 10, 1:53 am | 1005.7 |
| Oct. 10, 2:45 am | 1005.0 |
| Oct. 10, 3:56 am | 1003.0 |
| Oct. 10, 4:56 am | 1002.0 |
| Oct. 10, 5:46 am | 1001.3 |
| Oct. 10, 6:46 am | 999.9 |
| Oct. 10, 7:41 am | 997.9 |
| Oct. 10, 8:31 am | 995.5 |
| Oct. 10, 9:26 am | 992.8 |
| Oct. 10, 10:16 am | 987.4 |
| Oct. 10, 11:08 am | 977.6 |
| Oct. 10, 11:20 am | 974.2 |
| Oct. 10, 11:21 am | 973.5 |
| Oct. 10, 11:23 am | 972.5 |
| Oct. 10, 11:25 am | 971.8 |
| Oct. 10, 11:27 am | 970.5 |
| Oct. 10, 11:30 am | 969.8 |
| Oct. 10, 11:35 am | 967.4 |
| Oct. 10, 11:36 am | 966.7 |
| Oct. 10, 11:38 am | 964.7 |
| Oct. 10, 11:40 am | 963.4 |
| Oct. 10, 11:42 am | 963.0 |
| Oct. 10, 11:43 am | 962.0 |
| Oct. 10, 11:44 am | 960.3 |
| Oct. 10, 11:45 am | 959.6 |
| Oct. 10, 11:47 am | 957.9 |
| Oct. 10, 12:08 pm | 931.5 |
| Oct. 10, 12:12 pm | 928.5 |
| Oct. 10, 12:16 pm | 924.8 |
| Oct. 10, 12:17 pm | 924.1 |
| Oct. 10, 12:19 pm | 924.4 |
| Oct. 10, 12:20 pm | 922.4 |
The Minnesota storm set a state record. The National Weather Service office in Milwaukee reported that "Bigfork had a minimum sea level pressure of 955.2 millibars (28.21") at 5:13 PM CDT," the second lowest sea-level pressure for a non-tropical low in the continental United States.[10] A station's fall is not the storm's central fall, since the low moves, but at International Falls the 33.8 hPa fall in a day exceeded the 24 hPa that the bomb criterion asks of a center at 60° N, and the criterion asks less farther south. Computed here.
The hurricane's fall is steeper because the pressure gradient around a hurricane's eye is packed into tens of kilometers. The National Hurricane Center's report on Michael assesses its landfall pressure at 919 mb, based partly on "a pressure of 922.4 mb and simultaneous hurricane-force winds at the Tyndall AFB station at 1720 UTC 10 October," and notes that the station "reported a peak gust of 121 kt and was inside the RMW when it last reported."[11] The last report in the archive came four minutes after the lowest. Michael's 919 mb is, in the same report, "the third lowest on record for a landfalling U.S. hurricane since reliable records began in 1900."[11]
Records
| Record | Pressure | Where and when | Source |
|---|---|---|---|
| Highest sea-level pressure, station below 750 m | 1,083.8 hPa | Agata, Russia, Dec. 31, 1968 | WMO[13] |
| Highest sea-level pressure, station above 750 m | 1,089.1 hPa | Tosontsengel, Mongolia, Dec. 30, 2004 | WMO[13] |
| Lowest sea-level pressure (excluding tornadoes) | 870 hPa | Eye of Typhoon Tip, western Pacific, Oct. 12, 1979 | WMO[13] |
| Lowest in the Atlantic basin | 882 mb | Hurricane Wilma, Oct. 19, 2005 | NHC[12] |
| Lowest at a US hurricane landfall | 892 mb | Labor Day hurricane, Florida Keys, 1935 | NHC[11] |
| Minnesota record, a non-tropical low | 955.2 mb | Bigfork, Minnesota, Oct. 26, 2010 | NWS[10] |
The highest pressures come from the coldest, densest air: both world records were set in Siberian and Mongolian winter anticyclones. The WMO keeps a separate record for stations above 750 m, where the reduction to sea level adds the most imagined air. Wilma's 882 mb was an estimate: the lowest a dropsonde measured was 884 mb at 0801 UTC October 19, but its surface wind of 23 knots showed it had missed the center, and the National Hurricane Center judged the pressure "probably a couple of mb lower."[12] Between the extremes lies a range of about 220 hPa, a fifth of the whole atmosphere. The pressure at the Denver sensor, 827 hPa on an ordinary day, is lower than anything any hurricane has produced at sea level.
What a home barometer says
Household barometers carry weather words beside the scale, from "Stormy" at the low end to "Very dry" at the high end, as on the London-made dial below, where they run from 28 to 31 inches of mercury.[15] In hectopascals, 28 to 31 inches is 948 to 1,050. Computed here.
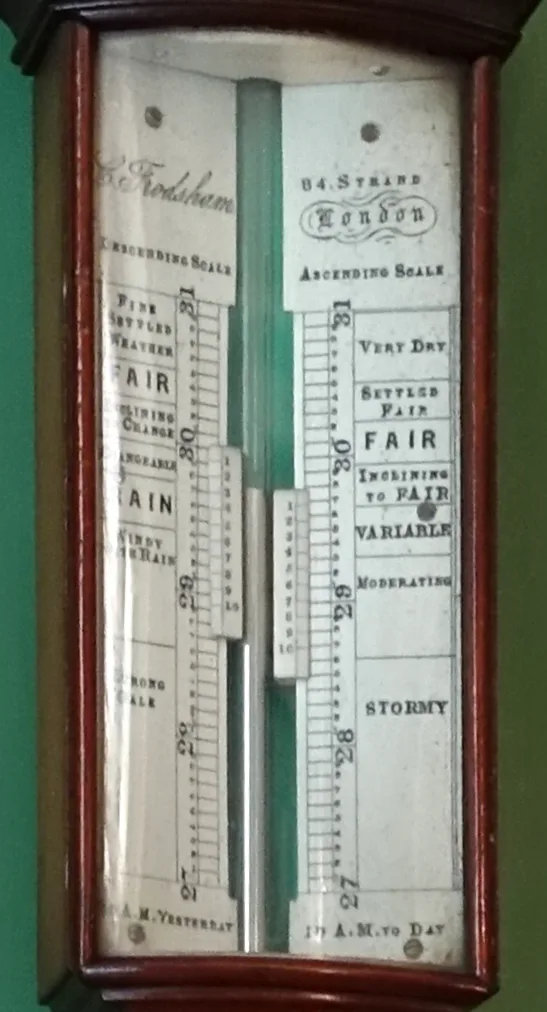
What the words can and cannot tell you follows from the rest of this lesson.
- The words assume sea level. An unadjusted barometer in Denver would sit near 24.4 inches of mercury, below "Stormy," every day of the year. Home aneroids are meant to be set to the local sea-level pressure or altimeter setting, which is why they have an adjusting screw.
- A word is not a forecast. The sea-level pressure at San Juan stayed between 1,014.5 and 1,020.3 hPa through July 2025, so the dial would have pointed near "Fair" every day of the month, whatever the sky did. A single reading does not say what the weather will do.
- The change is the signal. A steady fall of several hectopascals over a few hours means a low or a front approaching, whatever the pointer's word; a rise after a front means clearing. The barograms above say more than any single reading on them. That is what the second pointer on the Frodsham dial is for, and what the three-hour tendency in every weather observation records.
- The daily tide is not weather. At San Juan in July 2025, pressure fell by an average of 1.9 hPa between 10 am and 5 pm, fair day or not.
Check yourself
-
Why does pressure fall with height, and why does it fall fastest near the ground?
Answer
Pressure is the weight of the air above, so climbing leaves part of the column below. Air is compressible, so the lowest layers are the densest, and the hydrostatic equation makes the rate of fall proportional to density.
-
Roughly what fraction of the atmosphere's mass lies above the 500 hPa surface when the surface pressure is 1,000 hPa?
Answer
Half. Pressure measures the weight of the air above, so 500 hPa of 1,000 is half the column.
-
The 500 hPa surface is at 5,040 m over one city and 5,790 m over another at the same time. Which city has the colder air beneath?
Answer
The first. By the hypsometric equation a cold layer is thinner, so pressure surfaces sit lower over cold air. These are the International Falls and Miami soundings of January 30, 2019.
-
A barometer at an airport 1,600 m above sea level reads 830 hPa. Is a storm coming?
Answer
Not necessarily. That is station pressure, and at that elevation it is ordinary. It has to be reduced to sea level, near 1,000 to 1,015 hPa on a normal day, before it can be compared with other stations, and its trend matters more than its value.
-
Why can the sea-level pressure and the altimeter setting at a mountain station disagree by several hectopascals?
Answer
Both add an imagined column of air below the station, but sea-level pressure uses the observed temperature, averaged over 12 hours, and the altimeter setting uses the standard atmosphere. Different assumed temperatures mean different assumed weights.
-
On a calm, clear day in the tropics, pressure falls 2 hPa between 10 am and 5 pm. What does it mean?
Answer
Probably nothing about the weather. That is the semidiurnal pressure tide, driven mainly by solar heating of the ozone layer. At San Juan in July 2025 it peaked near 10 am and 11 pm and bottomed near 4 am and 5 pm.
-
A station's pressure falls 34 hPa in 24 hours. Is the storm a bomb?
Answer
Possibly, but a station's fall is not the definition. A bomb is defined by the fall of the storm's central pressure, an average of at least 1 hPa an hour for 24 hours after adjustment to 60° N. The station's reading also changes as the low moves toward or away from it.
Video



Methods
Surface data are ASOS routine and special reports from the Iowa Environmental Mesonet
archive: Denver (DEN), San Juan (TJSJ), Des Moines (DSM), International Falls (INL) and
Tyndall Air Force Base (PAM). Sea-level pressure and the altimeter setting are as reported;
station pressure at Denver is computed from the altimeter setting and the 1,656 m station
elevation with the National Weather Service formula
Pstn = Palt × ((288 − 0.0065 h) / 288)5.2561.
For the average day, each complete local day (all 24 routine reports) contributes each
report's departure from that day's mean, averaged by hour; routine reports are taken at
about 55 minutes past the hour and plotted there. At Tyndall one report whose sea-level
pressure differed from its own altimeter setting by more than 3 hPa (1,032.9 against
932.8) is excluded. The soundings are the University of Wyoming's; heights are rebuilt
from pressure and virtual temperature with the hypsometric equation, layer by layer, as a
check. Scale heights use R = 287.05 J kg⁻¹ K⁻¹ and g = 9.80665 m s⁻², and
the standard atmosphere is the ICAO profile to 20 km. The code and data are in the site's
repository, in scripts/learn/air-pressure.mjs and
scripts/learn/air-pressure-data/.
Related
The layers the pressure falls through are the subject of Layers of the atmosphere. Pressure is the vertical axis of the skew-T diagram. Hourly observations, pressure included, for thousands of US stations are in Observations, and every tropical cyclone's lowest pressure is in Hurricanes. Unfamiliar terms are in the glossary.
Sources
Quotations are verbatim from the source named. Figures and numbers marked "computed here" are described under Methods.
- American Meteorological Society, Glossary of Meteorology, entries atmospheric pressure, millibar, inch of mercury, barometer, mercury barometer, aneroid barometer, barograph, hydrostatic equation, scale height, hypsometric equation, standard atmosphere, constant-pressure chart, geopotential height, station pressure, sea level pressure, altimeter setting, atmospheric tide, pressure tendency, cyclone, anticyclone, pressure-gradient force and bomb.
- NOAA JetStream, Air Pressure.
- National Weather Service El Paso, Pressure Conversion, weather calculator documentation.
- National Weather Service El Paso, Station Pressure, weather calculator documentation.
- Museo Galileo, Florence, Barometer, catalogue essay.
- National Weather Service, ASOS barometric pressure sensor.
- Iowa Environmental Mesonet, Iowa State University, ASOS-AWOS-METAR data download: DEN March 12, 2025; TJSJ and DSM July 2025; INL October 24 to 28, 2010; PAM October 8 to 10, 2018.
- University of Wyoming, Department of Atmospheric Science, upper-air soundings: Miami, FL (72202) and International Falls, MN (72747), 12 UTC January 30, 2019.
- Curt Covey, Aiguo Dai, Dan Marsh and Richard S. Lindzen, The Surface-Pressure Signature of Atmospheric Tides in Modern Climate Models, Journal of the Atmospheric Sciences 68, 2011; accepted manuscript, LLNL-JRNL-430513, introduction. Its observations are those of A. Dai and J. Wang, "Diurnal and Semidiurnal Tides in Global Surface Pressure Fields," Journal of the Atmospheric Sciences 56, 1999.
- National Weather Service Milwaukee/Sullivan, Historic low pressure, October 26, 2010.
- John L. Beven II, Robbie Berg and Andrew Hagen, National Hurricane Center, Tropical Cyclone Report: Hurricane Michael, AL142018, 2019.
- Richard J. Pasch, Eric S. Blake, Hugh D. Cobb III and David P. Roberts, National Hurricane Center, Tropical Cyclone Report: Hurricane Wilma, AL252005, 2006.
- World Meteorological Organization, World Weather and Climate Extremes Archive, Records of weather and climate extremes, as of January 30, 2024.
- Daderot, Barograph, Museum of Science and Industry (Chicago), Wikimedia Commons, CC0.
- Daderot, Barometer by Charles Frodsham, Shugborough Hall, Wikimedia Commons, CC0.
- Drive Creative Studio for the Met Office, Met Office: Air Pressure, YouTube.
- Met Office, Pressure contrasts that drive our weather, YouTube.
- NWS El Paso, Weather Basics: High and Low Pressure, YouTube.
_-_DSC06383.JPG)

Corrections: contact@weatherovertime.com.
Unit 1: The atmosphere
- Layers of the atmosphere
Troposphere to thermosphere, and why weather happens in the lowest layer.
- Air pressure
What pressure is, how it is measured, and why it falls with height.
- Temperature and heat
How the sun heats the ground, the ground heats the air, and the day warms and cools.
- Dew point and humidity
Why dew point, not relative humidity, is the number forecasters watch.
- How clouds form and how to name them
Condensation, cloud bases, and the ten cloud genera.