Temperature and heat
- Read first
- Layers of the atmosphere
- Key terms
- Temperature, Heat, Kelvin, Sensible heat, Latent heat, ASOS, Instrument shelter, Insolation, Shortwave radiation, Longwave radiation, Albedo, Greenhouse effect, Thermal radiation, Conduction, Convection, Diurnal cycle, Radiational cooling, Radiation inversion, Drainage wind, Frost hollow, Thermal belt, Frost, Seasonal lag, Sea breeze, Urban heat island, Wind chill, Heat index
Almost all of the atmosphere's warmth arrives as sunlight, but very little of that sunlight heats the air directly. It passes through, warms the ground and the ocean, and the ground then warms the air above it. That order explains most of what a thermometer shows: why the hottest hour comes in mid-afternoon and the coldest near sunrise, why a desert swings 25 degrees in a day while a humid coast barely moves, why valleys frost first, why July is hotter than June, and why San Francisco is cool in July while Sacramento, 116 km away, is hot. This lesson covers each of these from real observations.
- Temperature and heat: what each word means, and the three scales.
- How temperature is measured officially, and why a sign in the sun is not a reading.
- The energy budget: where sunlight goes, and how the ground passes its heat to the air.
- The daily cycle in a desert and on a humid coast, and why nights cool fast or slowly.
- The seasons, the coast and the city: the seasonal lag, land against water, the urban heat island.
- Extremes and "feels like": the world records, wind chill and the heat index.
Temperature and heat
In everyday speech the two words are interchangeable. In meteorology they are not. Temperature is, in the American Meteorological Society's definition, "the quantity measured by a thermometer." Bodies in thermal equilibrium with each other have the same temperature, and in a gas "temperature represents molecular kinetic energy": warmer air is air whose molecules move faster.[1]
Heat is energy on the move: "a form of energy transferred between systems, existing only in the process of transfer." The AMS adds that heat as a noun "is confusing and controversial in its scientific meaning," and defines instead the process of heating, "the net absorption of internal energy by a system."[1] The distinction is the key to this lesson. The sun does not deliver temperature; it delivers energy. Where that energy is absorbed, and how fast it is passed on or lost, decides the temperature that results.
Two kinds of heat recur in weather. Sensible heat is what warms air, "typically the outcome of heating a surface without evaporating water from it." Latent heat is the energy taken up when water evaporates and given back when vapor condenses: "when liquid water evaporates, the system must provide enthalpy to the vapor by cooling."[1] Sunshine on a dry field goes mostly into sensible heat and hot air; on a wet field or the ocean, much of it goes into evaporation, and the air warms less. The released latent heat reappears later and elsewhere, in clouds, as the lesson on rising air explains.
Three scales
The United States reports temperature in degrees Fahrenheit, most of the world and all of science in degrees Celsius, and physics in kelvins. The Fahrenheit scale puts the ice point at 32° and the boiling point of water at 212°, and converts with °F = (9/5)°C + 32.[1] The Celsius scale was named in 1948, when the General Conference on Weights and Measures replaced "degree centigrade" with "degree Celsius"; Celsius's original scale ran the other way, with boiling at 0° and ice at 100°.[1] The kelvin is the SI unit. It is defined by a fixed value of the Boltzmann constant, and in NIST's words "one Celsius degree is an interval of 1 K, and zero degrees Celsius is 273.15 K."[2] Zero kelvins is absolute zero, −273.15 °C.[1]
| Reference point | °C | °F | K |
|---|---|---|---|
| Absolute zero | −273.15 | −459.67 | 0 |
| World's lowest measured air temperature (Vostok, 1983) | −89.2 | −128.6 | 184.0 |
| Where the two scales meet | −40 | −40 | 233.15 |
| Ice point | 0 | 32 | 273.15 |
| Earth's mean surface temperature | 15 | 59 | 288.15 |
| World's highest measured air temperature (Death Valley, 1913) | 56.7 | 134 | 329.85 |
| Water boils at sea level | 100 | 212 | 373.15 |
Conversions are computed here from the formulas above. Two habits help. A change of 1 °C is a change of 1.8 °F, so a 10 °C daily range is an 18 °F range; and differences in kelvins and in degrees Celsius are the same number. The mean surface temperature is the AMS's figure; the records are from the World Meteorological Organization's archive, discussed under Extremes.[1][13]
How temperature is measured
A thermometer measures its own temperature. Put it in sunshine and it reads the balance between the sunlight it absorbs and the heat it loses, which can be far above the air's. An official air temperature is therefore taken in the shade, in moving air, at a standard height, over a standard surface.
The US reference network is the Automated Surface Observing System (ASOS), "the primary surface weather observing system in the United States," at about 1,000 airports. Its hygrothermometer measures the air with "a platinum wire Resistive Temperature Device," which "is located in the stream of aspirated air entering the sensing unit": a fan draws outside air past a sensor shielded from the sun. The instrument samples about six times a minute; every minute ASOS reports the average of the last five minutes, rounded to the nearest degree Fahrenheit and converted to tenths of a degree Celsius.[3] Its specified accuracy between −58 and +122 °F is a root mean square error of 0.9 °F, with a maximum error of 1.8 °F.[3] The daily high and low are the extremes of that running five-minute average, not of single readings.
Where the sensor stands is fixed by the federal siting standard. Its aspirator intake must be "5 ± 1 feet (1.5 ± 0.3 meters) above ground level," five feet being preferred, and the sensors "must be protected from radiation from the sun, sky, earth, and any other surrounding objects but at the same time be adequately ventilated." The site must not be "influenced by artificial conditions, such as large buildings, cooling towers, and expanses of concrete, tarmac, gravel and rocks," and grass within 30 m is kept clipped to about 25 cm.[4] The World Meteorological Organization's guide asks for a height "between 1.25 and 2 m above ground level," over natural ground, "preferably over grass," because "large vertical temperature gradients may exist in the lowest layers of the atmosphere"; it warns that readings on rooftops "are of doubtful significance."[5] The traditional housing is the instrument shelter, the white, louvered box with a double roof "mounted on a stand a meter or so above the ground with the door side facing poleward."[1]
Hourly reports from ASOS stations across the country are on the site's observations page. The figures in this lesson are built from the same reports, archived by the Iowa Environmental Mesonet.[9]
Where the energy goes
At Earth's distance, the sun delivers about 1,360 watts per square meter to a surface facing it. Averaged over the whole planet, day and night, "the amount of sunlight arriving at the top of Earth's atmosphere is only one-fourth of the total solar irradiance, or approximately 340 watts per square meter."[6] NASA's account of where it goes is the frame for everything that follows.
Table: Earth's average energy budget, percent of incoming sunlight (NASA)
| Flow | Percent | W/m² |
|---|---|---|
| Reflected to space | 29 | 99 |
| Absorbed by the atmosphere | 23 | 78 |
| Absorbed at the surface | 48 | 163 |
| Surface to air by evaporation | 25 | 85 |
| Surface to air by convection | 5 | 17 |
| Surface net infrared | 17 | 58 |
| Infrared from the atmosphere to the surface | 100 | 340 |
Three things stand out. First, the ground absorbs about twice as much sunlight as the air does: the atmosphere is heated mainly from below. Second, the surface gives up half of what it absorbs by evaporating water, "about 25 percent of incoming solar energy," and only 5 percent by convection, heated air rising.[6] Third, the surface's infrared loss is small only because it is a net figure. The ground radiates far more than 17 units, but the atmosphere radiates back down to it an amount "equivalent to 100 percent of the incoming solar energy."[6]
That downward infrared is the greenhouse effect: "the heating exerted by the atmosphere on Earth's surface because certain atmospheric constituents (clouds, water vapor, carbon dioxide, etc.) absorb and emit infrared radiation." Because of it, "Earth's annual mean surface temperature of 15°C is 33°C higher than an equally reflective planet in Earth's orbit with no atmosphere."[1] The same effect, varying from night to night with cloud and water vapor, sets how cold a night gets.
- Shortwave
- Shortwave radiation is the visible and near-visible part of the spectrum, "roughly 0.4–4.0 μm in wavelength, usually of solar origin." Sunlight received on a horizontal surface is insolation.[1]
- Longwave
- Longwave radiation, at wavelengths longer than about 4 μm, is "usually of terrestrial origin": the infrared emitted day and night by the ground, the air and clouds.[1]
How heat moves
Energy reaches the air from the ground in four ways, and each has a part in the daily cycle.
- Radiation
- Thermal radiation is "electromagnetic radiation emitted by all matter." It needs no medium: sunlight crosses space, and the ground radiates infrared upward whether or not the air is moving. NOAA's JetStream course notes that dark surfaces such as asphalt absorb radiant energy faster than light ones, "however, they also radiate their energy faster."[1][7]
- Conduction
- Conduction is "transport of energy … solely as a consequence of random motions of individual molecules." It is how the sunlit ground warms the air touching it. But, in JetStream's words, "air conducts heat poorly," so conduction by itself heats only a thin layer at the surface.[1][7]
- Convection
- Convection is "mass motions within a fluid resulting in transport and mixing." Free convection is driven by density differences, heated air rising; forced convection by wind and turbulence. The AMS's examples: "On a windy day with overcast sky, the heat exchange between ground and air is an example of forced convection. On a sunny day with a little wind … both kinds of convection take place."[1]
On a sunny morning, then, the sequence is: sunlight passes through the air and is absorbed by the ground; the ground warms a thin film of air by conduction; that air, warmer and lighter than the air above, rises in plumes and mixes the heat upward. The heated layer deepens through the day, so by afternoon the warmth has been carried well above the thermometer. The next unit's lessons follow those rising plumes to the cloud base.
The daily cycle
The AMS summarizes the diurnal cycle of surface temperature in six words: "maximum occurs after local noon and minimum near sunrise."[1] How far apart the two are depends on the air and the sky. Here is the same week in two places with very different air: Phoenix, dry and cloudless, and Miami, humid and often cloudy.
- Phoenix Sky Harbor
- Miami International
- Sunset to sunrise
Table: daily high and low from the hourly reports, June 14 to 20, 2025 (local time), °F
| Day | Phoenix high | Phoenix low | Phoenix range | Miami high | Miami low | Miami range |
|---|---|---|---|---|---|---|
| June 14 | 108 (2:51 pm) | 82 (5:51 am) | 26 | 89 (2:53 pm) | 80 (3:53 am) | 9 |
| June 15 | 113 (3:51 pm) | 82 (5:51 am) | 31 | 89 (2:53 pm) | 79 (4:53 am) | 10 |
| June 16 | 113 (2:51 pm) | 84 (5:51 am) | 29 | 89 (1:53 pm) | 81 (5:53 am) | 8 |
| June 17 | 109 (3:51 pm) | 87 (4:51 am) | 22 | 89 (3:53 pm) | 78 (12:53 am) | 11 |
| June 18 | 112 (4:51 pm) | 84 (5:51 am) | 28 | 89 (12:53 pm) | 76 (5:53 am) | 13 |
| June 19 | 116 (3:51 pm) | 87 (4:51 am) | 29 | 89 (12:53 pm) | 80 (1:53 am) | 9 |
| June 20 | 109 (3:51 pm) | 84 (5:51 am) | 25 | 89 (1:53 pm) | 78 (4:53 am) | 11 |
The daily ranges averaged 27.1 °F at Phoenix and 10.1 °F at Miami. Both places received roughly the same June sunshine at the top of the atmosphere. The difference is what happened to it below. Over Phoenix, dry ground with little water to evaporate turned most of the absorbed sunlight into sensible heat, and at night dry, clear air let the ground's infrared escape. Over Miami, humid air, wet ground and nearby ocean spent much of the energy on evaporation, and water vapor and cloud held the nights up.
- Phoenix, range 21.6 °F
- Miami, range 6.9 °F
Table: mean temperature and dew point by hourly report, June 2025, °F
| Report | Phoenix | Phoenix dew point | Miami | Miami dew point |
|---|---|---|---|---|
| Midnight | 90.0 | 37.8 | 81.2 | 73.2 |
| 1 am | 87.8 | 39.1 | 80.8 | 73.7 |
| 2 am | 86.4 | 39.2 | 80.4 | 73.9 |
| 3 am | 84.6 | 40.7 | 79.9 | 73.8 |
| 4 am | 83.3 | 40.7 | 79.9 | 73.8 |
| 5 am | 82.3 | 41.1 | 79.6 | 73.9 |
| 6 am | 84.1 | 41.5 | 79.9 | 74.0 |
| 7 am | 87.0 | 40.9 | 81.8 | 74.3 |
| 8 am | 90.0 | 40.3 | 83.3 | 74.1 |
| 9 am | 92.9 | 40.3 | 84.2 | 73.7 |
| 10 am | 96.0 | 39.9 | 85.9 | 73.6 |
| 11 am | 98.7 | 38.9 | 86.0 | 73.3 |
| Noon | 101.1 | 37.7 | 86.2 | 73.2 |
| 1 pm | 102.7 | 36.7 | 86.5 | 72.7 |
| 2 pm | 103.1 | 36.0 | 86.5 | 73.1 |
| 3 pm | 103.8 | 34.9 | 86.4 | 72.7 |
| 4 pm | 103.9 | 35.3 | 85.8 | 72.7 |
| 5 pm | 103.5 | 35.3 | 85.0 | 72.7 |
| 6 pm | 102.1 | 34.5 | 83.9 | 72.6 |
| 7 pm | 100.3 | 34.5 | 82.9 | 73.0 |
| 8 pm | 97.9 | 35.5 | 82.3 | 73.3 |
| 9 pm | 95.6 | 36.3 | 81.8 | 73.1 |
| 10 pm | 93.7 | 36.9 | 81.7 | 73.1 |
| 11 pm | 92.1 | 37.7 | 81.6 | 73.0 |
The high comes after noon because the temperature does not follow the sunshine; it follows the balance of energy. The air keeps warming as long as the ground takes in more than it loses. At noon the gain is largest, but it is still larger than the losses for several hours after, so the temperature goes on rising until the weakening sun no longer makes up for them, usually in mid-afternoon. From then on the budget is negative, and it stays negative all night: the ground radiates infrared and gets no sunlight back, so the temperature falls until the sun returns. The low therefore comes near sunrise, often a few minutes after it, while the early sun is still too weak to outweigh the losses. The same reasoning, stretched over months, explains the seasonal lag.
Weather interrupts the pattern constantly. A cold front arriving in the afternoon can make the day's high come in the morning, and the cool air under a thunderstorm can drop the temperature within minutes. The Miami week shows smaller departures: every day's highest hourly report was 89 °F, reached between 12:53 and 3:53 pm, and on three days the low came between midnight and 4 am rather than near sunrise. Forecasts of the high and low are forecasts of these interruptions as much as of the sun.
Why clear, calm nights are cold
After sunset the ground loses heat by radiation and nothing replaces it. The AMS calls the result radiational cooling, which occurs, "as is typical on calm, clear nights, whenever the longwave emission from the surface is not balanced by significant amounts of absorbed shortwave radiation or downwelling longwave from the atmosphere above the surface."[1] Two things decide how much downwelling longwave there is, and one decides whether the cold stays at the ground:
- Clouds. A cloud deck absorbs the ground's infrared and radiates much of it back. An overcast night loses little.
- Water vapor. Humid air does the same, less strongly. Dry air lets more escape, which is why deserts cool so fast after dark.
- Wind. The cooling happens at the ground. Calm air lets the chilled air pool there in a radiation inversion, a layer in which temperature rises with height; wind mixes warmer air from above down to the surface and keeps the thermometer up.[1]
- November 22: clear, wind 4.4 kt
- November 20: overcast, wind 4.9 kt
Table: the two nights, every report after sunset (CDT), °F
| Hours after sunset | November 22 | November 20 |
|---|---|---|
| 0 | 56 | 42 |
| 1 | 53 | 41 |
| 2 | 50 | 42 |
| 3 | 49 | 43 |
| 4 | 46 | 44 |
| 5 | 47 | 44 |
| 6 | 45 | 43 |
| 7 | 43 | 42 |
| 8 | 41 | 41 |
| 9 | 39 | 41 |
| 10 | 37 | 41 |
| 11 | 35 | 41 |
| 12 | 34 | 40 |
| 13 | 34 | 40 |
| 14 | 33 | 39 |
| 15 | 34 | 39 |
Table: fall from sunset to the low, Des Moines, 2025, °F
| Nights | Count | Median | 25th percentile | 75th percentile |
|---|---|---|---|---|
| Clear, wind 5 kt or less | 22 | 15.5 | 12.0 | 17.0 |
| Clear, wind 10 kt or more | 6 | 12.0 | 11.0 | 13.8 |
| Overcast, any wind | 84 | 8.0 | 3.0 | 12.0 |
A year of reports makes the rule quantitative. On the 22 nights of 2025 with no more than a few clouds and an average wind of 5 knots or less, the temperature fell a median 15.5 °F from sunset to the low. On the 6 clear nights with a wind of 10 knots or more, it fell 12 °F. On the 84 overcast nights, it fell 8 °F, and on a quarter of them 3 °F or less. The clear, calm night is the one that brings frost, fog and the season's first freeze, the more so when the air is also dry.
Cold air in valleys
Air cooled against the ground is denser than the air beside it, and on sloping land it flows downhill. The AMS describes drainage winds as "cold-air-runoff winds that are produced when air in contact with terrain surfaces is cooled and flows downslope and/or downvalley," and notes that even over gently sloping ground they "drain cold air into frost hollows, river valleys, and other lower-lying terrain."[1]
The result is the frost hollow: "a local bowl-shaped region or depression in the surface in which, in suitable conditions, cold air accumulates during the night," and which is "subject to a greater incidence of frost, and to more severe frosts, than are the surrounding areas."[1] Above the pool of cold air lies the thermal belt, "an elevation band along mountain and other terrain slopes where nighttime surface temperatures remain relatively mild compared with temperatures above and below," which the AMS credits with "a longer growing season" and "an earlier leafing out and blossoming of trees and other vegetation."[1]
Frost, in its first AMS sense, is "the fuzzy layer of ice crystals on a cold object … that forms by direct deposition of water vapor to solid ice."[1] Frost can form while the official temperature is above 32 °F. The AMS notes that the form frost takes depends on the air temperature, the dew point "and the temperature attained by surface objects."[1] The thermometer is at 1.5 m. On a clear, calm night the grass, a car roof or a bridge deck radiates to the sky and sits at the bottom of the radiation inversion, colder than the air at thermometer height. A later lesson in the course, Inversions and the cap, takes up the radiation inversion these nights leave behind in the morning sounding.
The seasonal lag
The sun is highest, and the days longest, at the June solstice. The hottest weeks come later. NOAA's National Centers for Environmental Information: "The temperature increase after the solstice occurs because the rate of heat input from the sun during the day continues to be greater than the cooling at night for several weeks."[11] This is the seasonal lag, the daily cycle's afternoon peak stretched over a year.
- Des Moines
- Phoenix
- Sacramento
- San Francisco (downtown)
Table: NCEI 1991 to 2020 normals, warmest and coldest days of the year
| Station | Warmest normal mean, °F | On | Coldest normal mean, °F | On | Annual range, °F |
|---|---|---|---|---|---|
| DES MOINES INTL AP, IA US | 76.3 | July 16 to July 21 | 21.9 | Jan. 15 to Jan. 22 | 54.4 |
| PHOENIX SKY HARBOR INTL AP, AZ US | 95.8 | July 13 to July 18 | 54.7 | Dec. 21 to Dec. 25 | 41.1 |
| SACRAMENTO EXECUTIVE AP, CA US | 76.3 | July 22 | 46.5 | Dec. 23 to Dec. 31 | 29.8 |
| SAN FRANCISCO DWTN, CA US | 63.0 | Sept. 16 to Oct. 4 | 51.6 | Jan. 1 to Dec. 31 | 11.4 |
Table: normal daily mean temperature on the 1st and 15th of each month, °F
| Date | Des Moines | Phoenix | Sacramento | San Francisco |
|---|---|---|---|---|
| Jan. 1 | 23.6 | 55.2 | 46.6 | 51.6 |
| Jan. 15 | 21.9 | 56.8 | 47.4 | 52.0 |
| Feb. 1 | 22.9 | 58.2 | 49.3 | 53.2 |
| Feb. 15 | 26.7 | 59.7 | 51.5 | 54.2 |
| March 1 | 32.5 | 62.6 | 53.7 | 55.0 |
| March 15 | 39.1 | 66.1 | 55.3 | 55.5 |
| April 1 | 46.2 | 70.0 | 57.1 | 55.9 |
| April 15 | 51.1 | 72.9 | 59.3 | 56.3 |
| May 1 | 56.7 | 77.1 | 62.8 | 56.9 |
| May 15 | 62.0 | 81.6 | 66.0 | 57.6 |
| June 1 | 68.2 | 87.3 | 69.5 | 58.9 |
| June 15 | 72.3 | 91.5 | 72.2 | 59.8 |
| July 1 | 75.2 | 94.8 | 74.9 | 60.2 |
| July 15 | 76.2 | 95.8 | 76.1 | 60.3 |
| Aug. 1 | 75.8 | 95.1 | 76.0 | 60.8 |
| Aug. 15 | 74.3 | 94.5 | 75.4 | 61.7 |
| Sept. 1 | 70.9 | 93.1 | 74.5 | 62.6 |
| Sept. 15 | 66.6 | 89.8 | 72.8 | 62.9 |
| Oct. 1 | 60.0 | 83.6 | 69.4 | 63.0 |
| Oct. 15 | 53.6 | 77.7 | 65.0 | 62.4 |
| Nov. 1 | 45.7 | 71.1 | 58.9 | 60.2 |
| Nov. 15 | 39.4 | 65.3 | 53.8 | 57.3 |
| Dec. 1 | 32.7 | 58.7 | 49.2 | 54.1 |
| Dec. 15 | 27.7 | 55.2 | 47.0 | 52.3 |
Des Moines shows the lag at its plainest. Its warmest normal days, at 76.3 °F, fall about four weeks after the solstice, and its coldest, at 21.9 °F, from January 15 to 22, about four weeks after the December solstice. The top of the atmosphere over Des Moines receives the same sunlight on May 23 (466 W/m²) as on July 20 (465 W/m²), computed here, but the normal daily mean is 65.0 °F on the first date and 76.3 °F on the second. In May the ground, the lakes and the air are still warming from winter; by July they have stored two more months of surplus.
The lag is longer where the water is. San Francisco's warmest normal days come in late September, three months after the solstice, and its whole year spans only 11.4 °F between the coldest and warmest normal days, against 54.4 °F at Des Moines. NCEI: "The persistence of the marine layer along the Pacific Coast leads to cool temperatures in early summer, with the warmest days on average occurring as late as October."[11] The warmest day of the year at a particular place, and its normal high and low for every date, are on the site's climate pages, built from the same NCEI normals.
Land and water
Water and land take in sunlight differently. NOAA's JetStream course gives the reasons: the sun's rays penetrate deep into clear water, so "it takes a great amount of heat to raise the temperature through such a large volume of water," and "constant turbulence from wind and weather continually mixes the water, distributing surface heating through the water column." On land, the rays "are confined to the top few inches of soil. Consequently, temperature fluctuations between daytime and nighttime are much greater over land than over water."[8] Evaporation, which the ocean supplies without limit, takes another share.
- San Francisco, downtown
- Sacramento Executive Airport
Table: NCEI 1991 to 2020 monthly normals, °F
| Month | San Francisco high | San Francisco low | Sacramento high | Sacramento low |
|---|---|---|---|---|
| January | 57.8 | 46.6 | 56.0 | 39.2 |
| February | 60.4 | 47.9 | 61.3 | 41.5 |
| March | 62.1 | 48.9 | 66.3 | 44.5 |
| April | 63.0 | 49.7 | 72.1 | 47.0 |
| May | 64.1 | 51.4 | 80.3 | 52.0 |
| June | 66.5 | 53.0 | 87.9 | 56.5 |
| July | 66.3 | 54.4 | 92.6 | 59.2 |
| August | 67.9 | 55.5 | 91.9 | 58.8 |
| September | 70.2 | 55.6 | 88.5 | 56.5 |
| October | 69.8 | 54.4 | 78.8 | 50.3 |
| November | 63.7 | 50.7 | 65.0 | 42.7 |
| December | 57.9 | 47.0 | 56.0 | 38.5 |
The comparison shows both effects of the ocean. The daily range at San Francisco is 11 to 15 °F in every month; at Sacramento it grows from 17 °F in January to 33 °F in July. The yearly range of the monthly means is 10.7 °F at San Francisco and 28.6 °F at Sacramento. The ocean cools the coast's summer and warms its winter, and it pushes the warmest month to September. In summer the contrast drives the sea breeze, "a coastal local wind that blows from sea to land, caused by the temperature difference when the sea surface is colder than the adjacent land," which carries the marine air inland each afternoon.[1] The same contrast on a continental scale is why Des Moines, far from any ocean, has a yearly range nearly five times San Francisco's.
The urban heat island
Cities change nearly every term of the surface budget. The EPA lists the causes: urban materials "absorb and emit more of the sun's heat compared to trees, vegetation, and other natural surfaces"; hard, dry surfaces "provide less shade and moisture than natural landscapes," so less of the sunshine goes into evaporation; "the dimensions and spacing of buildings within a city influence wind flow"; and "vehicles, air-conditioning units, buildings, and industrial facilities all emit heat into the urban environment."[12]
The result is the urban heat island, named for the closed isotherms around a city on a temperature map, like the contours of an island. The AMS gives its size: "The annual mean temperature of a large city (say 106 inhabitants) may be 1°–2°C warmer than before development, and on individual calm, clear nights may be up to 12°C warmer."[1] The EPA, citing the Fourth National Climate Assessment, puts daytime air temperatures in urban areas "about 1–7°F higher than temperatures in outlying areas and nighttime temperatures about 2–5°F higher."[12] Surfaces run far hotter than the air: "on a warm day, conventional roofing materials may reach as much as 66°F warmer than the surrounding air temperatures."[12]
The heat island is largest on exactly the nights of the last two sections: clear and calm, when the countryside cools freely and the heat the city stored by day holds it up. That matters in heat waves, when the night's low decides whether bodies and buildings recover. It also matters for climate records, which is one reason the siting standard keeps official sensors away from buildings and pavement.
Extremes
The World Meteorological Organization keeps the official archive of weather and climate extremes. Its table as of July 31, 2025 lists these temperature records.[13]
| Record | Value | Place | Date | Elevation |
|---|---|---|---|---|
| Highest temperature | 56.7 °C (134 °F) | Furnace Creek (Greenland Ranch), California | July 10, 1913 | −54 m |
| Lowest temperature | −89.2 °C (−128.6 °F) | Vostok, Antarctica | July 21, 1983 | 3,420 m |
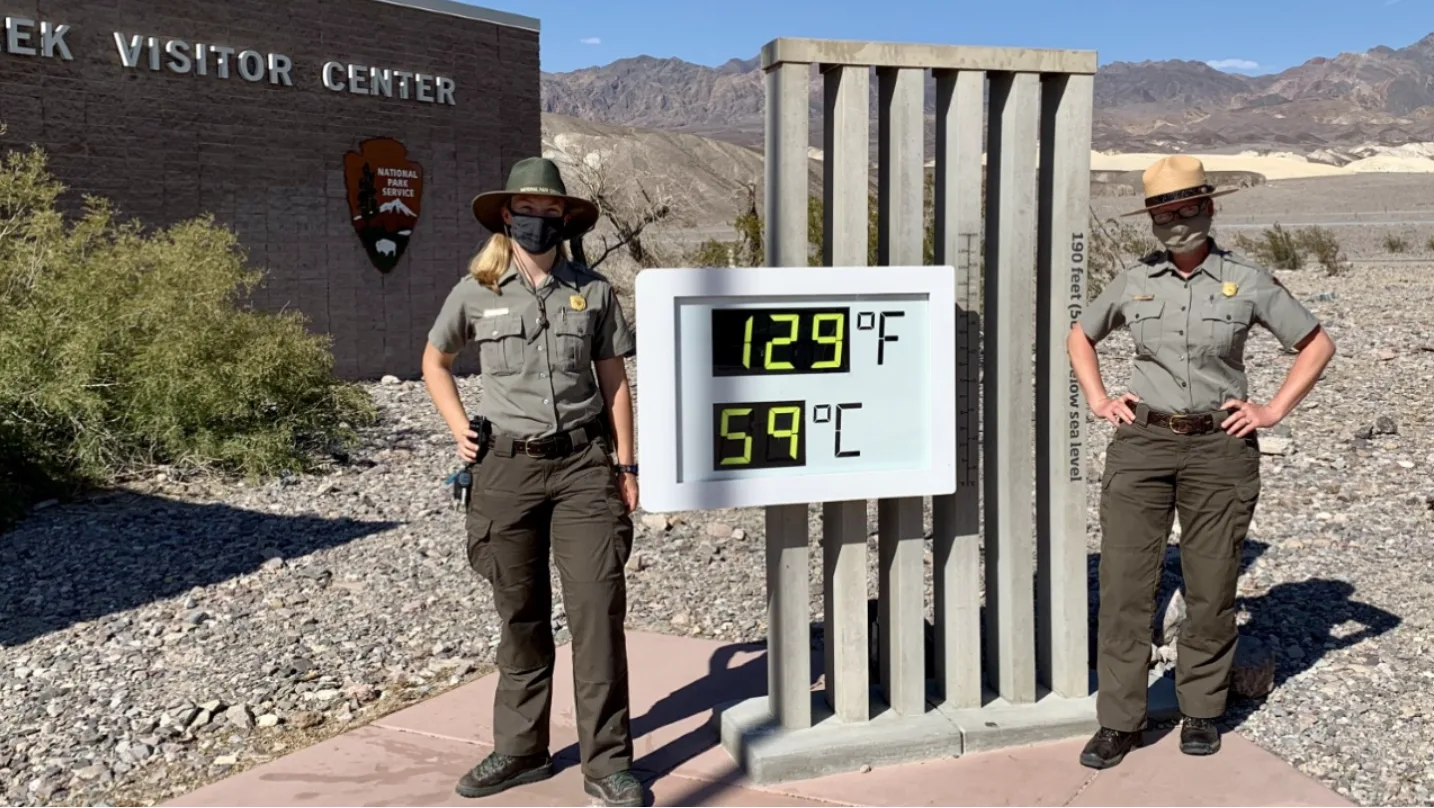
The high record has a history. For ninety years the books gave 58 °C (136 °F) at El Azizia, Libya, on September 13, 1922. A WMO panel of experts examined it in 2010 and 2011 and rejected it, citing problems with the instrument, a probably inexperienced observer, an unrepresentative site and poor agreement with other stations; the WMO then certified the Death Valley reading. In NCEI's account, "additional evidence came to light indicating that the 136°F reading was invalid."[14][25] The Death Valley value is itself disputed. In 2016 the weather historian Christopher Burt concluded that a temperature of 134 °F there on July 10, 1913 "was essentially not possible from a meteorological perspective," pointing to surrounding stations that were far less above normal and to the observer's record-keeping.[15] A study by Roy Spencer, John Christy and William Reid in the Bulletin of the American Meteorological Society, reported by weather.com in November 2025, estimated the actual high that day at 118 to 122 °F, and suggested the reading may have come from a thermometer on a veranda, exposed to direct sunlight, rather than the standard Weather Bureau shelter.[16] The WMO's table of July 2025 still lists 134 °F, and it stands as the official value.
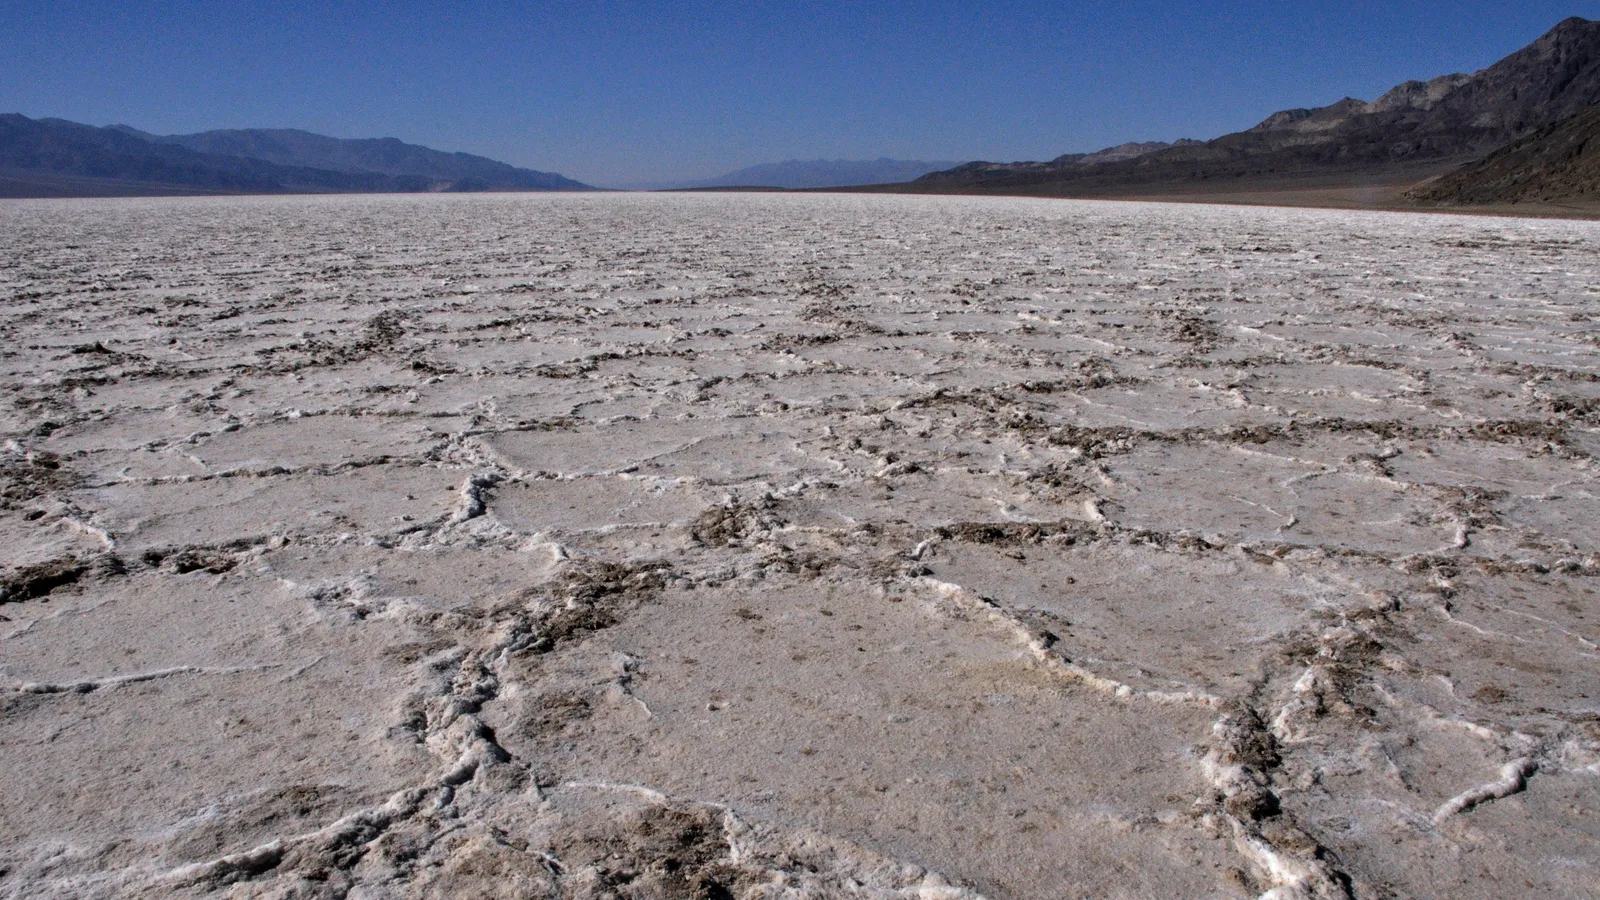
Both records come from the kinds of place this lesson's physics predicts. Death Valley is a dry basin 54 m below sea level, where there is little water to evaporate and the sunlight goes into sensible heat. Vostok sits 3,420 m up on the Antarctic ice sheet at 78° S, where the sun does not rise at all from late April to late August (computed here), and the snow reflects most of what sunlight there is.
Wind chill and heat index
The body is not a thermometer. It makes its own heat and loses it by the processes above, and two indices translate the air's conditions into that loss.
- Wind chill
- "How cold people and animals feel when outside," based on "the rate of heat loss from exposed skin caused by wind and cold." The National Weather Service computes it as 35.74 + 0.6215T − 35.75V0.16 + 0.4275TV0.16, with T in °F and V in mph. At 0 °F and 15 mph the wind chill is −19 °F, and "exposed skin can freeze in 30 minutes."[17] Wind chill describes heat loss from skin, so it applies to people and animals, not to the air.
- Heat index
- "What the temperature feels like to the human body when relative humidity is combined with the air temperature." Humid air slows the evaporation of sweat, the body's main way of shedding heat. The NWS values are for shade; "if you are exposed to direct sunlight, the heat index value can be increased by up to 15°F."[18] A heat index of 103 to 124 °F is in the Danger category.[18]
Humidity itself, and why the dew point is the better measure of it, is the subject of the next lesson, Dew point and humidity.
Reading a temperature
With the physics in hand, a forecast or an observation can be read for its causes. For any high or low, this order covers the main ones.
- Sky. Clouds by day cap the high; clouds by night hold up the low. A clear night after a clear day means a large range.
- Wind. Calm nights cool at the ground; windy nights stay mixed and milder. Calm, clear nights are the frost and fog nights.
- Moisture. A low dew point allows a large daily range; a high one narrows it and sets a floor under the night.
- The ground. Wet soil, snow cover, a lake or the sea take energy that would otherwise heat the air. Snow reflects most sunshine.
- Place. Valley floors are colder on calm nights than slopes; cities are warmer than their surroundings; coasts vary less than inland.
- The air mass. None of the above outweighs a front. When the air itself is replaced, the high and low can come at any hour.
Check yourself
-
A friend says the sun heats the air directly. What does the energy budget say?
Answer
Mostly not. The atmosphere absorbs about 23 percent of incoming sunlight, the surface about 48. The air is heated largely from below, by the ground, through conduction, convection, latent heat and infrared radiation.
-
Why does the temperature usually peak in mid-afternoon rather than at noon?
Answer
Because the ground and air keep gaining more energy than they lose for several hours after the sun is highest. The temperature rises until the weakening sunshine no longer outweighs the losses. At Phoenix in June 2025 the average day peaked at 4:51 pm, with the sun highest at 12:28 pm.
-
Two nights in November: one clear and calm, one overcast. Which will be colder by dawn, if both start at the same temperature, and why?
Answer
The clear, calm night. Without cloud, more of the ground's infrared escapes to space, and without wind the chilled air stays at the surface. At Des Moines in 2025 the median fall was 15.5 °F on clear, calm nights and 8 °F on overcast ones.
-
The official low was 35 °F, yet there was frost on the windshield. How?
Answer
The official temperature is measured about 1.5 m above the ground. On a clear, calm night surfaces that radiate to the sky, such as a car roof or grass, become colder than the air at that height, cold enough for water vapor to deposit on them as ice.
-
The top of the atmosphere over Des Moines gets the same sunlight on May 23 and July 20. Why is July about 11 °F warmer?
Answer
The seasonal lag. After the solstice, heating by day still exceeds cooling by night, so the land, lakes and air keep accumulating heat into July. In May they are still recovering from winter.
-
Why is San Francisco's warmest month September, and its daily range so small?
Answer
The Pacific. Water heats slowly because sunlight penetrates deep and mixing spreads the heat through a large volume, so the ocean moderates the coast's air in both the day and the year. The marine layer keeps early summer cool, and the warmest weather comes late, when the marine layer weakens.
-
A thermometer on a sunny patio reads 104 °F while the nearest airport reports 96 °F. Which is the air temperature?
Answer
Almost certainly the airport's. Its sensor is shaded, ventilated by a fan and mounted about 1.5 m above grass away from pavement and buildings. The patio thermometer is reading the sunlight it absorbs and the heat of the pavement around it.
Video


Methods
The hourly figures use routine ASOS reports (METAR), taken at 51 to 54 minutes past each hour, downloaded from the Iowa Environmental Mesonet: Phoenix Sky Harbor (PHX) and Miami International (MIA) for June 2025, Des Moines International (DSM) for 2025. The temperatures are the reported whole degrees Fahrenheit. Highs and lows taken from hourly reports can miss the true daily extremes, which ASOS records from its running five-minute average between reports. Sky cover is the greatest coverage reported in any layer; "broken or overcast" means five eighths or more. Sunrise, sunset and solar noon use NOAA's solar position equations (declination and equation of time from Spencer's Fourier series), with the sun's center 0.833° below the horizon at sunrise and sunset.
For the Des Moines nights, each night runs from sunset to one hour after the next sunrise;
the starting temperature is the report nearest sunset, the low the lowest report in the
window, and nights with fewer than eight reports or missing wind were dropped, leaving 361.
"Clear" nights reported no scattered, broken or overcast layer at any time; "overcast"
nights reported broken or overcast cloud in at least 90 percent of their reports. Wind is
the mean of the hourly reports. The seasonal figure's sunlight curve is the daily mean
top-of-atmosphere insolation on a horizontal surface at 41.53° N, with a solar constant of
1,361 W/m² and the Earth-sun distance correction; it is not the sunlight reaching the
ground. The normals are NCEI's 1991 to 2020 daily and monthly station normals, read
unchanged. Temperature conversions use the AMS and NIST formulas. The code and data are in
the site's repository, under scripts/learn/.
Related
Air pressure, the lesson before this one, shows how temperature sets the thickness of the air column. What happens to air heated at the ground once it rises is the subject of Air parcels and adiabatic cooling. Current temperatures across the country are on the observations page, and normals, frost dates and records for any station on the climate pages. Unfamiliar terms are in the glossary.
Sources
Quotations are verbatim from the source named. Figures marked "computed here" are described under Methods.
- American Meteorological Society, Glossary of Meteorology, entries temperature, heat, sensible heat, latent heat, Fahrenheit temperature scale, Celsius temperature scale, absolute zero, instrument shelter, greenhouse effect, shortwave radiation, longwave radiation, insolation, albedo, thermal radiation, conduction, convection, diurnal, radiational cooling, radiation inversion, drainage wind, frost hollow, thermal belt, frost, sea breeze and urban heat island.
- National Institute of Standards and Technology, SI Units: Temperature.
- National Weather Service, Automated Surface Observing System (ASOS) User's Guide, introduction and section 3.1, ambient and dew point temperature, including table 1.
- Office of the Federal Coordinator for Meteorological Services and Supporting Research, Federal Standard for Siting Meteorological Sensors at Airports, FCM-S4-2019, July 2019, section 2.6.
- World Meteorological Organization, Guide to Instruments and Methods of Observation, WMO-No. 8, 2023 edition, volume I, section 2.1.4.2.1.
- Rebecca Lindsey, NASA Earth Observatory, Climate and Earth's Energy Budget, 2009, updated September 18, 2025.
- NOAA JetStream, The Transfer of Heat Energy.
- NOAA JetStream, The Sea Breeze.
- Iowa Environmental Mesonet, ASOS/AWOS data download: PHX and MIA, June 2025; DSM, 2025.
- NOAA National Centers for Environmental Information, U.S. Climate Normals, 1991 to 2020, daily and monthly station normals for Des Moines International Airport (USW00014933), Phoenix Sky Harbor (USW00023183), Sacramento Executive Airport (USW00023232) and San Francisco downtown (USW00023272).
- NOAA National Centers for Environmental Information, When to Expect the Warmest Day of the Year, 2016, updated June 29, 2023.
- US Environmental Protection Agency, What Are Heat Islands?, citing Hibbard et al. (2017), Climate Science Special Report: Fourth National Climate Assessment, and Boujelbene et al. (2023).
- World Meteorological Organization, Records of Weather and Climate Extremes Table, as of July 31, 2025.
- NOAA National Centers for Environmental Information, On This Day: Earth's Hottest Temperature, 2017, updated July 7, 2023.
- Christopher C. Burt, Weather Underground, An Investigation of Death Valley's 134°F World Temperature Record, October 24, 2016.
- Jonathan Erdman, weather.com, Why Death Valley's World Record 134 Degree High Should Be Overturned, November 20, 2025, reporting R. Spencer, J. Christy and W. Reid, "Death Valley Illusion: Evidence against the 134°F World Record," Bulletin of the American Meteorological Society 107 (1), 2026.
- National Weather Service, Wind Chill Chart.
- National Weather Service Amarillo, Heat Index.
- D. Pate, National Park Service, Badwater Basin, Death Valley National Park, September 21, 2010, via Wikimedia Commons, public domain.
- E. Deldin, National Park Service, Furnace Creek Visitor Center park rangers with the thermometer sign, July 2020, via Wikimedia Commons, public domain.
- NASA Goddard, NASA: Why does the Sun Matter for Earth's Energy Budget?, YouTube.
- NWS Tampa Bay (NWSTampa), radiational cooling, YouTube.
- MinuteEarth, Why The Shortest Day Of The Year Isn't The Coldest, YouTube.
- NOAA Satellites, NEDTalk: Extreme heat, Mapping Heat Islands in Cities, YouTube.
- K. I. El Fadli and others, World Meteorological Organization Assessment of the Purported World Record 58°C Temperature Extreme at El Azizia, Libya (13 September 1922), Bulletin of the American Meteorological Society 94 (2), 2013, abstract.
.jpg)

Corrections: contact@weatherovertime.com.
Unit 1: The atmosphere
- Layers of the atmosphere
Troposphere to thermosphere, and why weather happens in the lowest layer.
- Air pressure
What pressure is, how it is measured, and why it falls with height.
- Temperature and heat
How the sun heats the ground, the ground heats the air, and the day warms and cools.
- Dew point and humidity
Why dew point, not relative humidity, is the number forecasters watch.
- How clouds form and how to name them
Condensation, cloud bases, and the ten cloud genera.