Layers of the atmosphere
- Read first
- Nothing; this lesson starts from the beginning.
The atmosphere is a thin shell of gas held to the earth by gravity. Half of its mass lies within 5.5 km of sea level, and almost all of its weather within the lowest 10 to 17 km. Above that the air is layered by temperature: it cools with height, then warms, then cools again, then warms again as it thins into space. This lesson explains what the air is made of, where its mass is, how the layers are defined and why they exist, and why storms stop where they do, using the U.S. Standard Atmosphere and real weather balloon measurements from the Caribbean to the Arctic.
- What air is made of, and how much water vapor it can hold.
- Where the mass is: why half the atmosphere is below 5.5 km.
- The five layers and the boundaries between them, from the U.S. Standard Atmosphere, 1976, computed here from its own equations.
- The tropopause measured, by balloons from Barbados to the high Arctic in January and July, and why it is highest and coldest over the tropics.
- Why weather stays low: the stable stratosphere, ozone heating, and the thunderstorm tops that punch through.
- The upper atmosphere: meteors, the coldest air on earth, the ionosphere, the aurora and where space begins.
What air is made of
The American Meteorological Society defines an atmosphere as "a gaseous envelope gravitationally bound to a celestial body," and notes that the earth's is "distinguished from all other known atmospheres by its very active hydrologic cycle": its water.[5] Leave the water aside for a moment and dry air is remarkably uniform. Four gases make up 99.998 percent of it by volume, and nitrogen "by far is the most common," in the words of NOAA's JetStream school.[1]
| Gas | NOAA JetStream, share of dry air by volume | U.S. Standard Atmosphere, 1976 |
|---|---|---|
| Nitrogen, N₂ | 78.084% | 78.084% |
| Oxygen, O₂ | 20.946% | 20.9476% |
| Argon, Ar | 0.934% | 0.934% |
| Carbon dioxide, CO₂ | 0.042% | 0.0314% |
| Neon, Ne | 18.182 ppm | 18.18 ppm |
| Helium, He | 5.24 ppm | 5.24 ppm |
| Methane, CH₄ | 1.92 ppm | 2 ppm |
| Krypton, Kr | 1.14 ppm | 1.14 ppm |
| Hydrogen, H₂ | 0.55 ppm | 0.5 ppm |
| Ozone, O₃ | 0.07 ppm | not listed |
ppm is parts per million by volume. The JetStream table lists more trace gases, down to ammonia.[1] The standard atmosphere's values are those of the 1962 standard, adjusted for carbon dioxide from Keeling's 1960 measurements.[4] The difference in the carbon dioxide row is real: NOAA's Global Monitoring Laboratory puts the global mean for 2025 at 425.62 ppm, 0.0426 percent, against the 314 ppm the standard assumed.[8] Carbon dioxide and ozone are tiny shares by volume and matter far beyond their size. Carbon dioxide "acts as a blanket that prevents the escape of heat into outer space,"[1] and ozone's absorption of sunlight is what makes the stratosphere, as the sections below show.
Water vapor
Water vapor is the exception to the uniform mix. JetStream: "The atmosphere is rarely, if ever, dry. Water vapor (water in a gas state) is nearly always present, up to about 4% of the total volume." Near zero in a desert with dry winds, close to 3 percent on very hot and humid days, approaching 4 percent in the tropics; the other gases' shares shrink to make room, so at 4 percent water vapor nitrogen is 74.96 percent of the air.[1] Nearly all of it is in the lowest layer: NASA puts about 99 percent of the atmosphere's water vapor and aerosols in the troposphere.[6] Vapor that condenses into cloud releases heat, and the AMS calls the thermodynamics of water vapor "the crucial factor to the existence of severe storms in Earth's atmosphere."[5] How it is measured is the subject of the unit's lesson on dew point and humidity.
The proportions hold to great heights because the air is stirred. The AMS calls the part of the atmosphere "from the earth's surface to about 80 or 100 km," where "there is no gross change in atmospheric composition," the homosphere. Above it, in the heterosphere, the gases sort themselves by weight and the mix changes with height.[5]
Where the mass is
Air pressure at any height is the weight of all the air above it. So the fraction of sea-level pressure left at a height is, very nearly, the fraction of the atmosphere's mass still above it, and a pressure profile doubles as a map of where the air is. Air is compressible, so the lowest layers, squeezed by everything above, are the densest, and pressure falls fastest near the ground. The air pressure lesson explains the physics; here are the consequences.
Table: pressure and the share of mass below, U.S. Standard Atmosphere, 1976
| Height, km | Pressure, hPa | Mass below, % |
|---|---|---|
| 0 | 1,013 | 0 |
| 1 | 898.8 | 11.3 |
| 2 | 795 | 21.5 |
| 3 | 701.2 | 30.8 |
| 5 | 540.5 | 46.7 |
| 5.5 | 505.4 | 50.1 |
| 8 | 356.5 | 64.8 |
| 10 | 265 | 73.8 |
| 10.67 | 239 | 76.4 |
| 12 | 194 | 80.9 |
| 16 | 103.5 | 89.8 |
| 20 | 55.29 | 94.5 |
| 25 | 25.49 | 97.5 |
| 30 | 11.97 | 98.8 |
| 40 | 2.871 | 99.7 |
| 50 | 0.798 | 99.9 |
The 500 hPa pressure level, which forecasters use to follow weather systems in the middle of the troposphere, sits near 5.5 km for the same reason: it is the height with half the atmosphere above and half below. An airliner cruising at 35,000 feet, which the NASA stratospheric research project DCOTSS gives as typical,[12] flies at 10.7 km with about 76 percent of the air beneath it. The layer from the ground to the standard tropopause at 11 km holds 77.7 percent of the mass; the standard stratosphere, from 11 to 47 km, another 22.2 percent; everything above 50 km, less than a tenth of one percent.
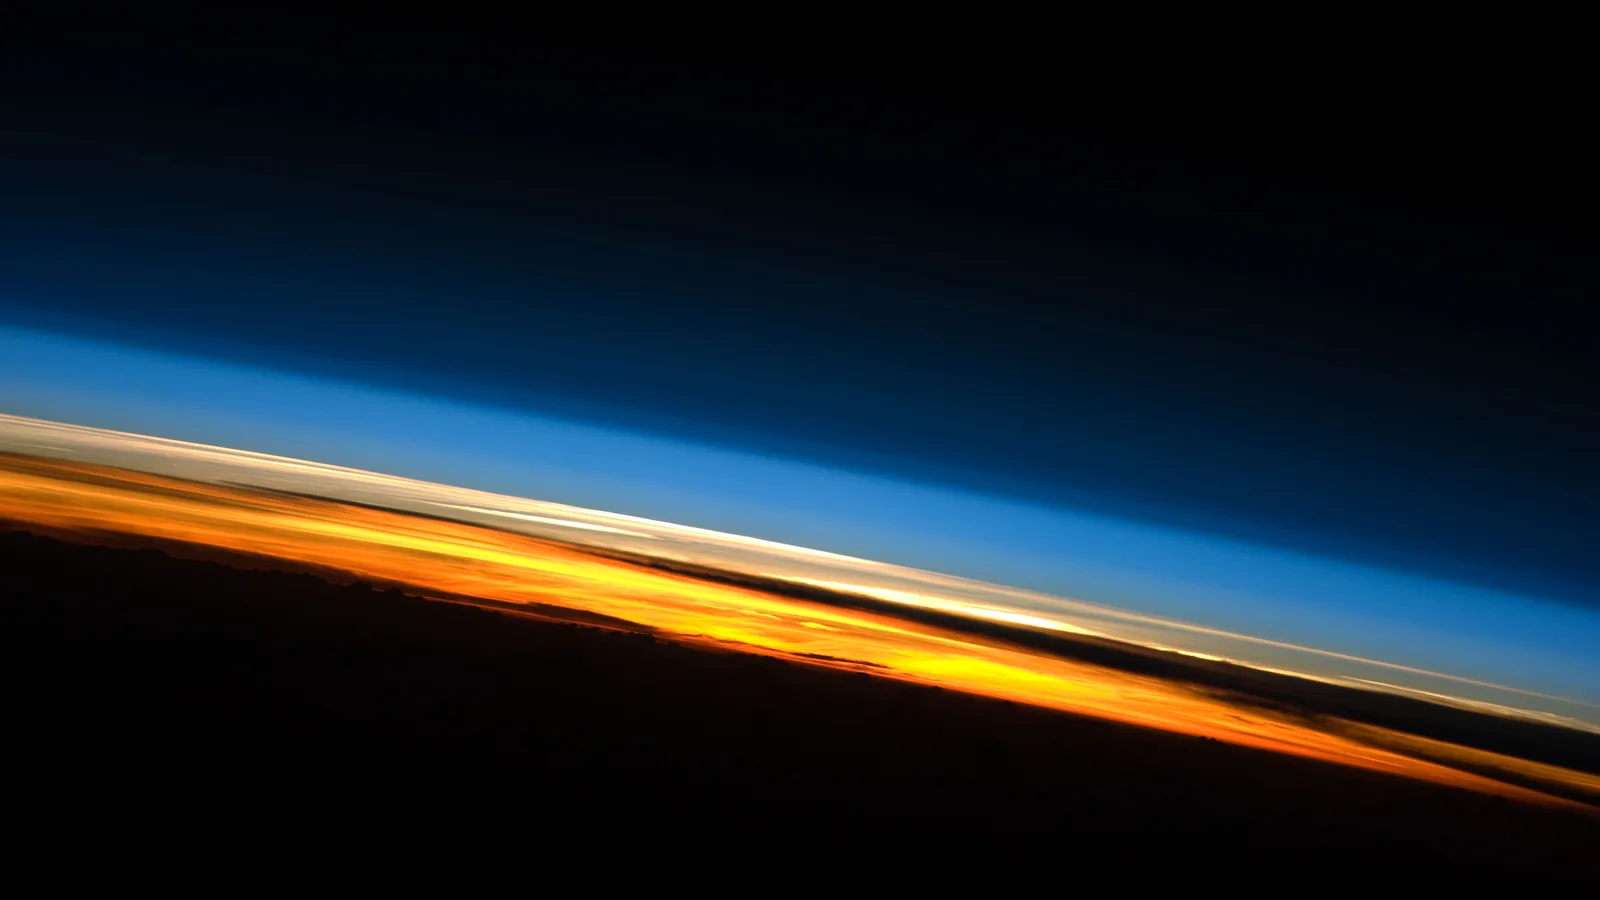
Published figures differ because the real tropopause moves. NASA's caption for the hero photograph says the troposphere "contains over 80 percent of the mass of the atmosphere,"[7] and JetStream that the stratosphere "holds 19 percent of the atmosphere's gases."[2] Both fit a tropopause somewhat higher than the standard's 11 km, which, as the soundings below show, it is over much of the earth.
Five layers, defined by temperature
The layers are named for how temperature changes with height. The AMS summary: "The region where the temperature decreases because of the upward heat flux is called the troposphere. Above it, there is a layer in which temperature increases upward because of ozone absorption of solar radiation, the stratosphere. Above this, the temperature decreases in the mesosphere, and above this, in the thermosphere, the extremely energetic radiation causes temperature to increase with height out to the outer reaches of Earth's atmosphere, the exosphere."[5] Each boundary is a "pause," named for the layer below it: the tropopause, the stratopause and the mesopause.[2]
The reference profile is the U.S. Standard Atmosphere, 1976: "an idealized, steady-state representation of the earth's atmosphere from the surface to 1000 km, as it is assumed to exist in a period of moderate solar activity." It is the atmosphere that aircraft altimeters are calibrated against. Below 86 km it is a chain of straight lines, each with a fixed rate of temperature change, starting from 15 °C and 1013.25 hPa at sea level.[4][5]
Table: the U.S. Standard Atmosphere, 1976, at selected heights
| Height, km | Temperature, °C | Temperature, K | Pressure, hPa |
|---|---|---|---|
| 0 | 15 | 288.2 | 1,013 |
| 5 | -17.5 | 255.7 | 540.5 |
| 11.02 | -56.5 | 216.7 | 226.3 |
| 15 | -56.5 | 216.7 | 121.1 |
| 20.06 | -56.5 | 216.7 | 54.78 |
| 25 | -51.6 | 221.6 | 25.49 |
| 32.16 | -44.5 | 228.6 | 8.683 |
| 40 | -22.8 | 250.3 | 2.871 |
| 47.35 | -2.5 | 270.6 | 1.109 |
| 51.41 | -2.5 | 270.7 | 0.67 |
| 60 | -26.1 | 247 | 0.22 |
| 71.8 | -58.5 | 214.7 | 0.04 |
| 80 | -74.5 | 198.6 | 0.011 |
| 86 | -86.3 | 186.9 | 0.004 |
| 91 | -86.3 | 186.9 | |
| 100 | -78.1 | 195.1 | |
| 110 | -33.1 | 240 | |
| 120 | 86.9 | 360 |
| Layer, 1976 standard | Height, km | Temperature change | Temperature at the top |
|---|---|---|---|
| Troposphere | 0 to 11.0 | −6.5 °C per km | −56.5 °C |
| Lower stratosphere | 11.0 to 20.1 | none | −56.5 °C |
| Middle stratosphere | 20.1 to 32.2 | +1.0 °C per km | −44.5 °C |
| Upper stratosphere | 32.2 to 47.4 | +2.8 °C per km | −2.5 °C |
| Stratopause | 47.4 to 51.4 | none | −2.5 °C |
| Mesosphere | 51.4 to 71.8 | −2.8 °C per km | −58.5 °C |
| Upper mesosphere | 71.8 to 86.0 | −2.0 °C per km | −86.3 °C |
| Mesopause | 86 to 91 | none | −86.3 °C |
| Thermosphere | 91 upward | rises, toward a limit | 726.8 °C at 1,000 km |
The standard defines its layers in geopotential kilometers, a height scaled by gravity; the heights here are converted to ordinary kilometers above sea level, which is why the tropopause at 11 geopotential km is 11.02 km and the mesopause base at 84.852 is 86.0. The rates are "per kilometer of height," so a negative rate is the familiar lapse rate of 6.5 °C per kilometer.[4]
The standard is a convention, not an average day. Its own introduction warns that below 20 km its tables "do not necessarily represent an average of the vast amount of atmospheric data available today," because they keep traditional definitions. Its first two layers, the troposphere cooling at 6.5 °C per kilometer and the constant layer above 11 km, "have their origin in one of the earliest aeronautical standard atmospheres (Toussaint 1919)."[4] Real profiles depart from it every day, most of all in the troposphere and at the tropopause. The published heights of the upper boundaries also differ by source, because they move and because each source rounds differently.
| Boundary | AMS Glossary | NOAA JetStream | NASA | 1976 standard |
|---|---|---|---|---|
| Tropopause | 14 to 19 km tropics, about 10 km elsewhere | 18 to 20 km equator, 9 km at 50°, 6 km poles | about 12 km on average | 11.0 km |
| Stratopause | about 50 km | about 50 km | about 50 km | 47.4 to 51.4 km |
| Mesopause | 85 to 95 km | about 85 km | about 80 km | 86 to 91 km |
| Base of the exosphere | 500 to 1,000 km | about 600 km | about 700 km | not defined |
Sources: the AMS Glossary entries for each layer, JetStream's layers page, NASA's "Earth's Atmosphere: A Multi-layered Cake," and the 1976 standard.[2][4][5][6]
The troposphere
The troposphere is, in the AMS definition, "that portion of the atmosphere from the earth's surface to the tropopause; that is, the lowest 10–20 km (6–12 mi) of the atmosphere; the portion of the atmosphere where most weather occurs." It is "characterized by decreasing temperature with height, appreciable vertical wind motion, appreciable water vapor, and weather."[5]
Temperature falls with height because the troposphere is heated from the bottom. Most sunlight passes through the air and is absorbed at the ground, and the ground passes the heat up to the air by conduction, rising currents and the release of heat when water vapor condenses. NASA: "temperatures typically go down the higher you go, since most of the heat found in the troposphere is generated by the transfer of energy from Earth's surface."[6][5] Rising air also expands as the pressure around it falls, and expanding air cools; the lesson on air parcels works out by how much.
Being heated from below is what makes weather possible. Warm air near the ground is lighter than the cooler air above it and can rise, carrying heat and moisture up, cooling, and condensing into cloud. The troposphere overturns constantly; the lesson on lapse rates and stability, in the next unit, explains when it does so gently and when violently. The three soundings in the next section cool from the ground to their tropopause at an average of 6.1 to 6.2 °C per kilometer, close to the standard's 6.5, although the day-to-day profile bends around that average with inversions, dry layers and cloud.
The tropopause, measured
The tropopause is "the transition layer between the troposphere and stratosphere, usually characterized by a distinct change of atmospheric stability, atmospheric composition, and/or atmospheric dynamics," the change being "in the direction of increased atmospheric stability in the stratosphere."[5] It was discovered with balloons. Around 1900, careful, repeated ascents by Léon Teisserenc de Bort in France and Richard Assmann in Germany made "the surprising discovery of a temperature inversion layer 10–15 km above the surface in midlatitudes."[9]
On a single sounding, the tropopause is found with a rule the World Meteorological Organization adopted in 1957: "the lowest level at which the lapse rate decreases to 2°C/km or less, provided also the average lapse rate between this level and all higher levels within 2 km does not exceed 2°C/km."[9] In words: go up the balloon's record until the cooling nearly stops, and check that it stays nearly stopped for the next 2 km, so that a brief pause in a cloud layer does not count.
- San Juan, Puerto Rico, 18° N
- Albany, New York, 43° N
- Alert, Nunavut, 82° N
- 1976 standard atmosphere
Table: the three soundings, 12 UTC July 15, 2025
| Station | Surface | Tropopause | Coldest point | Highest level |
|---|---|---|---|---|
| SAN JUAN/INT. | 3 m, 26.4 °C | 16,454 m, 103.6 hPa, −76.2 °C | 17,131 m, −76.8 °C | 33,819 m, −38.7 °C |
| ALBANY COUNTY AIRPORT | 111 m, 21.2 °C | 13,789 m, 158.9 hPa, −64.2 °C | 13,842 m, −64.3 °C | 32,811 m, −37.7 °C |
| ALERT UA | 76 m, 5.4 °C | 8,382 m, 326.2 hPa, −45.5 °C | 8,382 m, −45.5 °C | 36,860 m, −21.6 °C |
Three things stand out. The tropopause is highest over the tropics and lowest near the pole, by a factor of two. It is coldest where it is highest: San Juan's, at −76.2 °C, was more than 30 °C colder than Alert's, even though San Juan's surface air, at 26.4 °C, was 21 °C warmer than Alert's 5.4 °C. The tropics have the warmest ground and the coldest tropopause on earth; a deep troposphere, cooling at about the same rate, simply has farther to cool. And above the tropopause the three profiles behave alike, turning toward warmer temperatures with height, which is the stratosphere.
These balloons reached 32.8 to 36.9 km before bursting, in line with the National Weather Service's account that a radiosonde "can ascend to an altitude exceeding 35 km (about 115,000 feet)."[13] A sounding therefore samples the whole troposphere and the lower third of the stratosphere, 99 percent of the atmosphere's mass, twice a day at 92 US stations. The latest ones are on the radar, under weather balloon soundings, and the skew-T lesson shows how forecasters read them.
From the tropics to the Arctic
One morning is one morning. To see how the tropopause changes with latitude and season, the same calculation was run on every sounding launched at 12 UTC on January 15 and July 15, 2025 at ten stations roughly along the 60th to 80th meridians west, from Barbados to Alert, 500 miles from the North Pole.
- 12 UTC January 15, 2025
- 12 UTC July 15, 2025
Table: the tropopause at each station, 12 UTC
| Station | Latitude | January 15, 2025 | July 15, 2025 |
|---|---|---|---|
| Barbados | 13.1° N | 16.2 km, −80.7 °C | 15.7 km, −77.0 °C |
| San Juan, Puerto Rico | 18.4° N | 16.5 km, −80.6 °C | 16.5 km, −76.2 °C |
| Miami, Florida | 25.8° N | 17.5 km, −80.3 °C | no sounding |
| Charleston, South Carolina | 32.9° N | 17.1 km, −71.7 °C | 15 km, −70.1 °C |
| Sterling, Virginia | 39° N | 10.1 km, −46.6 °C | 14.5 km, −67.7 °C |
| Albany, New York | 42.7° N | 8.2 km, −48.1 °C | 13.8 km, −64.2 °C |
| Caribou, Maine | 46.9° N | 7.8 km, −51.4 °C | 12.6 km, −59.4 °C |
| Kuujjuaq, Quebec | 58.1° N | 10.4 km, −64.5 °C | 10.2 km, −50.2 °C |
| Iqaluit, Nunavut | 63.7° N | 10.2 km, −62.8 °C | 10.7 km, −53.2 °C |
| Alert, Nunavut | 82.5° N | 8.3 km, −63.1 °C | 8.4 km, −45.5 °C |
The AMS entry describes exactly this. The tropopause's "height varies from 14 to 19 km (9–12 miles) in the tropics to 10 km (6 miles) in the extratropics, reaching sometimes as low as 5 km (3 miles). A sharp discontinuity in tropopause height exists near the subtropical jet stream in each hemisphere and is often referred to as the 'tropopause break.'"[5] On January 15 the jet stream was overhead: the Charleston balloon measured 158 knots (81 m/s) from the west at 10.4 km, and the Sterling balloon 146 knots at 11.3 km. At Charleston the temperature paused in a thin inversion near 10.5 to 11 km, the top of the mid-latitude troposphere to the north, but then kept cooling faster than 2 °C per kilometer, so by the WMO rule the tropopause there was the tropical one at 17.1 km. The AMS notes that "it is also common for multiple tropopauses to exist in a profile," and that in polar winter the tropopause "can become highly deformed and difficult to identify."[5]
North of the break the January tropopause was low, 7.8 to 8.2 km over Albany and Caribou, and higher again, about 10 km, over northern Quebec and Baffin Island. The summer line is smoother and higher at almost every station north of the tropics: warm columns are deep columns. The tropical values fit the long-term record. A study of 1961 to 1990 soundings from 83 tropical stations found the tropopause "higher, colder, and at lower pressure in the Northern Hemisphere (NH) than in the Southern Hemisphere (SH) in NH winter," with December to February highs reaching 17.1 km over the western Atlantic, and an annual mean of 16.5 km in the deep tropics.[9] JetStream's 18 to 20 km for the equator is higher than these measurements.
Why storms stop at the tropopause
Above the tropopause temperature stops falling with height or rises, and warm air sitting on cooler air is stable: a parcel of air pushed up into it ends up colder and denser than its surroundings and sinks back. JetStream: "This increase in temperature with height means warmer air is located above cooler air. This prevents convection as there is no upward vertical movement of the gases. As such, the location of the bottom of this layer is readily seen by the anvil-shaped tops of cumulonimbus clouds."[2] The stratosphere is a lid. A thunderstorm updraft rises until it is no warmer than the air around it, the equilibrium level, and spreads out sideways as the anvil, "which is typically near the tropopause level."[12]
The strongest updrafts carry past it. An overshooting top is "a domelike protrusion above a cumulonimbus anvil, representing the intrusion of an updraft through its equilibrium level." It is "usually a transient feature," because the air in it quickly becomes colder than its surroundings and falls back, but "tall and persistent overshooting tops are frequently observed with strong or severe thunderstorms."[5] Over the United States they are common. NASA's DCOTSS project, which flew the ER-2 research aircraft into storm outflow in 2021 and 2022, reports that "during the summer, strong convective storms over North America overshoot the tropopause into the lower stratosphere," that "overshooting tops can reach many kilometers above the tropopause," and that radar data show "on average, there are more than 200 overshooting storms per day over the contiguous U.S.," most of them on the High Plains. They carry water and pollutants into the normally very dry stratosphere.[12] The tornado lesson shows the storms that do it.
The stratosphere and ozone
The stratosphere extends "from the top of the troposphere (the tropopause), at heights of roughly 10–17 km, to the base of the mesosphere (the stratopause), at a height of roughly 50 km." It "is characterized by constant or increasing temperatures with increasing height and marked vertical stability. It owes its existence to heating of ozone by solar ultraviolet radiation."[5] The ozone layer, the AMS's ozonosphere, runs from about 15 to 60 km; the ozone concentration "peaks at about 10¹³ molecules per cubic centimeter near 20 km, while the mixing ratio peaks at slightly higher altitude (about 9–10 ppm at 30 km)." By absorbing ultraviolet light it limits what reaches the ground "to wavelengths longer than 290 nm."[5]
An ozonesonde is an ozone sensor flown on a weather balloon together with a radiosonde, measuring ozone as it rises. NOAA's Global Monitoring Laboratory launches them from Boulder, Colorado. The flight below shows the two halves of the story side by side: where the ozone is, and where the air warms.
Table: Boulder ozonesonde, 17 UTC July 15, 2026, every 2 km
| Height, km | Pressure, hPa | Temperature, °C | Ozone, mPa | Ozone, ppmv |
|---|---|---|---|---|
| 1.7 | 830.5 | 26.4 | 4.77 | 0.057 |
| 2 | 806.4 | 21.3 | 4.87 | 0.06 |
| 4 | 637 | 9.1 | 3.93 | 0.062 |
| 6 | 496.7 | -5.1 | 2.88 | 0.058 |
| 8 | 382.6 | -18.8 | 3.76 | 0.098 |
| 10 | 290.4 | -31.2 | 2.62 | 0.09 |
| 12 | 217.3 | -44.1 | 0.97 | 0.045 |
| 14 | 159.9 | -58.7 | 0.51 | 0.032 |
| 16 | 115 | -69.9 | 0.84 | 0.073 |
| 16.5 | 105.8 | -72.2 | 0.89 | 0.084 |
| 18 | 82.3 | -67.8 | 5.07 | 0.617 |
| 20 | 59.3 | -64.5 | 8.07 | 1.361 |
| 22 | 43.1 | -54 | 13.11 | 3.044 |
| 24 | 31.5 | -53.9 | 13.76 | 4.364 |
| 25.3 | 25.8 | -48.4 | 14.83 | 5.755 |
| 26 | 23.2 | -48.1 | 14.59 | 6.29 |
| 28 | 17.2 | -44.3 | 12.58 | 7.326 |
The ozone here is plotted as partial pressure, the share of the air's pressure due to ozone. By volume, the same flight measured 0.057 parts per million of ozone at the ground and 8.8 at 29.3 km, 150 times as much, in line with the AMS's 9 to 10 ppm near 30 km. The number of ozone molecules per cubic centimeter peaked at 4.8 × 10¹² at 25.3 km, higher than the AMS's typical 20 km, over a tropopause that was itself 2 km higher than the July 15, 2025 tropopause over Sterling, Virginia, at nearly the same latitude.[11][5]
The stratosphere is nearly cloudless because it is both stable and dry. NASA calls it "nearly cloud- and weather-free," with polar stratospheric clouds "sometimes present in its lowest, coldest altitudes," and notes that it is "the highest part of the atmosphere that jet planes can reach."[6] The ER-2 that sampled the storm plumes above flies as high as 70,000 feet, about 21 km, with 96 percent of the atmosphere's mass below it.[12]
The mesosphere
The mesosphere lies "above the stratosphere and extending from the stratopause at about 50 km height to the mesopause at 85–95 km." Its temperature falls with height, "reflecting the decreasing absorption of solar ultraviolet radiation by ozone."[5] It is the least measured layer of the atmosphere, and the AMS says why: it "is too high for balloon operations and too low for satellites to orbit. Rockets, while useful, usually travel too rapidly through the region to produce reliable measurements."[5]
The mesopause at its top "is the site of the coldest temperatures in the atmosphere. Temperatures as low as 100 K (−173°C) have been measured at the mesopause by rockets."[5] The standard atmosphere's value is −86.3 °C, and NASA gives an average of about −85 °C.[4][6] The extreme cold is found over the summer pole, in what the AMS calls "the extreme cold of the summer polar mesopause region," and it is cold enough there for the highest clouds on earth: noctilucent clouds, "thin silvery-blue cirrus-like clouds frequently seen during summer twilight conditions at high latitudes," at about 85 km, made of ice particles "with dimensions of the order of tens of nanometers."[5] The mesosphere is also where "most meteors burn up": its gases are "thick enough to slow down meteors hurtling into the atmosphere."[6][2]
The thermosphere and exosphere
In the thermosphere, "a region of more or less steadily increasing temperature with height, starting at roughly 100 km," the air absorbs the sun's most energetic radiation.[5] JetStream: "incoming high energy ultraviolet and x-ray radiation from the sun begins to be absorbed by the molecules in this layer and causes a large temperature increase."[2]
Table: U.S. Standard Atmosphere, 1976, temperature above 86 km
| Height, km | Temperature, °C | Temperature, K |
|---|---|---|
| 86 | -86.3 | 186.9 |
| 100 | -78.1 | 195.1 |
| 120 | 86.9 | 360 |
| 150 | 361.2 | 634.4 |
| 200 | 581.4 | 854.6 |
| 300 | 702.9 | 976 |
| 400 | 722.7 | 995.8 |
| 500 | 726.1 | 999.2 |
| 600 | 726.7 | 999.9 |
| 700 | 726.8 | 1000 |
| 800 | 726.8 | 1000 |
| 1,000 | 726.8 | 1000 |
The 1,000 K limit belongs to a standard drawn for "moderate solar activity"; JetStream gives thermosphere temperatures that "can reach as high as 3,600°F (2,000°C) near the top." None of it would feel hot. "The high temperature indicates the amount of the energy absorbed by the molecules, but with so few molecules in this layer, the total number would not be enough to heat our skin."[2][4] The air at 86 km already exerts less than four millionths of sea-level pressure.
The exosphere is "the outermost, or topmost, portion of the atmosphere," starting at "the critical level of escape, usually located at 500–1000 km." There, "the air density is so low that the mean free path of individual particles depends upon their direction with respect to the local vertical, being greatest for upward moving particles. It is only from the exosphere that atmospheric gases can, to any appreciable extent, escape into outer space."[5] NASA puts most earth satellites in it, and a thin cloud of hydrogen atoms, the geocorona, reaching "nearly 391,000 miles (629,300 kilometers) into space, far beyond the orbit of the Moon."[6]
The ionosphere and the aurora
The ionosphere is not a temperature layer but an electrical one: "the atmospheric region containing significant concentrations of ions and electrons. Its base is at about 70–80 km and it extends to an indefinite height." It is "collocated with the thermosphere and the upper mesosphere," and produced over most of the earth "by the action of solar radiation of short wavelength (extreme ultraviolet and x-ray radiation)."[5] Its regions are lettered from the bottom: the D region below 100 km, the E layer at 100 to 120 km, and the F₁ and F₂ layers above 150 km.[5] The ionosphere was found by radio. In 1901 Guglielmo Marconi sent a signal from Europe to North America that "had to bounce off an electrically conducting layer at about 62 miles (100 km) altitude," later named the E layer. All the layers are denser by day; at night they thin, "with the D-Layer essentially disappearing." Radio waves that bounce between the ionosphere and the ground can travel "for many 1000s of miles."[3]
The aurora glows in the same region. In the AMS definition, aurora "are a result of collisions between atmospheric gases and precipitating charged particles (mostly electrons) guided by the geomagnetic field." "Typical aurora are 100–250 km above ground level. The colors of the aurora are normally both red and green. The red color occurs at heights around 250 km and is due to a specific transition of atomic oxygen; deeper penetrating particles (to around 100 km) interact with molecular nitrogen and oxygen causing green bands."[5] The colors are a view of the layering: the gas that glows, and so the color, "varies with altitude." The aurora forecast maps where it may be seen tonight, and space weather follows the solar activity behind it.[5]
Where space begins
The atmosphere has no top: it thins until the gas is too sparse to behave as a gas. A line is drawn anyway. NASA: "most scientists use a delineation known as the Karman line, located 100 kilometers (62 miles) above Earth's surface, to denote the transition point, since 99.99997 percent of Earth's atmosphere lies beneath this point."[6] The Kármán line sits in the lower thermosphere, just above the mesopause and within the band where the aurora forms. The standard atmosphere computed here agrees with NASA's figure: 99.9996 percent of the mass is already below 86 km.
What is at each height
| What | Height | Layer | Source |
|---|---|---|---|
| Half the atmosphere's mass below | 5.5 km | troposphere | computed, 1976 standard |
| Airliners, typical cruise | 35,000 ft, 10.7 km | upper troposphere or lower stratosphere | NASA DCOTSS[12] |
| Tropopause, standard atmosphere | 11.0 km | boundary | 1976 standard[4] |
| Tropopause, tropics and subtropics, measured | 15.7 to 17.5 km | boundary | computed, soundings above |
| ER-2 research aircraft, ceiling | 70,000 ft, 21.3 km | stratosphere | NASA DCOTSS[12] |
| Ozone concentration, peak | near 20 km | stratosphere | AMS[5] |
| Weather balloons burst | above 35 km | stratosphere | NWS[13] |
| Stratopause | about 50 km | boundary | AMS, 1976 standard |
| Meteors burn up | 50 to 85 km | mesosphere | NASA, JetStream[6][2] |
| Noctilucent clouds | about 85 km | upper mesosphere | AMS[5] |
| Kármán line | 100 km | thermosphere | NASA[6] |
| Aurora, green to red | 100 to 250 km | thermosphere, ionosphere | AMS[5] |
| International Space Station | about 250 miles, 402 km | thermosphere | NASA[14][6] |
| Base of the exosphere | 500 to 1,000 km | exosphere | AMS[5] |
Whether an airliner at 35,000 feet is in the troposphere or the stratosphere depends on where it is: over San Juan on July 15, 2025 it would have had nearly 6 km of troposphere above it; over Alert it would have been 2 km into the stratosphere. NASA: "Most aviation takes place here, including in the transition region between the troposphere and the stratosphere."[6]
Check yourself
-
Name the five layers of the atmosphere from the ground up, and say whether temperature rises or falls with height in each of the first four.
Answer
Troposphere (falls), stratosphere (steady, then rises), mesosphere (falls), thermosphere (rises), then the exosphere, where the gas escapes to space.
-
Roughly what share of the atmosphere's mass lies below the height of a typical airliner cruising at 35,000 feet?
Answer
About three quarters: 76 percent in the standard atmosphere. Half lies below 5.5 km, the height of the 500 hPa level.
-
Surface air over San Juan was 21 °C warmer than over Alert on July 15, 2025. Which place had the colder tropopause, and why?
Answer
San Juan, at −76.2 °C against −45.5 °C. Both columns cooled at about 6 °C per kilometer, but San Juan's troposphere was twice as deep, 16.5 km against 8.4 km, so it cooled for twice as long.
-
Why does the stratosphere stop thunderstorms from growing taller?
Answer
Its temperature is steady or rising with height, so air pushed up into it becomes colder and denser than its surroundings and sinks back. Updrafts stop near the tropopause and spread into an anvil; only the strongest overshoot it, briefly.
-
What heats the stratosphere, and what heats the thermosphere?
Answer
Ozone absorbing ultraviolet sunlight heats the stratosphere. The thermosphere is heated by the sun's extreme ultraviolet and x-ray radiation, absorbed by the thin gas there.
-
The thermosphere can be hotter than 700 °C. Why would it not feel hot?
Answer
Temperature measures the energy of each molecule, but there are so few molecules that together they carry almost no heat. At 86 km the pressure is already less than four millionths of that at sea level.
-
On January 15, 2025 the tropopause was at 17.1 km over Charleston and 10.1 km over Sterling, Virginia. What lay between them?
Answer
The subtropical jet stream and the tropopause break: the step between the high tropical tropopause and the lower one to the north. The jet over Charleston that morning blew at 158 knots.
-
At what heights do auroras glow, and which layer are they in?
Answer
Typically 100 to 250 km, green lower down and red higher up: the thermosphere, in the ionosphere.
Video


Methods
The standard atmosphere is computed from the defining constants and equations of the U.S. Standard Atmosphere, 1976 (tables 3 to 5 and equations 23 to 32): seven linear segments of temperature against geopotential height from 288.15 K at sea level to 84.852 geopotential km, then an isothermal layer to 91 km, an elliptical segment to 110 km, a linear one to 120 km and an exponential approach to 1,000 K. Heights are converted to geometric heights with the standard's earth radius of 6,356.766 km. Below 86 km temperature is taken as the molecular-scale temperature; the standard's own correction between 80 and 86 km is under 0.04 percent. Pressure is integrated hydrostatically to 86 km and reproduces the standard's published base pressures (22,632 Pa at 11 geopotential km, 0.3734 Pa at 84.852). The share of mass below a height is one minus the ratio of the pressure there to sea-level pressure, which neglects the small decrease of gravity with height.
Soundings are the University of Wyoming's high-resolution records, thinned to one level per
50 m of height; heights are the archive's geopotential heights above sea level. The
tropopause is the lowest level above 500 hPa that meets the WMO (1957) definition, tested
against every level within the following 2 km; a flight that ends less than 2 km above a
candidate is not given one there. The ozonesonde is NOAA's 100 m averaged file for Boulder
flight BU1188, with its tropopause found the same way. The code and data are in the site's
repository, under scripts/learn/.
Related
The next lesson in the unit, Air pressure, explains why pressure falls with height and what a barometer reads. Air parcels and adiabatic cooling explains why rising air cools, and How to read a skew-T shows the troposphere and the base of the stratosphere as a forecaster reads them, with the storm top near the tropopause. The aurora and space weather pages follow the upper atmosphere live. Unfamiliar terms are in the glossary.
Sources
Quotations are verbatim from the source named. Figures marked "computed here" are described under Methods.
- NOAA JetStream, The Atmosphere, including the tables of dry air and of air with water vapor. Last updated July 2, 2024.
- NOAA JetStream, Layers of the Atmosphere. Last updated February 17, 2026.
- NOAA JetStream, The Ionosphere.
- NOAA, NASA and U.S. Air Force, U.S. Standard Atmosphere, 1976, NOAA-S/T 76-1562 (NASA TM-X-74335), 1976: section 1.0 and 1.2 (introduction and defining constants), tables 3 to 5, and equations 23 to 32.
- American Meteorological Society, Glossary of Meteorology, entries atmosphere, homosphere, heterosphere, troposphere, tropopause (edited July 24, 2026), stratosphere, ozonosphere, overshooting top, mesosphere, mesopause, noctilucent clouds, thermosphere, exosphere, ionosphere and aurora.
- NASA Science Editorial Team (Alan Buis), Earth's Atmosphere: A Multi-layered Cake, October 2, 2019, updated October 22, 2024.
- NASA Johnson Space Center, Earth Science and Remote Sensing Unit, Sunset Seen from the International Space Station, June 13, 2010: astronaut photograph ISS023-E-57948, May 25, 2010, via Wikimedia Commons, public domain. Cropped here.
- NOAA Global Monitoring Laboratory, Global annual mean carbon dioxide, 2025 value.
- Dian J. Seidel, Rebecca J. Ross, James K. Angell and George C. Reid, Climatological characteristics of the tropical tropopause as revealed by radiosondes, Journal of Geophysical Research 106 (D8), 7857 to 7878, 2001: the abstract, the introduction (history and the WMO 1957 definition) and section 3.
- University of Wyoming, Department of Atmospheric Science, upper-air soundings, 12 UTC January 15 and July 15, 2025: Grantley Adams, Barbados (78954); San Juan, Puerto Rico (78526); Miami, Florida (72202, January only); Charleston, South Carolina (72208); Sterling, Virginia (72403); Albany, New York (72518); Caribou, Maine (72712); Kuujjuaq, Quebec (71906); Iqaluit, Nunavut (71909); Alert, Nunavut (71082).
- NOAA Global Monitoring Laboratory, Boulder, Colorado ozonesonde profiles, flight BU1188, launched 17:19 UTC July 15, 2026, 100 m averages; PI Bryan Johnson.
- NASA Earth Venture Suborbital project, Dynamics and Chemistry of the Summer Stratosphere (DCOTSS), overview.
- National Weather Service, Radiosonde Observation, upper-air fact sheet.
- NASA, What Is the International Space Station?
- Met Office - Learn About Weather, What are the layers of the atmosphere?, YouTube.
- NASA Video, NASA Now: Earth's Atmosphere: Earth Science Week, YouTube.
- NASA Science, NASA ScienceCasts: Understanding the Outer Reaches of Earth's Atmosphere, YouTube.

Corrections: contact@weatherovertime.com.
Unit 1: The atmosphere
- Layers of the atmosphere
Troposphere to thermosphere, and why weather happens in the lowest layer.
- Air pressure
What pressure is, how it is measured, and why it falls with height.
- Temperature and heat
How the sun heats the ground, the ground heats the air, and the day warms and cools.
- Dew point and humidity
Why dew point, not relative humidity, is the number forecasters watch.
- How clouds form and how to name them
Condensation, cloud bases, and the ten cloud genera.