About WeatherOverTime
WSR-88D radar at full resolution, live and archived to 1991. Free, without an account or advertising.
Level II data
Most radar sites display Level III: a reduced, smoothed product derived from the original scan and distributed at a fraction of the size. This site displays Level II, the radar's output before that reduction.
- Resolution. A sample every 250 m along the beam, at 0.5° azimuth spacing, and 0.25° on the lowest elevations.
- All elevations. Every angle in the volume scan, which allows the vertical structure of a storm to be examined rather than only its base.
- All products. Reflectivity, velocity, spectrum width, correlation coefficient, differential reflectivity and differential phase.
- Archive. Any date and time to 1991, at the resolution it was recorded.
The products
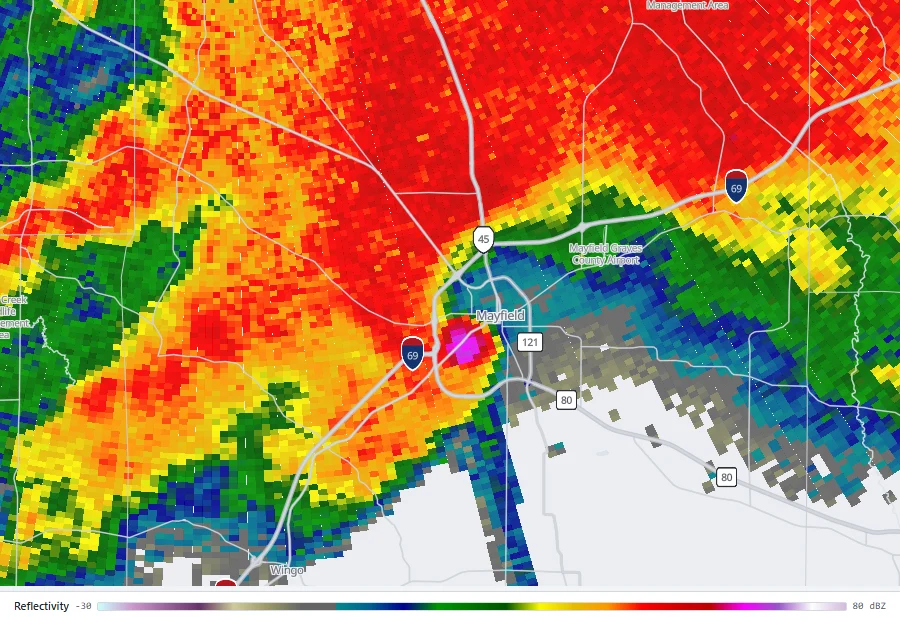
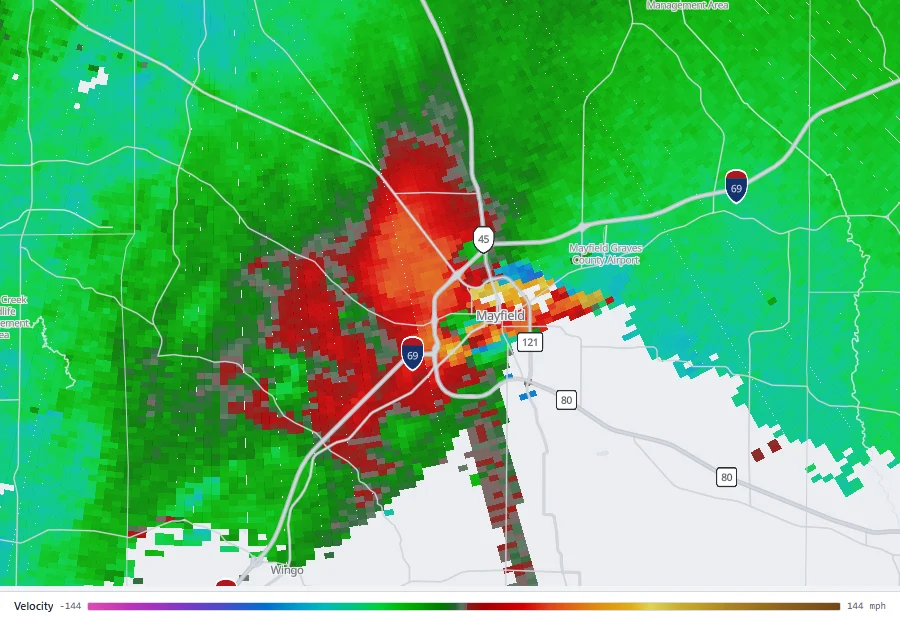
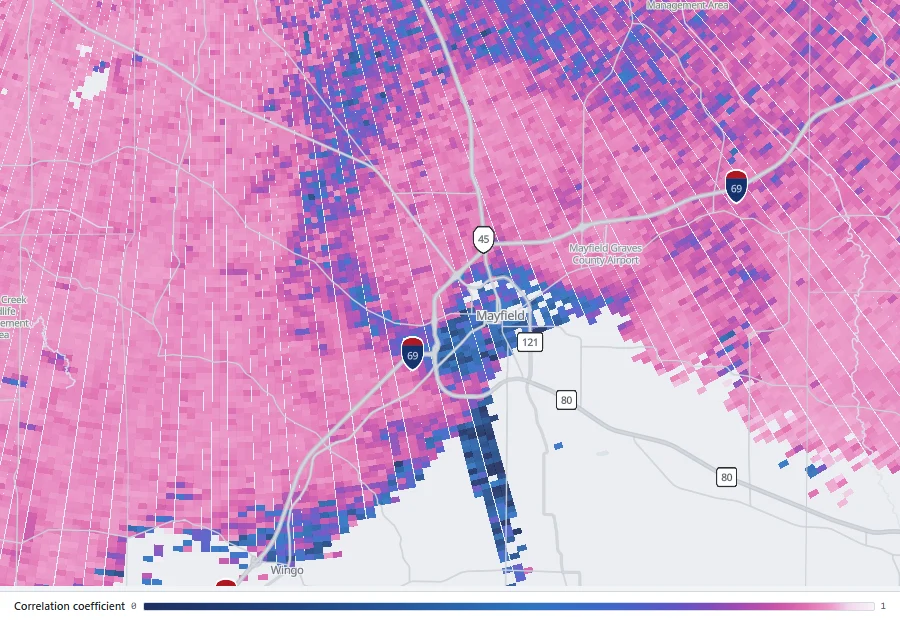
The scans below are from KPAH at 0.5° elevation on 11 December 2021, as the Mayfield, Kentucky tornado moved through the town. Reflectivity and velocity are separate passes of the same rotation, seconds apart.
Reflectivity
Power returned by precipitation, in dBZ. Higher values indicate heavier precipitation or larger particles. Values above roughly 60 dBZ generally indicate hail.
Velocity
Motion along the beam, toward or away from the antenna. Adjacent maxima of opposite sign indicate rotation. A tight, intense pair at low elevation is the radar signature of a tornado.
Correlation coefficient
How consistently the targets within one sample volume scatter energy. Rain and snow are uniform and read near 1. A sharp, localised drop indicates a mixture of sizes and shapes, most often lofted debris.
Differential reflectivity
The difference between power returned in the horizontal and vertical polarisations, which indicates the shape of what the beam is hitting. Raindrops flatten as they fall and read positive. Hail has no preferred orientation and reads near zero.
Data sources
All of it is public data. This site decodes it and renders it.
- Radar from NOAA and the National Weather Service
- Warnings and outlooks from the Weather Service and the Storm Prediction Center
- Satellite imagery from NASA
- Forecast model output from the Iowa Environmental Mesonet
- Maps from OpenStreetMap
Limitations
This is not a warning service. Radar depicts conditions measured minutes earlier, at an altitude that increases with distance from the antenna. Beyond roughly 100 miles the beam overshoots much of a storm entirely.
For decisions about your safety, follow the National Weather Service and your local emergency management. Warnings appear on the map here as context, not as an issued product.
Open the radar · Search the archive by date and time · Contact