How clouds form and how to name them
- Read first
- Dew point and humidity
- Key terms
- Cloud, Condensation, Saturation, Supersaturation, Cloud condensation nuclei, Cloud drop, Raindrop, Supercooled water, Ice nucleus, Bergeron process, Cloud seeding, Orographic lift, Advection fog, Cloud genus, Mammatus, Virga, Shelf cloud, Wall cloud, Ceilometer, Okta, METAR, Ceiling, Contrail, Schmidt-Appleman criterion
A cloud is water made visible: vapor that has condensed onto specks of dust, salt and smoke into droplets too small to fall, or frozen into ice crystals. Clouds are also the most readable weather instrument there is. Their height, shape and texture say how the air is moving, how moist and how stable it is, and what is likely to happen next. This lesson covers how clouds form, from the particles every droplet needs to the four ways air is lifted; how they are named, from the ten genera of the World Meteorological Organization's International Cloud Atlas to the features added in 2017; and how they are observed and reported, with a real aviation report decoded and ten years of hourly sky observations from three American airports.
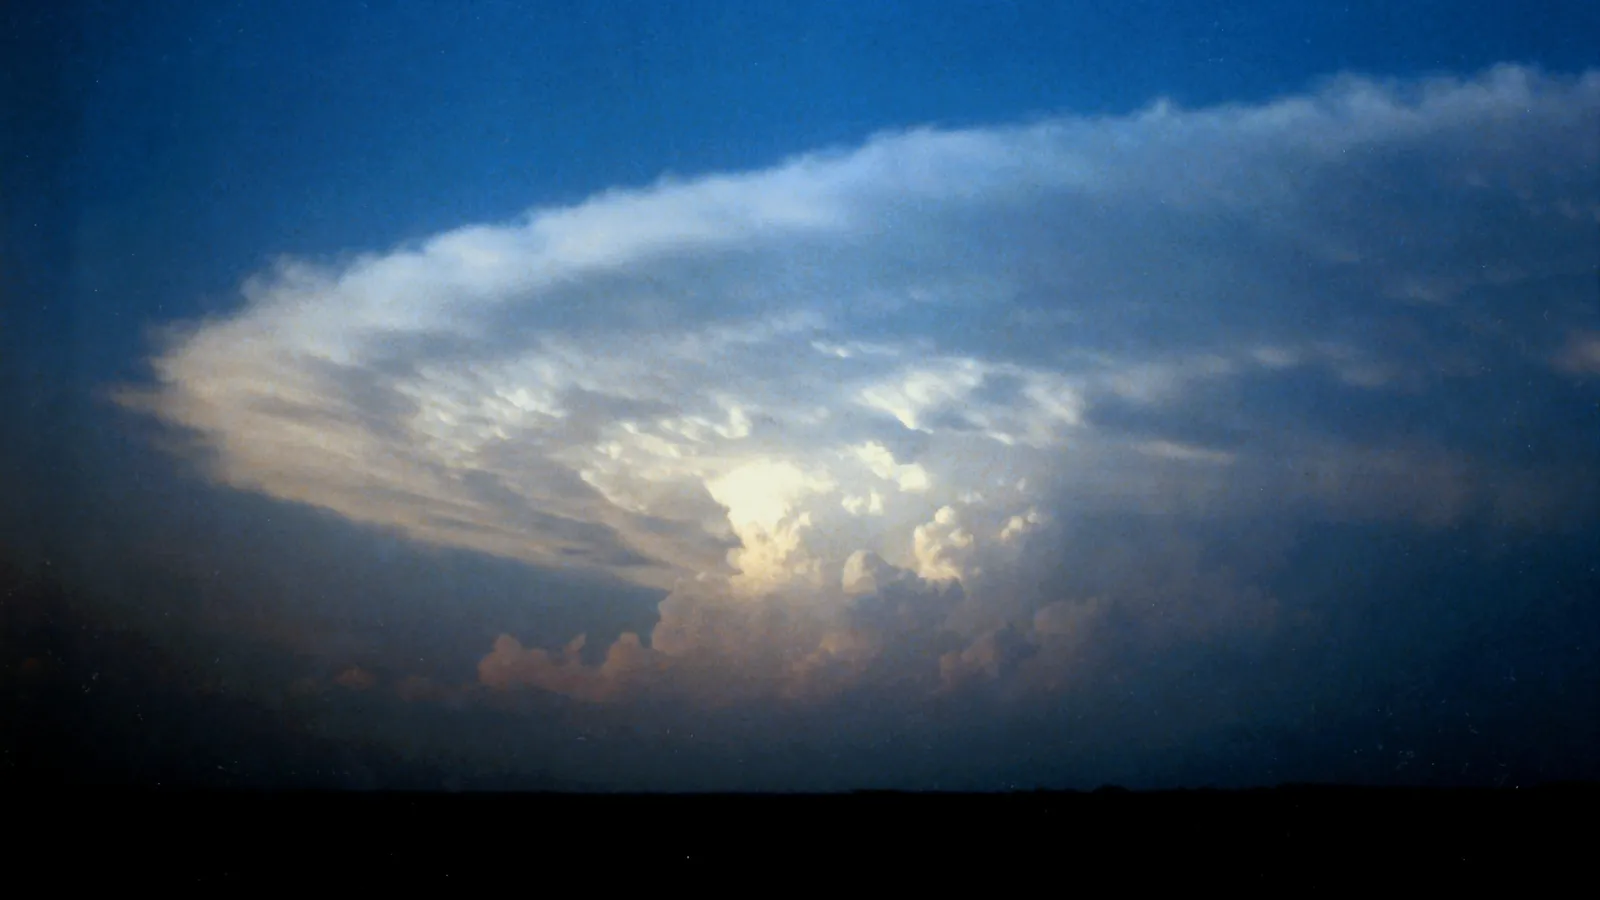
- What a cloud is, and why air needs both saturation and particles to make one.
- Cloud condensation nuclei, how many there are over oceans and continents, and the sizes of cloud drops and raindrops.
- Supercooled water and ice, and how ice starts rain and snow.
- The four ways air is lifted, and the ways it saturates without rising.
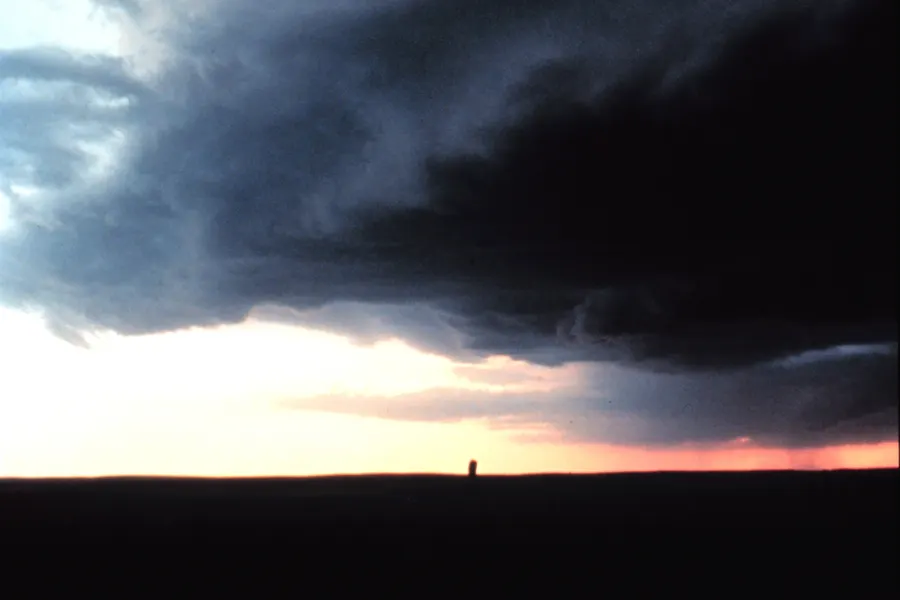
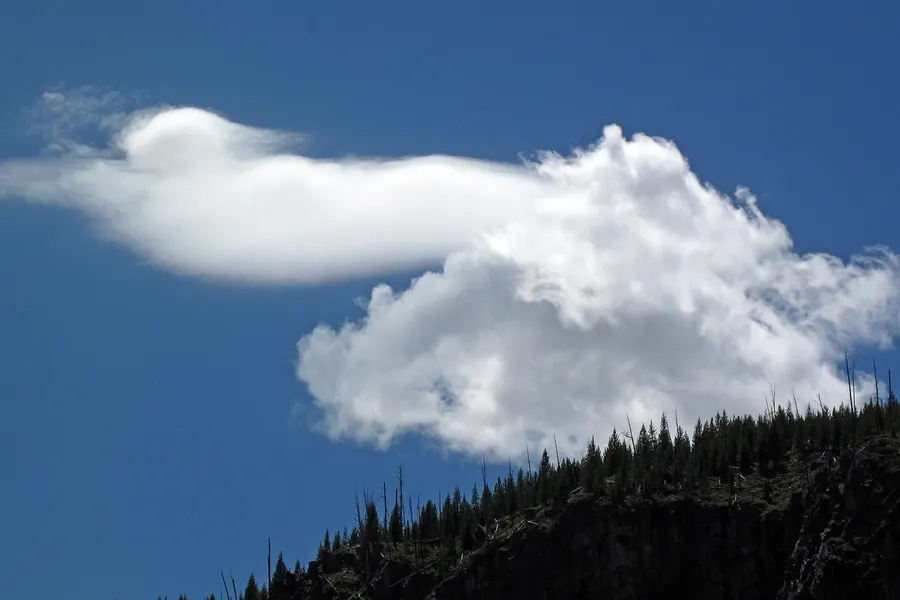
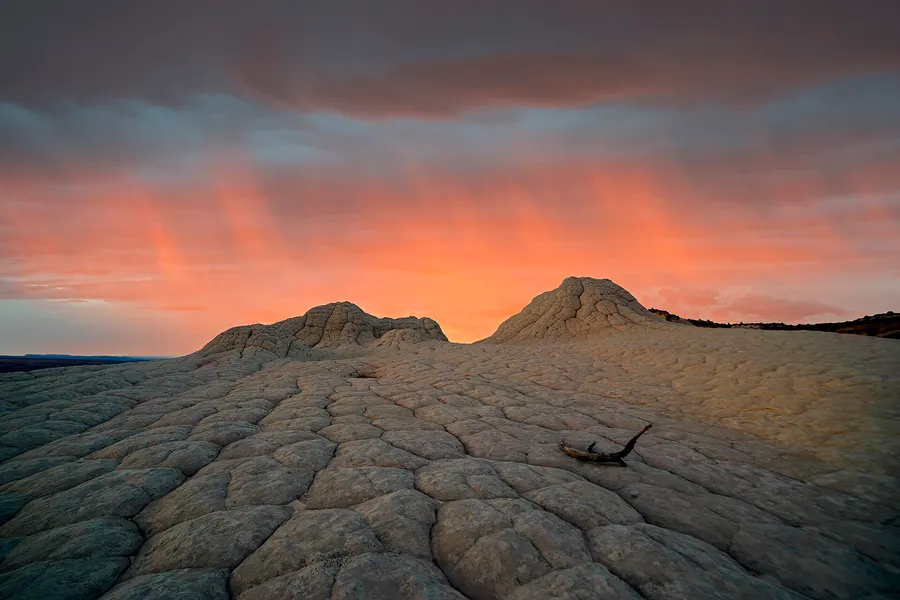
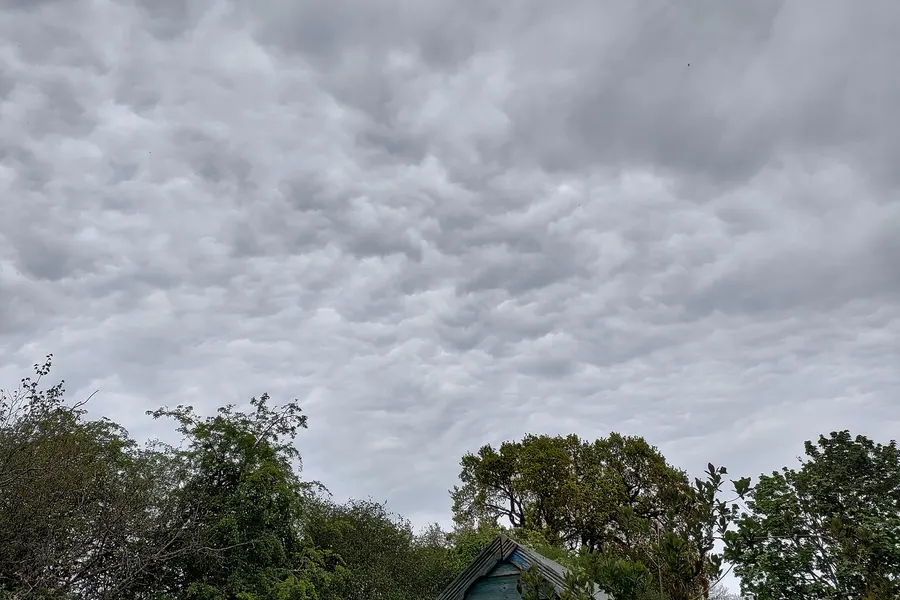
- The International Cloud Atlas: three levels, ten genera, species, varieties, supplementary features and accessory clouds, with a photograph of each genus.
- Observing clouds: the ceilometer, oktas, METAR sky condition and ceilings, and what ten years of reports show.
- Contrails, clouds seen from space, and clouds that rotate.
What a cloud is
The World Meteorological Organization's International Cloud Atlas, the world standard for naming clouds, defines a cloud as "a hydrometeor consisting of minute particles of liquid water or ice, or of both, suspended in the atmosphere and usually not touching the ground." It may also hold larger drops and ice, and "non-aqueous liquid or solid particles such as those present in fumes, smoke or dust."[1] The American Meteorological Society's glossary puts it more briefly: "A visible aggregate of minute water droplets and/or ice particles in the atmosphere above the earth's surface." It adds that a cloud "differs from fog only in that the latter is, by definition, close (a few meters) to the earth's surface."[2]
Two ingredients are needed, and the National Weather Service's JetStream school names them in its first sentence on the subject: "There are two ingredients needed for clouds to form: water and nuclei."[3] The water must be at saturation, and there must be particles for it to condense on. The next three sections take them in turn; the rest of the lesson is about the motions that produce saturation and the shapes that result.
Saturation
Air is saturated when its vapor pressure equals "the equilibrium vapor pressure over a plane surface of pure liquid water, or sometimes ice," in the AMS definition: the point at which a flat water surface would neither gain nor lose water.[2] The temperature at which air reaches it by cooling is its dew point, the subject of Dew point and humidity.
The AMS entry on condensation gives the two routes to it: "cooling of air to its dewpoint, or addition of enough water vapor to bring the mixture to the point of saturation (that is, the relative humidity is raised to 100 percent)." Nearly every cloud forms by the first. The same entry adds a condition that is easy to miss: "condensation ensues only if condensation nuclei or other surfaces are present. In the complete absence of such, condensation does not occur at nominal saturation."[2]
The reason is surface tension. A droplet that forms from vapor alone must create a new surface, and for a droplet only a few molecules across the energy cost is too high: in the AMS's words, spontaneous formation "is opposed by the surface free-energy increase that attends the creation of new surfaces," and "only for extreme supersaturation does this free-energy balance swing in favor of spontaneous nucleation." How extreme is measured in the laboratory. "Humid air, purified of all foreign nuclei, can be expanded in cloud chambers to relative humidities of the order of 400% without any condensation taking place. Cloud condensation occurs in our atmosphere at relative humidities near 100% only because nature provides an abundance of condensation nuclei."[2] A relative humidity above 100 percent is called supersaturation. In forming clouds it is small: the AMS puts the supersaturations "typical of atmospheric cloud formation" at a "fraction of one to a few percent."[2]
Condensation nuclei
Cloud condensation nuclei, CCN, are "hygroscopic aerosol particles that can serve as nuclei of atmospheric cloud droplets, that is, particles on which water condenses (activates) at supersaturations typical of atmospheric cloud formation."[2] JetStream lists what they are: "smoke from fires or volcanoes, ocean spray, or tiny specks of wind-blown soil," so that "every cloud droplet has a speck of dirt, dust, or salt crystal at its core."[3]
Hygroscopic means water-attracting. Salt particles take up water before the air is saturated at all: the AMS gives the threshold for sodium chloride, the salt of sea spray, as "about 76%" relative humidity, below which the particles stay dry. Particles that are merely wettable need "relative humidity of nearly 100%."[2] That is why haze thickens on humid days before any cloud forms: the particles are already swelling with water.
Not every particle becomes a droplet. The smaller a particle, the higher the supersaturation it needs, so the number of CCN is always quoted at a stated supersaturation. In clean air over the Amazon, particles larger than about 85 nanometers (0.085 micrometers) activate at 0.4 percent supersaturation, according to a review by Meinrat Andreae of the Max Planck Institute for Chemistry.[6] That review gathered CCN measurements made around the world at the same supersaturation, and the averages differ by more than an order of magnitude.
- Clean air, average of studies
- Polluted air, average of studies
- One standard deviation either side
Table: CCN at 0.4% supersaturation, per cm³
| Environment | Average of studies | Standard deviation |
|---|---|---|
| Remote ocean | 107 | 56 |
| Remote land | 200 | 90 |
| Polluted ocean | 1,060 | 400 |
| Polluted land | 2,900 | 2,800 |
In the review's summary, "in remote marine regions, CCN0.4 ... are around 110 cm−3," while "over remote continental areas, CCN are almost twice as abundant," and "over polluted marine and continental regions, the CCN concentrations are about one order of magnitude higher than over their remote counterparts." Over the Southern Ocean in winter they fall to "a few tens per cm3."[6] Andreae cautions that the land and ocean contrast is partly a pollution contrast: "even remote continental sites are in closer proximity to pollution sources than remote marine sites."[6]
The count matters because a cloud shares its water among its droplets. The same amount of condensed water spread over ten times as many nuclei makes ten times as many droplets, each smaller. Clean maritime clouds therefore have fewer, larger droplets that grow into rain more readily; polluted continental clouds have many small ones.
Cloud drops and raindrops
A cloud drop is, in the AMS definition, "a spherical particle of liquid water, from a few micrometers to a few tens of micrometers diameter, formed by condensation of water vapor on a hygroscopic aerosol particle." The glossary suggests 0.2 mm "as an upper limit to the size of drops that shall be regarded as cloud drops; larger drops fall rapidly enough so that only very strong updrafts can sustain them."[2] A raindrop is larger than 0.5 mm; between the two are drizzle drops. "A typical raindrop might have a diameter of 1–2 mm, while a typical cloud drop diameter is of the order of 0.01–0.02 mm."[2]
- Typical size
- Upper limit of a cloud drop, 0.2 mm
Table: sizes and fall speeds
| Particle | Diameter | Typical | Fall speed |
|---|---|---|---|
| Smallest particle that activates at 0.4% supersaturation, clean Amazon air | 0.085 µm | ||
| Cloud drop | 1 to 100 µm | 10 to 20 µm | 0.3 to 1.2 cm/s (computed here) |
| Drizzle drop | 0.2 to 0.5 mm | about 0.7 m/s at 0.2 mm | |
| Raindrop | over 0.5 mm, up to 5 to 8 mm | 1 to 2 mm | 2 to 12 m/s |
Size decides how fast a drop falls. Drops of the drizzle limit, 0.2 mm, fall "about 0.7 m s−1," fast enough to survive a few hundred meters below the cloud, and raindrops "fall between 2 and 12 meters per second."[2] A cloud drop of 0.02 mm, by Stokes' law for small spheres, falls about 1.2 cm per second, and one of 0.01 mm about 3 mm per second (computed here). The gentlest updraft holds such drops up, and any that sink out of the cloud evaporate almost at once. That is why a cloud floats and why most clouds never rain.
Volume goes as the cube of the diameter, so a raindrop 2 mm across holds the water of (2 / 0.02)³ = 1,000,000 cloud drops of 0.02 mm (computed here). Condensation alone is far too slow to build drops that size. Rain forms in one of two ways. In warm clouds, the larger droplets fall slightly faster than the rest, collide with them and merge. In clouds colder than 0 °C, ice does the work, the subject of the next section. The AMS notes that raindrops "may form by coalescence of cloud drops or from melting ice precipitation."[2]
Supercooled water and ice
Cloud droplets do not freeze at 0 °C. Supercooled water is "liquid water at temperatures below the nominal freezing point of pure water," and the AMS notes that cloud droplets "often remain liquid for a long time at temperatures below 0°C," with a freezing temperature that "may be as low as several tens of degrees below 0°C."[2] Pure droplets freeze on their own only when very cold. A study of ice nuclei by Paul DeMott and colleagues states the two routes: "homogeneous freezing of liquid particles below about −36 °C and heterogeneous ice nucleation, triggered by 'ice nuclei' that possess surface properties favorable to lowering the energy barrier to crystallization."[7]
Ice nuclei are scarce. DeMott's group writes that they generally represent "only 1 in 105 of ambient particles in the free troposphere."[7] So between 0 and about −36 °C a cloud is usually a mixture: many supercooled droplets and few ice crystals. The AMS glossary classifies the genera the same way: "only cirrostratus and cirrus are always ice-crystal clouds; cirrocumulus can also be mixed; and only cumulonimbus is always mixed."[2] Supercooled droplets are also what makes aircraft icing: they freeze on contact with a wing.
How ice makes precipitation
In a mixed cloud the ice wins. Saturation over ice is reached at a lower vapor pressure than over liquid water at the same temperature, so air that is just saturated for the droplets is supersaturated for the crystals. The crystals grow by taking up vapor, and the droplets evaporate to replace it. This is the Bergeron process (Bergeron–Findeisen, or Wegener–Bergeron–Findeisen): "the ice crystals would gain mass by vapor deposition at the expense of the liquid drops that would lose mass by evaporation. Upon attaining sufficient weight, the ice crystals would fall as snow." The AMS gives the timescale: crystals grow "at a rate (maximum at about −12°C) to give individual snow crystals in some 10 to 20 minutes." The process needs "numerous small water drops that are supercooled, which is a common feature in clouds between about 0° and −20°C or below, along with a small number of ice crystals."[2]
Snow formed this way melts into rain if the air below is warm enough. The Cloud Atlas describes the same process turning a growing cumulus into a cumulonimbus: "The ice crystals grow at the expense of evaporating supercooled water droplets, transforming the cloud into Cumulonimbus."[1] It is also the basis of cloud seeding, which adds agents such as silver iodide or dry ice "to induce the phase transition from a supercooled water cloud to one composed partially or entirely of ice."[2]
Four ways to lift air
"Air can reach the point of saturation in a number of ways," JetStream says. "The most common way is through air rising from the surface up into the atmosphere and cooling."[3] Rising air expands and cools at about 9.8 °C per kilometer until it saturates at its lifted condensation level, the cloud base. Why it cools, how the base is computed from a surface temperature and dew point, and how well that computation matches nearly 14,000 reported cloud bases are in Air parcels and adiabatic cooling. This section is about what makes the air rise in the first place.
The Federal Aviation Administration's Aviation Weather Handbook names "four of the most common types of vertical motion": "orographic effects, frictional effects, frontal lift, and buoyancy."[4]
- Buoyancy (convection)
- Ground heats unevenly: "A newly plowed field will warm faster than an adjacent lake." Air over the warmer ground becomes less dense and rises in thermals, and "the denser cool air will tend to push (i.e., lift) the less dense warm air aloft."[4] The result is cumulus, which JetStream says "appears in the morning, grows, and then more or less dissolves again toward evening."[3]
- Orographic lift
- Orographic lifting is "ascending air flow caused by mountains," either by the flow being forced up and over a barrier or by daytime heating of the slopes.[2] The Cloud Atlas notes that "hilly areas are often cloudier than nearby lower land," and that clouds "thin out and dissipate on the leeward side," the rain shadow.[1]
- Frontal lift
- At a front, "the cold, denser air wedges under the warm, less dense air, plowing it upward, and/or the warmer air rides up and over the colder air in a process called overrunning."[4] The AMS defines frontal lifting as "the forced ascent of the warmer, less dense air at and near a front."[2]
- Convergence
- Near the ground, friction turns the wind inward toward low pressure. The FAA: "winds converge into surface low pressure, causing the air to rise, expand, and cool, which favors the formation of clouds and precipitation," while winds "diverge away from surface high pressure, causing the air to sink," which clears the sky.[4] The handbook gives sea breezes meeting from opposite directions and the trade winds converging near the equator, in the Intertropical Convergence Zone, as other examples.[4]
The four work together more often than alone. The Cloud Atlas points out that "orographic and thermal lifting often work together to produce tall, vertically developed Cumulus clouds."[1] What the lifted air does next depends on its stability: air that stays cooler than its surroundings spreads into layers, stratus and altostratus, and air that becomes warmer rises on its own into cumulus and cumulonimbus. That is the subject of Lapse rates and stability.
Saturation without lifting
Air can also reach its dew point where it is, by losing heat to a colder surface, and the result is usually fog: a cloud touching the ground. The AMS describes two common kinds. Radiation fog is "produced over a land area when radiational cooling reduces the air temperature to or below its dewpoint," favored by clear skies, light winds and a shallow moist layer under dry air. Advection fog is "caused by the advection of moist air over a cold surface," most commonly "moist air over a cold body of water (sea fog)."[2]
Mixing is the third route. Two unsaturated samples of air, one warm and moist and one cold, can mix into air that is saturated, because the amount of vapor saturated air can hold rises steeply with temperature. The steam of breath on a cold day forms that way, and so do aircraft contrails, described below. Fog, and the lifting of fog into a layer of stratus, has its own lesson later in the course.
Naming clouds: the Cloud Atlas
The names in use today go back to Luke Howard, who in 1803 described a few basic forms and noticed, in JetStream's account, "that clouds often have features of two or more categories, such as cirrus + stratus, cumulus + stratus," and named the combinations.[3] The AMS glossary notes that the classification "in general use, based on a classification system introduced by Luke Howard in 1803, is that adopted by the World Meteorological Organization and published in the International Cloud Atlas."[2] The Atlas's last print volumes date from 1975 and 1987. In 2017 it was revised in full and "for the first time ... configured as a website."[1]
Like the classification of plants and animals, the scheme "uses genera, species and varieties" with Latin names. Its first rule: "The classification of clouds has ten main groups, called genera. Each observed cloud is a member of one, and only one, genus."[1] The genera are grouped by the level at which they are usually found, and the levels depend on latitude, because the troposphere is deeper in the tropics than near the poles.
- Low: stratus, stratocumulus, cumulus, cumulonimbus
- Middle: altocumulus, altostratus, nimbostratus
- High: cirrus, cirrocumulus, cirrostratus
Table: approximate heights of each level
| Level | Polar | Temperate | Tropical | Genera |
|---|---|---|---|---|
| Low | 0 to 2 km | 0 to 2 km | 0 to 2 km | Stratus, stratocumulus, cumulus, cumulonimbus |
| Middle | 2 to 4 km | 2 to 7 km | 2 to 8 km | Altocumulus, altostratus, nimbostratus |
| High | 3 to 8 km | 5 to 13 km | 6 to 18 km | Cirrus, cirrocumulus, cirrostratus |
The Atlas calls the limits approximate and lists the exceptions: "Altostratus is usually found in the middle level, but it often extends higher; Nimbostratus is almost always found in the middle level, but it usually extends into the other two levels; Cumulus and Cumulonimbus usually have their bases in the low level, but their vertical extent is often so great that their tops may reach into the middle and high levels." The levels are an aid to identification: "When the height of a particular cloud is known ... the genus can be determined by making a choice from among the genera normally encountered in the level corresponding to its height."[1]
The names are built from a few Latin roots, given in the Atlas's appendix on etymology: cirrus, "a lock of hair, a tuft of horsehair"; cumulus, "an accumulation, a heap, a pile"; stratus, from a verb meaning "to extend, to spread out, to flatten out"; nimbus, "rainy cloud"; and altum, "height, upper air."[1] JetStream explains that the "alto" of the middle clouds serves "to distinguish these 'higher-level' clouds from their low-level liquid-based counterpart clouds, stratus and cumulus."[3] An apparent size test separates the three genera that look like patches of small elements: cirrocumulus elements are less than 1 degree wide, altocumulus 1 to 5 degrees and stratocumulus more than 5.[1] JetStream gives the practical version: 1 degree is about the width of a little finger held at arm's length, and 5 degrees about three fingers.[3]
The ten genera
The definitions below are the Cloud Atlas's, quoted or closely paraphrased; the notes on composition are from its "physical constitution" sections, and the notes on weather from the FAA handbook's appendix of cloud types and JetStream.[1][3][4]
High clouds
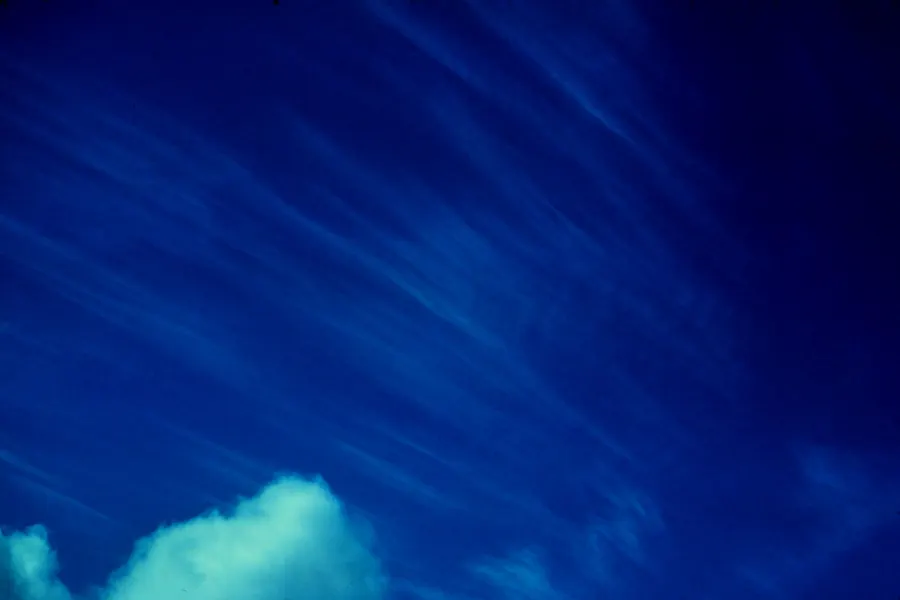
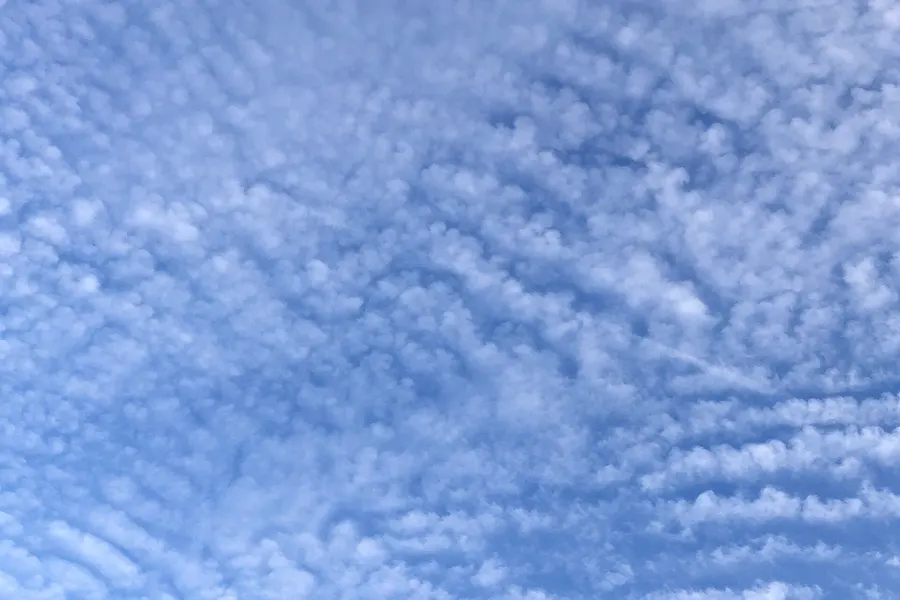
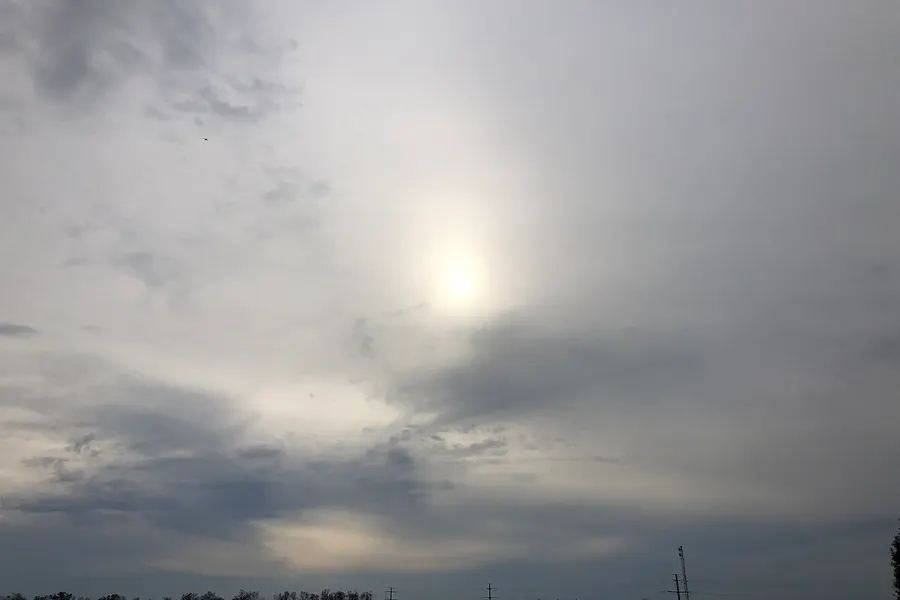
High clouds form in air far below freezing and are made of ice, which is why their edges look fibrous rather than sharp: the Atlas notes that when an altocumulus turns entirely to ice, "its elements cease to present sharp outlines." On their own they bring no weather at the ground. The FAA handbook notes that cirrus "have little effect on aircraft and contain no significant icing or turbulence," "generally occur in fair weather and point in the direction of air movement at their elevation." A halo around the sun or moon marks the ice crystals of cirrostratus, and a veil that keeps thickening is the start of the sequence described under the middle clouds.[1][4]
Middle clouds
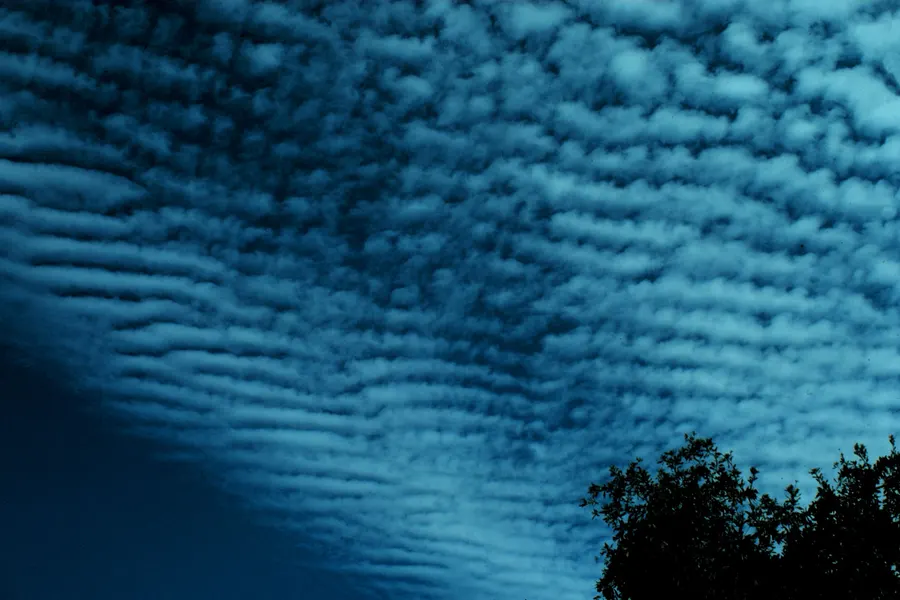
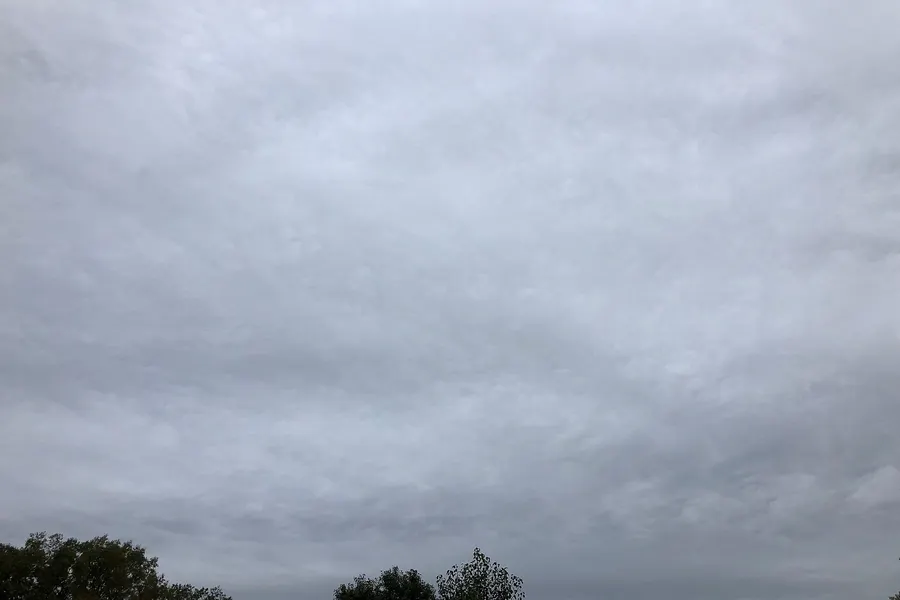
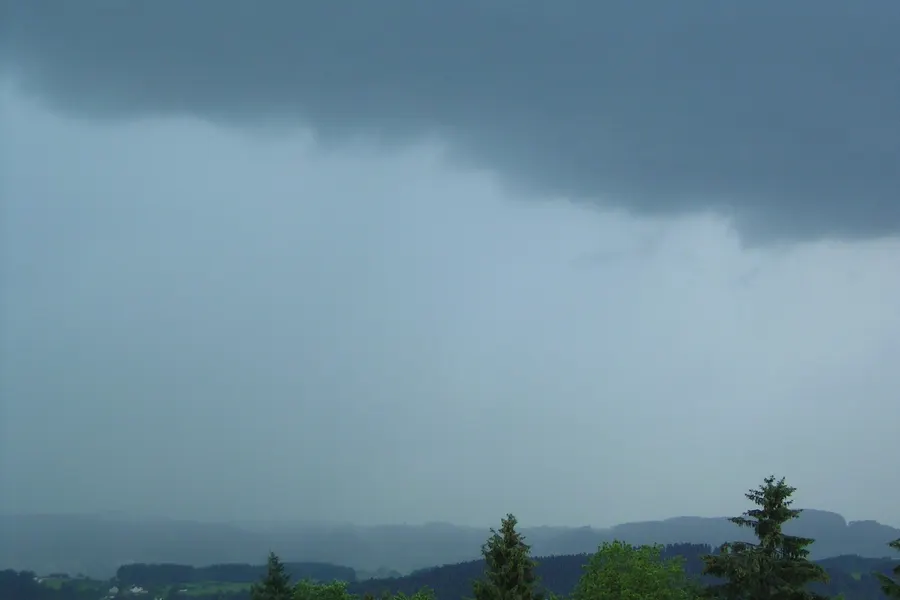
Middle clouds are mostly water droplets, often supercooled, and they tell more. Lens-shaped altocumulus lenticularis marks mountain waves: the FAA handbook calls these clouds "an orographic type of cloud" that "indicate the position of the wave crests." Altostratus usually "evolves from the gradual thickening of a veil of cirrostratus," and "with further thickening of the altostratus and a lowering of its base, the cloud may begin to produce precipitation, at which point it is called nimbostratus." That thickening sequence, a veil of cirrostratus lowering into altostratus and then nimbostratus, is the classic approach of a long spell of rain or snow. Nimbostratus is the cloud of steady precipitation, and "can pose a serious icing problem if temperatures are near or below freezing."[4] It is a middle-level cloud by the Atlas's classification, even though its base often sinks close to the ground in heavy rain.
Low clouds
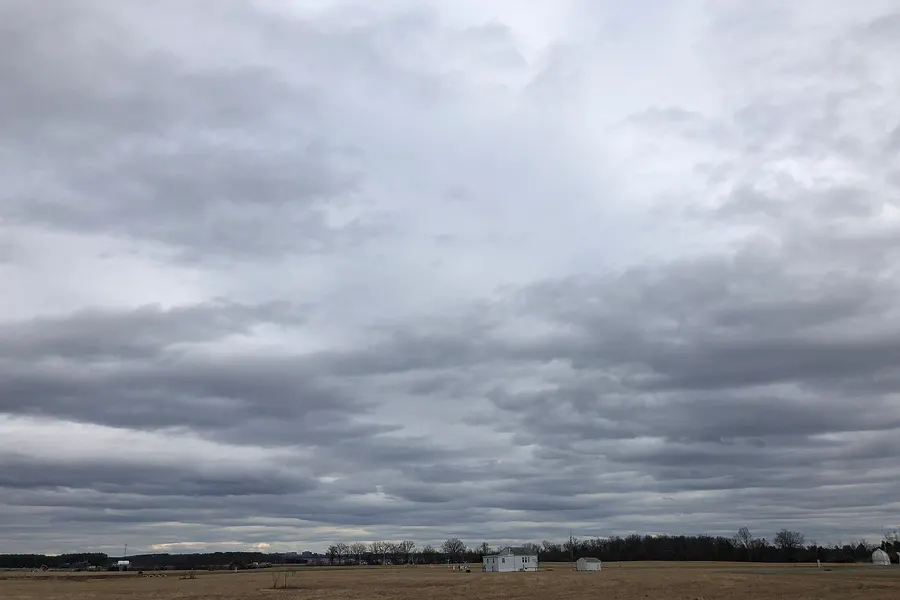
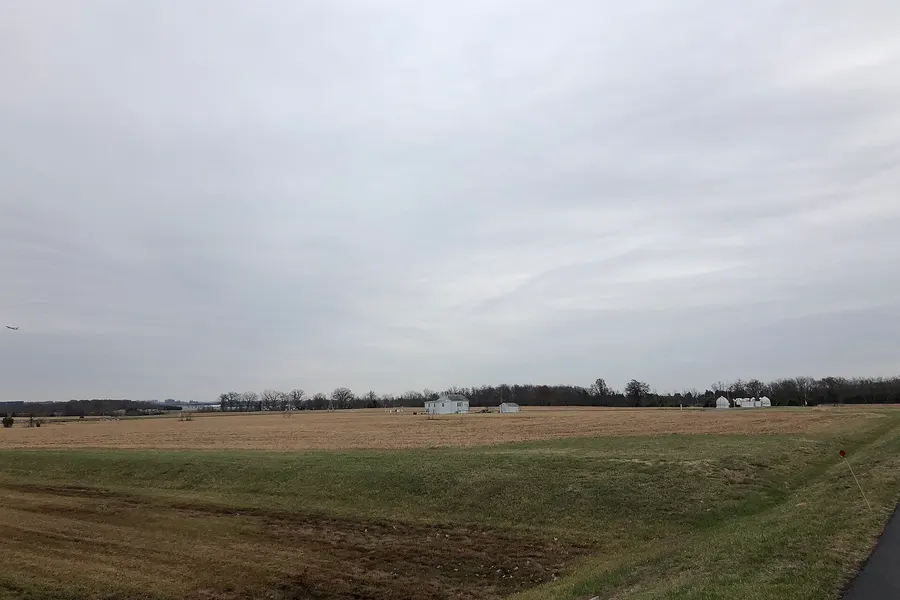
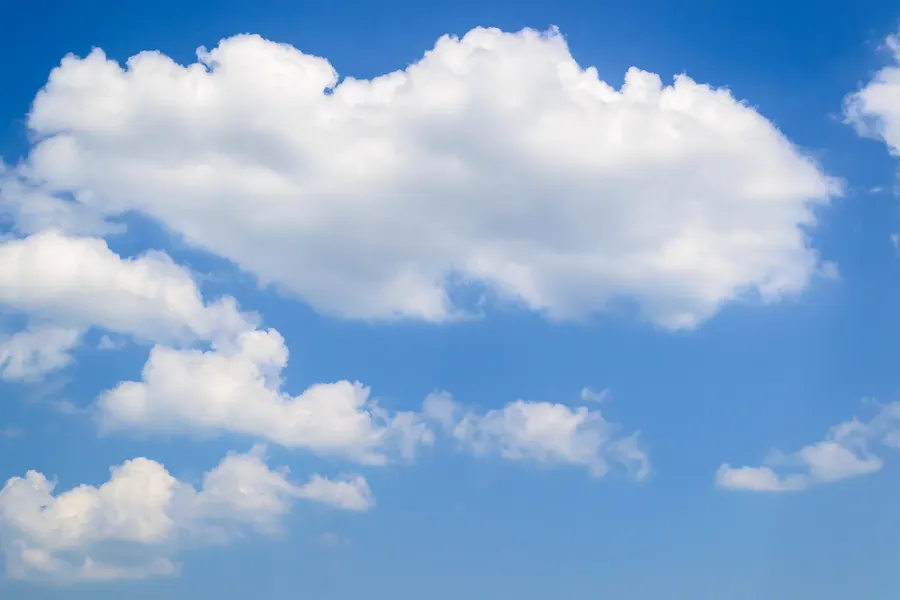
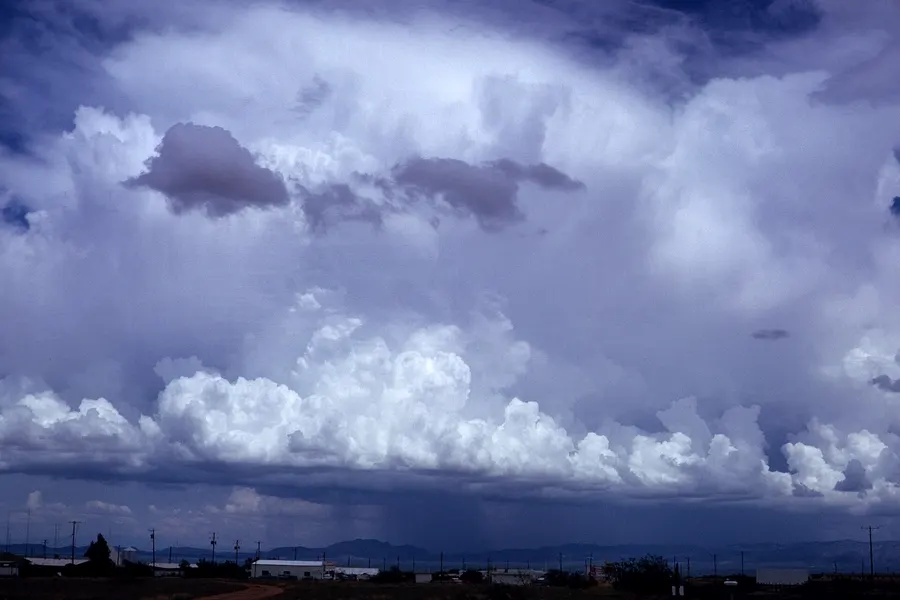
The low clouds divide by stability. Stratus and stratocumulus are layers: they form where moist air is lifted gently or cooled from below under an inversion, and they bring low ceilings, drizzle and poor visibility rather than storms. Stratus often forms when fog lifts: the FAA notes that "fog will often lift into a layer of stratus by an increase in wind or a rise in temperature." Cumulus forms in rising thermals, and its growth tracks the instability of the air. The Atlas's species follow it: humilis, of "only a small vertical extent," which "never produce precipitation"; mediocris, "of moderate vertical extent," with "generally ... no precipitation"; and congestus, "strongly sprouting Cumulus with generally sharp outlines and often great vertical extent," which "may produce precipitation in the form of showers."[1][4] The FAA calls towering cumulus "the first stage of a thunderstorm."[4] Cumulonimbus is the thunderstorm cloud itself; JetStream notes that cumulonimbus clouds "produce hail and tornadoes."[3]
| Genus | Level | Made of | Precipitation | Usually means |
|---|---|---|---|---|
| Cirrus (Ci) | High | Ice | Trails that do not reach the ground | Fair weather; streaks point along the wind at their height |
| Cirrocumulus (Cc) | High | Ice, some supercooled water | None | Some turbulence and icing for aircraft |
| Cirrostratus (Cs) | High | Ice | None | Halo; a thickening veil can lower into altostratus |
| Altocumulus (Ac) | Middle | Water droplets, often supercooled | Virga at most | Lenticularis: mountain waves; some turbulence and icing |
| Altostratus (As) | Middle, often higher | Ice, mixed, water | Light, or virga | Thickening sky before steady rain or snow |
| Nimbostratus (Ns) | Middle, into all levels | Water, snow, rain | Steady rain or snow | Hours of precipitation; icing aloft |
| Stratocumulus (Sc) | Low | Water droplets | Rarely | Gray skies; ceilings usually higher than with stratus |
| Stratus (St) | Low | Water droplets | Drizzle, snow grains | Low ceilings, often lifted fog |
| Cumulus (Cu) | Low base, can grow tall | Water droplets | Showers if congestus | Thermals; towers mean instability |
| Cumulonimbus (Cb) | Low base to high top | Water, ice, hail | Heavy showers, hail | Thunderstorm: lightning, gusts, possible tornadoes |
Sources: level and composition from the Cloud Atlas and the AMS; precipitation and meaning from the Atlas, the FAA handbook and JetStream.[1][2][3][4]
Species, varieties and mother clouds
Below the genus the Atlas adds three kinds of detail. Species describe shape or internal structure, and "a cloud ... may bear the name of only one species." There are fifteen: fibratus, uncinus, spissatus, castellanus, floccus, stratiformis, nebulosus, lenticularis, fractus, humilis, mediocris, congestus, calvus, capillatus and volutus, the roll cloud added in 2017. Varieties describe the arrangement and transparency of the elements, and a cloud can have several: intortus, vertebratus, undulatus, radiatus, lacunosus, duplicatus, translucidus, perlucidus and opacus.[1]
A full name reads from general to particular. "Cumulonimbus capillatus incus" is a cumulonimbus whose top has turned to fibrous ice, the species capillatus, spread into an anvil, the supplementary feature incus. The Atlas describes Cumulonimbus capillatus as "usually accompanied by a shower or by a thunderstorm, often with wind squalls and sometimes with hail." Its companion species, calvus, "bald," is the stage before the top glaciates.[1]
Clouds that grow out of other clouds carry the parent's name with a suffix. When part of a cloud grows into a different genus, it takes "genitus," as in stratocumulus cumulogenitus, stratocumulus formed where cumulus tops spread out under an inversion. When a whole cloud changes genus, it takes "mutatus." The 2017 edition folded clouds with local sources into the same scheme: flammagenitus for clouds grown from the heat of wildfires or volcanoes ("also known by the unofficial, common name, 'pyrocumulus'"), homogenitus for clouds made by human activity, cataractagenitus for cloud from the spray of waterfalls, and silvagenitus for cloud formed from the moisture of forests.[1]
Supplementary features and accessory clouds
The last layer of the classification names things attached to a cloud. Supplementary features are "attached to or partly merged with" the main cloud; accessory clouds are "usually smaller clouds ... separate from the main cloud body or partly merged with it."[1] The 2017 revision added "five new supplementary features (asperitas, cauda, cavum, fluctus and murus), and one new accessory cloud (flumen)," along with the new species volutus.[1]
| Name | Kind | What it is, in the Atlas's words |
|---|---|---|
| Incus | Feature | "The upper portion of a Cumulonimbus spread out in the shape of an anvil" |
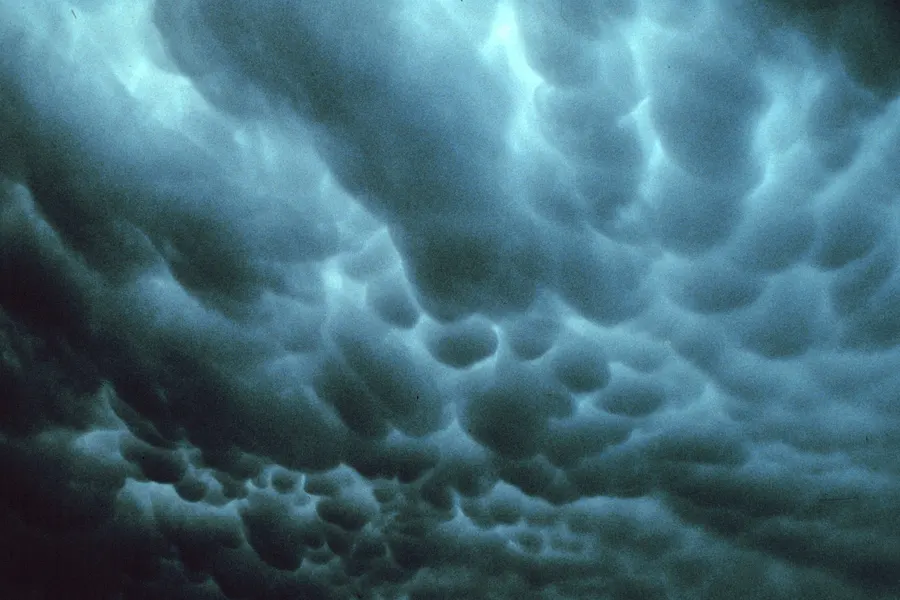
| Mamma | Feature | "Hanging protuberances, like udders, on the under surface of a cloud" |
| Virga | Feature | "Vertical or inclined trails of precipitation (fallstreaks) attached to the under surface of a cloud that do not reach the Earth's surface" |
| Praecipitatio | Feature | "Precipitation ... falling from a cloud and reaching the Earth's surface" |
| Arcus | Feature | "A dense, horizontal roll with more or less tattered edges, situated on the lower front part of certain clouds" |
| Tuba | Feature | "Cloud column or inverted cloud cone, protruding from a cloud base; it constitutes the cloudy manifestation of a more or less intense vortex" |
| Asperitas (2017) | Feature | "Well-defined, wave-like structures in the underside of the cloud," as if "viewing a roughened sea surface from below" |
| Fluctus (2017) | Feature | "A relatively short-lived wave formation, usually on the top surface of the cloud, in the form of curls or breaking waves (Kelvin-Helmholtz waves)" |
| Cavum (2017) | Feature | "A well-defined generally circular (sometimes linear) hole in a thin layer of supercooled water droplet cloud," with virga falling from the center |
| Murus (2017) | Feature | "A localized, persistent, and often abrupt lowering of cloud from the base of a Cumulonimbus": the wall cloud |
| Cauda (2017) | Feature | "A horizontal, tail-shaped cloud (not a funnel) at low levels" joining a supercell's rain area to the wall cloud: the tail cloud |
| Pileus | Accessory | "In the form of a cap or hood above the top or attached to the upper part of a cumuliform cloud that often penetrates it" |
| Velum | Accessory | "An accessory cloud veil of great horizontal extent, close above or attached to the upper part of one or several cumuliform clouds" |
| Pannus | Accessory | "Ragged shreds sometimes constituting a continuous layer, situated below another cloud" |
| Flumen (2017) | Accessory | "Bands of low clouds associated with a supercell ... moving into or towards the supercell," including the beaver's tail |
Source: the International Cloud Atlas, sections 2.2.2.4 and 2.2.2.5.[1] Several have plainer names in the storm-spotting vocabulary used by the National Weather Service: arcus is the shelf cloud along a gust front, murus the wall cloud, tuba a funnel cloud, pannus the ragged scud under a rain cloud, and flumen the inflow bands feeding a supercell.
The NWS cloud chart
Weather observers report the sky in coded form, and the codes group clouds by what they indicate as well as what they are. "In the 1930s, the National Weather Service standardized codes for cloud forms and cloud cover according to the international system of classification," JetStream explains, and its cloud chart shows "27 categories." The ten genera are split into nine low, nine middle and nine high codes, many of them "the same cloud type in different stages of development or amounts of sky cover. For example, cumulus (Cu) clouds of little vertical extent are classified as a 'Low 1' but are classified as 'Low 2' if there is moderate vertical growth. A cumulonimbus (Cb) without a visible anvil is classified 'Low 3' but with an anvil, it is classified as 'Low 9'."[3]
The high codes, for example, distinguish cirrostratus that is "increasing in coverage and generally thickening as a whole" (High 5 and 6) from a veil "covering the whole sky" (High 7), because a thickening veil is a forecast in itself. The chart, free to download from NOAA, also shows the common features: mammatus, fog, wall cloud, shelf cloud, asperitas and virga.[3]
How clouds are observed and reported
At most American airports the sky is now measured by a machine. The Automated Surface Observing System, ASOS, uses a ceilometer, "an automatic, active, remote-sensing instrument for detecting the presence of clouds overhead and measuring the height of their bases."[2] The ASOS User's Guide describes it: "a laser beam ceilometer with a vertical measuring range of 12,600 feet and reporting range of 12,000 feet," a vertically pointed laser that works like radar, timing the return of each pulse from the cloud base, at a wavelength of about 0.9 micrometers. The returns are sorted into 50-foot height bins, and "at 12,000 feet the beam's sample area is a circle with a diameter of 60 feet."[5]
A laser pointing straight up sees only the cloud that passes over it. ASOS turns that into a sky cover by time: "Every minute, ASOS processes the most recent 30 minutes of 30-second sample data; the last 10 minutes of data are processed twice (double weighted) to be more responsive to the latest changes in sky condition." The hits are clustered into layers, up to three are reported, and the fraction of hits in each layer becomes its amount.[5] The guide is direct about the limits: the sensor "does not measure or know what is happening along the horizon, nor does it report on clouds above 12,000 feet," and "up to 20 percent of the reports of 'FEW' cloud events will be missed by using only one ceilometer. These events are usually widely scattered fair weather cumulus, which the ASOS may report as 'CLR.'"[5]
Oktas and the sky condition code
Cloud amount is counted in eighths of the sky, oktas. The METAR, the international code for hourly aviation weather reports, gives each layer as an amount followed by the height of its base in hundreds of feet above the ground.[4]
| Code | Meaning | Oktas | ASOS measured cover |
|---|---|---|---|
| SKC / CLR | Clear (CLR: nothing detected at or below 12,000 ft) | 0 | 0 to under 5% |
| FEW | Few | over 0 to 2/8 | over 5 to under 25% |
| SCT | Scattered | 3/8 to 4/8 | over 25 to under 50% |
| BKN | Broken | 5/8 to 7/8 | over 50 to under 87% |
| OVC | Overcast | 8/8 | over 87 to 100% |
| VV | Vertical visibility into an obscured sky | 8/8 |
Sources: the FAA handbook, table 24-4, and the ASOS User's Guide, table 3.[4][5] Three rules make the code readable. Layers are listed from the ground up, and each layer's amount includes all the layers below it, since an observer "cannot see above" the lower clouds and must assume the higher layer continues over them; the last layer's amount is the total sky cover. Heights are rounded to the nearest 100 feet up to 5,000 feet, 500 feet up to 10,000 and 1,000 feet above. And "the ceiling is the lowest layer aloft reported as broken or overcast. If the sky is totally obscured with ground-based clouds, the vertical visibility is the ceiling."[4] The ceiling is the number pilots plan around: the FAA handbook's flight categories treat a ceiling below 1,000 feet as instrument flight rules (IFR) and one below 500 feet as low IFR.[4]
Two further rules separate a machine's report from a person's. "SKC is used [when] an observer indicates no layers are present; CLR is used by automated stations to indicate no layers are detected at or below 12,000 ft." And "at manual stations, cumulonimbus (CB) or towering cumulus (TCU) is appended to the associated layer."[4] At large airports an observer works with the ASOS and adds what the laser cannot see. The User's Guide's own example shows it: where the machine alone reported "SCT080," the observer added a broken layer at 14,000 feet, and "augmented sky condition for clouds above 12,000 feet."[5]
A METAR decoded
On the night of July 14, 2024, thunderstorms crossed Chicago. At 9:51 pm CDT, O'Hare International Airport issued its routine hourly report:[10]
KORD 150251Z 18009KT 10SM FEW055 BKN180 BKN240 OVC300 29/24 A2983 RMK AO2 SLP096 CONS LTGICCGCCCA DSNT SW-N CB DSNT SW-N MOV SE T02890239 55018 $
| Group | Meaning |
|---|---|
KORD | Chicago O'Hare |
150251Z | The 15th, 02:51 UTC (9:51 pm CDT on the 14th) |
18009KT | Wind from 180 degrees (south) at 9 knots |
10SM | Visibility 10 statute miles |
FEW055 | Few clouds, base 5,500 ft: at most 2/8 of the sky |
BKN180 | Broken, base 18,000 ft: with the layer below, 5/8 to 7/8. The ceiling |
BKN240 | Broken, base 24,000 ft: the sky still not fully covered |
OVC300 | Overcast, base 30,000 ft: total cover 8/8 |
29/24 | Temperature 29 °C, dew point 24 °C |
A2983 | Altimeter setting 29.83 inches of mercury |
RMK AO2 | Remarks follow; an automated system capable of reporting present weather |
SLP096 | Sea-level pressure 1009.6 hPa |
CONS LTGICCGCCCA DSNT SW-N | Constant lightning, in cloud, cloud to ground, cloud to cloud and cloud to air, distant from southwest to north |
CB DSNT SW-N MOV SE | Cumulonimbus distant from southwest to north, moving southeast |
T02890239 | Temperature 28.9 °C, dew point 23.9 °C, to a tenth |
55018 | Three-hourly pressure tendency group |
$ | The station's maintenance check indicator |
Every layer but the lowest is above 12,000 feet, beyond the ceilometer: they, the distant cumulonimbus and the type of cloud were added by a person, since the laser neither reaches that high nor names clouds. Layers of cloud at 18,000 to 30,000 feet with cumulonimbus reported to the southwest and west are what spreading thunderstorm anvils look like from the ground. Twelve minutes later the thunderstorm reached the airport and O'Hare issued a special report:
KORD 150303Z 17009KT 10SM TS FEW055CB SCT065 BKN180 BKN240 OVC300 29/24 A2982 RMK AO2 TSB02 ...
TS is a thunderstorm at the station, which began at 02 minutes past the hour
(TSB02), and the lowest layer now carries CB: its few clouds at
5,500 feet are the base of a cumulonimbus. At 03:32 UTC the next special read
1/4SM +TSRA FG BKN013 OVC030CB: a quarter mile of visibility in heavy rain,
and a ceiling that had fallen from 18,000 to 1,300 feet in 41 minutes.[10]
Ten years of sky at three airports
Hourly reports add up to a climatology of clouds. This lesson took every routine report from Seattle-Tacoma, Chicago O'Hare and Phoenix Sky Harbor from 2015 through 2024, about 87,500 at each, from the Iowa Environmental Mesonet's archive, and read the total sky cover from the last layer of each.[10]
- Clear
- Few
- Scattered
- Broken
- Overcast or obscured
Table: total sky cover by month, percent of hourly reports, 2015 to 2024
| Airport, month | Reports | Clear, % | Few, % | Scattered, % | Broken, % | Overcast, % |
|---|---|---|---|---|---|---|
| Seattle, Jan | 7,430 | 5 | 4 | 8 | 24 | 58 |
| Seattle, Feb | 6,782 | 6 | 5 | 9 | 26 | 55 |
| Seattle, Mar | 7,424 | 8 | 9 | 12 | 31 | 41 |
| Seattle, Apr | 7,191 | 9 | 9 | 13 | 32 | 37 |
| Seattle, May | 7,429 | 8 | 12 | 15 | 32 | 33 |
| Seattle, Jun | 7,179 | 9 | 14 | 17 | 34 | 27 |
| Seattle, Jul | 7,431 | 23 | 23 | 14 | 23 | 17 |
| Seattle, Aug | 7,435 | 20 | 19 | 16 | 25 | 20 |
| Seattle, Sep | 7,173 | 15 | 13 | 13 | 30 | 29 |
| Seattle, Oct | 7,419 | 13 | 8 | 11 | 29 | 39 |
| Seattle, Nov | 7,179 | 8 | 6 | 9 | 26 | 50 |
| Seattle, Dec | 7,432 | 4 | 5 | 7 | 23 | 61 |
| Chicago, Jan | 7,434 | 8 | 12 | 5 | 15 | 60 |
| Chicago, Feb | 6,780 | 12 | 16 | 8 | 19 | 45 |
| Chicago, Mar | 7,426 | 10 | 15 | 9 | 21 | 45 |
| Chicago, Apr | 7,189 | 10 | 16 | 9 | 25 | 41 |
| Chicago, May | 7,430 | 6 | 16 | 12 | 30 | 36 |
| Chicago, Jun | 7,181 | 9 | 20 | 14 | 32 | 25 |
| Chicago, Jul | 7,428 | 8 | 21 | 18 | 34 | 19 |
| Chicago, Aug | 7,429 | 10 | 22 | 18 | 33 | 17 |
| Chicago, Sep | 7,197 | 12 | 21 | 14 | 29 | 24 |
| Chicago, Oct | 7,432 | 14 | 18 | 9 | 24 | 35 |
| Chicago, Nov | 7,193 | 12 | 17 | 8 | 21 | 41 |
| Chicago, Dec | 7,433 | 7 | 13 | 6 | 20 | 54 |
| Phoenix, Jan | 7,435 | 22 | 23 | 13 | 31 | 11 |
| Phoenix, Feb | 6,787 | 28 | 25 | 11 | 27 | 9 |
| Phoenix, Mar | 7,426 | 21 | 26 | 14 | 32 | 8 |
| Phoenix, Apr | 7,194 | 30 | 29 | 14 | 25 | 2 |
| Phoenix, May | 7,432 | 36 | 32 | 11 | 19 | 2 |
| Phoenix, Jun | 7,183 | 30 | 35 | 14 | 20 | 2 |
| Phoenix, Jul | 7,423 | 11 | 26 | 23 | 37 | 4 |
| Phoenix, Aug | 7,428 | 10 | 29 | 24 | 32 | 4 |
| Phoenix, Sep | 7,183 | 25 | 34 | 16 | 22 | 3 |
| Phoenix, Oct | 7,428 | 37 | 31 | 12 | 18 | 2 |
| Phoenix, Nov | 7,192 | 32 | 26 | 12 | 26 | 4 |
| Phoenix, Dec | 7,434 | 23 | 23 | 12 | 31 | 11 |
The three airports all have observers, and it shows. At Phoenix, 62 percent of reports
include a layer above 12,000 feet, which only the observer could have added, and in 37
percent every reported layer is above 12,000 feet: the ceilometer alone would have reported
clear. At Chicago the figures are 48 and 20 percent, at Seattle 31 and 12 (computed here).
Much of Phoenix's reported cloud is high: most of the broken and overcast skies in its bars
have their ceiling above 12,000 feet, as the next chart shows. At a station without an
observer, reports like those would have read CLR.
- Below 1,000 ft
- 1,000 to 3,000 ft
- Above 3,000 to 12,000 ft
- Above 12,000 ft
- No ceiling
Table: ceiling height by season, percent of hourly reports, 2015 to 2024
| Airport, season | Reports | Below 1,000 ft | 1,000 to 3,000 ft | Above 3,000 to 12,000 ft | Above 12,000 ft | No ceiling |
|---|---|---|---|---|---|---|
| Seattle, winter | 21,644 | 10 | 25 | 36 | 11 | 18 |
| Seattle, spring | 22,044 | 4 | 18 | 32 | 15 | 31 |
| Seattle, summer | 22,045 | 3 | 13 | 20 | 12 | 52 |
| Seattle, fall | 21,771 | 7 | 18 | 30 | 12 | 32 |
| Chicago, winter | 21,647 | 11 | 26 | 18 | 16 | 29 |
| Chicago, spring | 22,045 | 7 | 13 | 24 | 22 | 34 |
| Chicago, summer | 22,038 | 2 | 7 | 18 | 26 | 47 |
| Chicago, fall | 21,822 | 5 | 14 | 20 | 19 | 42 |
| Phoenix, winter | 21,656 | 0 | 1 | 13 | 26 | 60 |
| Phoenix, spring | 22,052 | 0 | 0 | 6 | 22 | 71 |
| Phoenix, summer | 22,034 | 0 | 0 | 4 | 29 | 67 |
| Phoenix, fall | 21,803 | 0 | 0 | 6 | 19 | 75 |
The two wetter airports share a pattern: low ceilings are a cold-season feature, and summer brings the most hours with no ceiling at all. Seattle's ceilings between 1,000 and 3,000 feet fill a quarter of winter reports (25 percent) and 13 percent of summer ones; Chicago's fall from 26 to 7 percent. At Phoenix, ceilings below 3,000 feet appear in about 1 percent of winter reports and almost never otherwise (computed here).
Contrails
A condensation trail, or contrail, is in the AMS's words "a cloudlike streamer frequently observed to form behind aircraft flying in clear, cold, humid air."[2] Most are exhaust trails. Burning jet fuel adds water vapor and heat to the wake, and when the hot, moist exhaust mixes with very cold air, the mixture passes through saturation, the mixing route to a cloud. The AMS notes that the thermodynamics make this "important only for rather low temperatures of the order of those encountered near the tropopause, so this type of condensation trail is only usually observed for high-altitude flight."[2]
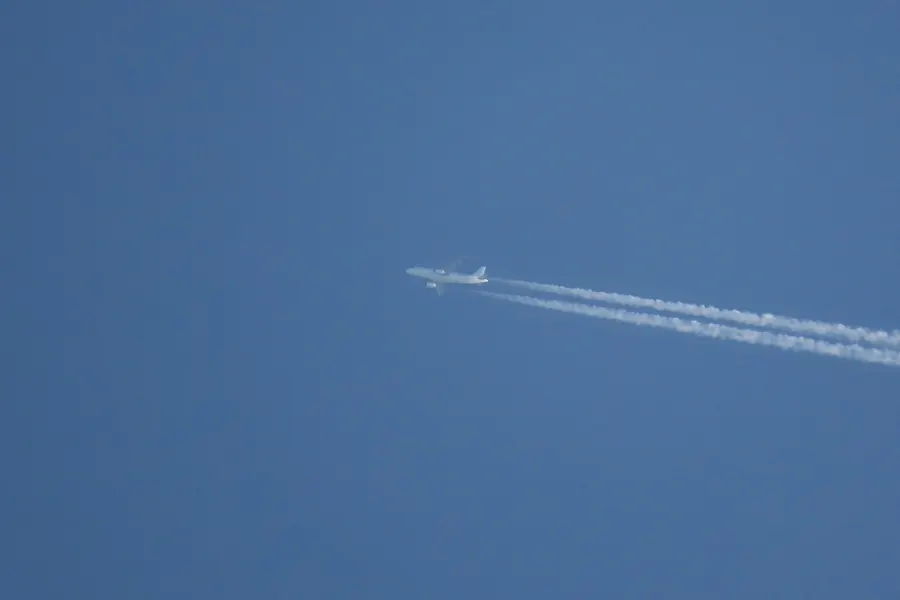
The condition is known as the Schmidt-Appleman criterion. In Bernd Kärcher's review of contrail science, "a thermodynamic mixing model has shown that temperatures typically below 233 K (≈−40 °C) provide a threshold below which either short-lived or long-lived contrails appear behind jet aircraft cruising above ≈8 km," on the assumption "that exhaust plumes surpass water saturated conditions."[8] Whether a contrail lasts depends on the air it is in. Where the air is supersaturated with respect to ice, it persists and spreads, and "outside ice supersaturated areas in drier or warmer (ice subsaturated) air, contrails may still form, but are only short-lived."[8] A 2024 flight trial by Google Research and American Airlines states the same pair of conditions: persistent contrails form "when planes fly through ice-supersaturated regions (ISSRs), where the relative humidity with respect to ice is greater than 100%, and temperature conditions satisfy the Schmidt-Appleman Criterion."[9]
The Cloud Atlas treats a contrail that has "persisted for at least 10 minutes" as a cloud, cirrus homogenitus, and one that has spread until it looks like natural cirrus as, for example, cirrus fibratus homomutatus.[1] A long-lasting contrail is therefore a forecast clue: it says the upper troposphere is moist, and moisture high up often comes ahead of an approaching system.
Clouds from above
A ceilometer sees cloud bases from below and a satellite sees cloud tops from above, and the two rarely show the same thing. Geostationary satellites image a whole hemisphere every few minutes in visible light, which shows cloud by day as it looks to the eye, and in infrared, which measures the temperature of the tops by day and night. Cold tops are high tops, so infrared picks out cirrus and the anvils of thunderstorms that a ground observer might never see through the low clouds beneath. The satellite view on the site's radar shows GOES imagery for the United States, and satellite imagery has its own lessons later in the course.
Clouds that rotate
A few of the features in the Atlas mark rotation, and they are the ones storm spotters watch. Murus, the wall cloud, is "usually associated with a supercell or severe multicell storm," typically forms "in the rain-free portion of a Cumulonimbus," and indicates "an area of strong updraft." "Murus showing significant rotation and vertical motion may result in the formation of tuba (spouts)."[1] Tuba is a funnel cloud, the visible sign of a vortex, and when a funnel's vortex reaches the ground it is a tornado. Cauda, the tail cloud, and flumen, the inflow bands, mark air flowing into the updraft. How these features form in a supercell, and which of them matter, is in How tornadoes form. Not every lowered cloud rotates: scud, ragged cloud under a storm's base, is the most common false alarm.
Check yourself
-
Why would air that reaches 100 percent relative humidity fail to form a cloud in a perfectly clean chamber?
Answer
Without particles to condense on, a droplet must form from vapor alone, and the energy cost of creating its tiny surface is too high. Clean air can reach relative humidities of the order of 400 percent without condensing; real clouds form near 100 percent because the air is full of cloud condensation nuclei.
-
Why do clouds over the open ocean tend to have larger droplets than clouds over polluted land?
Answer
Remote ocean air holds about 100 cloud condensation nuclei per cubic centimeter and polluted continental air thousands. The same condensed water shared among fewer nuclei makes fewer, larger droplets, which grow into rain more readily.
-
A cloud at −15 °C contains both supercooled droplets and a few ice crystals. What happens?
Answer
The air is saturated for the droplets and supersaturated for the ice, so the crystals grow by taking up vapor while the droplets evaporate: the Bergeron process. In 10 to 20 minutes the crystals can be heavy enough to fall as snow.
-
Name the four common ways air is lifted to saturation.
Answer
Buoyancy (convection from heated ground), orographic lift over mountains, frontal lift at fronts, and convergence of winds into low pressure.
-
A thin, whitish veil covers the sky and a ring of light surrounds the sun. What cloud is it, and what is it made of?
Answer
Cirrostratus, made of ice crystals; the halo is produced by the crystals. Altostratus would show the sun as through ground glass and never a halo.
-
Decode
FEW012 SCT030 BKN050. What is the ceiling?Answer
Few clouds at 1,200 feet, a scattered layer at 3,000 feet, and a broken layer at 5,000 feet. The ceiling is 5,000 feet, the lowest broken or overcast layer. Each amount includes the layers below, so the total cover is 5/8 to 7/8.
-
An automated station with no observer reports
CLR. Is the sky clear?Answer
Not necessarily. CLR means the ceilometer detected nothing at or below 12,000 feet over the last 30 minutes. There may be cirrus or altostratus above, or scattered cumulus that did not pass over the sensor.
-
Which supplementary feature is the wall cloud, and why does it matter?
Answer
Murus, added in 2017: a persistent lowering of a cumulonimbus base marking a strong updraft, usually in a supercell. One that rotates may produce tuba, a funnel cloud, and possibly a tornado.
Video


Methods
The sky cover and ceiling figures use every routine hourly METAR from Seattle-Tacoma (SEA), Chicago O'Hare (ORD) and Phoenix Sky Harbor (PHX) from January 1, 2015 to December 31, 2024 (UTC), as decoded by the Iowa Environmental Mesonet: 87,504, 87,552 and 87,545 reports with a sky condition. Special reports are excluded, so each hour counts once. The total sky cover of a report is the highest amount among its layers (clear, few, scattered, broken, overcast, with an obscured sky counted as overcast), since each layer's amount includes those below it. The ceiling is the height of the lowest broken, overcast or vertical visibility layer. Seasons are December to February, March to May, June to August and September to November. All three stations have observers who add layers above 12,000 feet, so the figures describe these airports' reports, not what an unattended ASOS would report.
Fall speeds of cloud drops are computed with Stokes' law, v = 2r²g(ρw −
ρa)/9μ, for air of viscosity 1.76 × 10⁻⁵ Pa·s and density 1.25 kg/m³; the law holds
for drops smaller than about 0.1 mm. The CCN averages are the "Average" rows of Andreae
(2009), table 2. The code and data are in the site's repository, under
scripts/learn/.
Related
Air parcels and adiabatic cooling explains why rising air cools and computes the cloud base from a surface observation. Dew point and humidity covers the moisture side of saturation. How to read a skew-T diagram shows cloud layers as the places where the temperature and dew point traces meet, and How tornadoes form follows the wall cloud to the tornado. Current sky conditions at airports are on the observations page, and cloud tops on the radar's satellite view. Terms are in the glossary.
Sources
Quotations are verbatim from the source named. Figures marked "computed here" are described under Methods.
- World Meteorological Organization, International Cloud Atlas, 2017 edition: definition of a cloud, principles of cloud classification (genera, species, varieties, mother clouds, special clouds), levels, table 6, the definition and physical constitution of each genus (for example cumulus), supplementary features, accessory clouds, aircraft condensation trails, orographic influences and the foreword to the 2017 edition.
- American Meteorological Society, Glossary of Meteorology, entries cloud, condensation, saturation, supersaturation, cloud condensation nuclei, hygroscopic, cloud drop, raindrop, supercooled water, ice nucleus, homogeneous nucleation, Bergeron–Findeisen process, cloud seeding, orographic lifting, frontal lifting, radiation fog, advection fog, cloud classification, pileus, ceilometer, ceiling and condensation trail.
- NOAA, JetStream: How Clouds Form, Ten Basic Clouds and NWS Cloud Chart, with the chart itself as a PDF.
- Federal Aviation Administration, Aviation Weather Handbook, FAA-H-8083-28A, 2024: section 3 (weather flight categories), 12.4 (common sources of vertical motion), 24.4.3.9 (sky condition group, tables 24-4 and 24-5) and appendix A (cloud types).
- National Weather Service, Federal Aviation Administration and Department of Defense, Automated Surface Observing System (ASOS) User's Guide, section 2.5 and section 4.1, Automating Sky Condition, table 3.
- M. O. Andreae, Correlation between cloud condensation nuclei concentration and aerosol optical thickness in remote and polluted regions, Atmospheric Chemistry and Physics 9, 543–556, 2009: abstract, sections 4 to 7, and table 2.
- P. J. DeMott and others, Predicting global atmospheric ice nuclei distributions and their impacts on climate, Proceedings of the National Academy of Sciences, 2010.
- B. Kärcher, Formation and radiative forcing of contrail cirrus, Nature Communications 9, 2018, citing U. Schumann, "On conditions for contrail formation from aircraft exhausts," Meteorologische Zeitschrift 5, 1996.
- A. Sonabend-W and others, Feasibility test of per-flight contrail avoidance in commercial aviation, Communications Engineering, 2024.
- Iowa Environmental Mesonet, Iowa State University, ASOS/AWOS/METAR archive: routine reports from Seattle-Tacoma (SEA), Chicago O'Hare (ORD) and Phoenix Sky Harbor (PHX), 2015 to 2024; all O'Hare reports of July 15, 2024 UTC.
- NOAA Photo Library, public domain, via Wikimedia Commons: Stephen Corfidi, wea03319 (supercell, Humboldt, Nebraska, April 20, 1985); Ralph F. Kresge, wea00071 (cirrus) and wea00048 (altocumulus); collection of Dr. Bill Hooke, wea03529 (thunderstorm over the Arizona desert); National Severe Storms Laboratory, nssl0113 (mammatus, Tulsa, Oklahoma, June 2, 1973) and nssl0109 (shelf cloud, Miami, Texas, June 19, 1980).
- Wikimedia Commons, photographs under the licenses named: Famartin, CC BY-SA 4.0, cirrocumulus, cirrostratus, altostratus, stratocumulus and stratus; Simon Eugster, CC BY-SA 3.0, nimbostratus praecipitatio; Lee Ann Ratledge, CC BY 4.0, cumulus humilis; James St. John, CC BY 2.0, cumulus pileus; John Fowler, CC BY 2.0, desert virga; Rubbish computer, CC BY-SA 4.0, asperitas; M. Cristian-Ioan, public domain, contrails. Cropped and resized.
- NWS Albuquerque, Weather 101: A Tutorial on Cloud Types, YouTube.
- NOAA SciJinks, What Are the Different Types of Clouds?, YouTube.
- Met Office, Learn About Weather, How do clouds form?, YouTube.
- Met Office, Learn About Weather, Learn how to name the clouds - 3 Minute Met, YouTube.


.jpg)


_(Yellowstone,_Wyoming,_USA)_2_(28192930092).jpg)


.jpg)
Corrections: contact@weatherovertime.com.
Unit 1: The atmosphere
- Layers of the atmosphere
Troposphere to thermosphere, and why weather happens in the lowest layer.
- Air pressure
What pressure is, how it is measured, and why it falls with height.
- Temperature and heat
How the sun heats the ground, the ground heats the air, and the day warms and cools.
- Dew point and humidity
Why dew point, not relative humidity, is the number forecasters watch.
- How clouds form and how to name them
Condensation, cloud bases, and the ten cloud genera.