Dew point and humidity
- Read first
- Temperature and heat, Air pressure
- Key terms
- Dew point, Relative humidity, Water vapor, Vapor pressure, Saturation vapor pressure, Saturation, Clausius–Clapeyron equation, Mixing ratio, Specific humidity, Absolute humidity, Dew point depression, Frost point, Wet-bulb temperature, Precipitable water, Dew, Radiation fog, Crossover temperature, Psychrometer, Hygrometer
Water vapor is a small and variable part of the air, and most of the weather depends on it: clouds, rain, fog, dew, the energy that drives thunderstorms and how hot a summer afternoon feels. There are many ways to say how much of it the air holds. Relative humidity is the one most people know, and it is the one forecasters trust least, because it changes whenever the temperature changes. This lesson explains every common measure of humidity, why the dew point is the one to watch, and what it forecasts, using real observations from a clear day in Iowa, a fog night in Phoenix, the most humid afternoon on record and the limit of human heat tolerance.

- Vapor pressure and saturation: why warm air can hold far more water vapor than cold air, and the curve that says how much.
- Every measure of humidity and its definition, computed for one real sample of air.
- Why relative humidity misleads, on a real day in Des Moines and at twelve cities at the same moment.
- What the dew point forecasts: comfort, dew, frost, fog, cloud bases and the fuel for thunderstorms.
- How humidity is measured, the records, and the wet-bulb temperature at which the human body can no longer cool itself.
Water vapor and vapor pressure
Water vapor is water as a gas, invisible and mixed molecule by molecule with the nitrogen and oxygen of the air. The American Meteorological Society calls it "one of the most important of all constituents of the atmosphere." Its amount "varies widely in space and time," and "approximately half of all of the atmospheric water vapor is found below 2-km altitude." It matters three ways: it is "the raw material for cloud and rain and snow," it carries energy as latent heat, released when it condenses, and it regulates the planet's temperature by absorbing and emitting infrared radiation.[1]
Like every gas in a mixture, water vapor contributes its share of the air's pressure. That share is the vapor pressure, written e: in the AMS definition, "the pressure exerted by the molecules of a given vapor," which for a vapor mixed with other gases is "its partial pressure." In meteorology the term means "almost exclusively" the partial pressure of water vapor.[1] It is small. At sea level the whole atmosphere presses with about 1,013 hPa; the water vapor in the most humid air on Earth adds about 56 hPa of that, and on a cold winter morning less than 2 hPa. The air pressure lesson explains the unit.
Vapor pressure is the most direct measure of how much water vapor the air holds, and every other measure in this lesson can be computed from it, the temperature and the pressure. The question the rest of the lesson keeps returning to is how much vapor the air can hold before some of it has to condense.
Saturation and the Clausius–Clapeyron curve
Over a flat surface of water, molecules leave the liquid and others return to it. When the two rates balance, the vapor above is in equilibrium with the water: it is saturated. The vapor pressure at that point is the saturation vapor pressure, es, "the vapor pressure of a system that has attained saturation but not supersaturation." For pure water it "is a function of temperature alone," and it is lower over ice than over supercooled water at the same temperature.[1] Air does not "hold" water in any physical sense; the phrase is shorthand for this equilibrium, which would be the same with no air present at all.
How fast es rises with temperature is set by the Clausius–Clapeyron equation, which relates "pressure of a substance to temperature in a system in which two phases of the substance are in equilibrium." For everyday use the AMS gives an empirical formula by Bolton (1980), "believed accurate to 0.3% for −35°C < T < 35°C":[1][4]
es = 6.112 exp[17.67 T / (T + 243.5)] hPa, with T in °C.
Table: saturation vapor pressure over water (Bolton 1980)
| Temperature | Saturation vapor pressure, hPa | Rise per °C | Saturation mixing ratio at 1000 hPa, g/kg |
|---|---|---|---|
| −30 °C (−22 °F) | 0.51 | 9.4% | 0.3 |
| −20 °C (−4 °F) | 1.26 | 8.6% | 0.8 |
| −10 °C (14 °F) | 2.87 | 7.9% | 1.8 |
| 0 °C (32 °F) | 6.11 | 7.3% | 3.8 |
| 5 °C (41 °F) | 8.72 | 7.0% | 5.5 |
| 10 °C (50 °F) | 12.27 | 6.7% | 7.7 |
| 15 °C (59 °F) | 17.04 | 6.4% | 10.8 |
| 20 °C (68 °F) | 23.37 | 6.2% | 14.9 |
| 25 °C (77 °F) | 31.67 | 6.0% | 20.3 |
| 30 °C (86 °F) | 42.46 | 5.8% | 27.6 |
| 35 °C (95 °F) | 56.31 | 5.5% | 37.1 |
| 40 °C (104 °F) | 73.95 | 5.4% | 49.7 |
| 45 °C (113 °F) | 96.20 | 5.2% | 66.2 |
The curve explains most of what follows. Near freezing, es doubles with about 10 °C of warming; near 20 °C, with about 12. Per degree, the rise is 7.3 percent at 0 °C, 6.2 percent at 20 °C and 5.8 percent at 30 °C. The Intergovernmental Panel on Climate Change uses the rounded figure: "The Clausius–Clapeyron equation determines that low-altitude specific humidity increases by about 7% °C–1 of warming, assuming that relative humidity remains constant." That is why a warmer climate is expected to bring heavier downpours: "Extreme daily precipitation is expected to increase at close to the 7% °C–1 increase in the near-surface atmospheric moisture-holding capacity."[3]
The same steep curve is why cooling makes clouds. Air that is not saturated at 25 °C may be saturated at 15 °C, because the most it can hold has fallen by almost half while the vapor it contains has not changed. Cooling moist air until it reaches its saturation point is how dew, fog and nearly every cloud form, as the lesson on clouds describes.
Eight measures, one sample of air
The AMS glossary notes that "the multiplicity of humidity measures is partly due to different methods of measurement and partly because the conservative measures (mixing ratio, specific humidity) cover an extremely wide dynamic range, as a result of the rapid variation of saturation vapor pressure with temperature." Popularly, it adds, humidity is the "same as relative humidity."[1] These are the ones in use, with the definitions of the AMS glossary.
- Dew point
- "The temperature to which a given air parcel must be cooled at constant pressure and constant water vapor content in order for saturation to occur." Equivalently, the temperature at which the saturation vapor pressure equals the actual vapor pressure: a temperature that stands for an amount of water. Heating or cooling the air does not change it "as long as no vapor is added or removed."[1] See dew point.
- Frost point
- The name for the dew point "when this temperature is below 0°C." Air cooled to it deposits ice rather than water.[1] See frost point.
- Relative humidity
- "The ratio of the vapor pressure to the saturation vapor pressure with respect to a plane surface of pure water," usually in percent. It "can also be calculated to a high degree of accuracy by dividing the mixing ratio by the saturation mixing ratio." It is reported with respect to water, even below freezing.[1] See relative humidity.
- Mixing ratio
- "The ratio of the mass of a variable atmospheric constituent to the mass of dry air," which "normally refers to water vapor," in grams per kilogram. It is computed as r = 0.622 e / (p − e).[1] See mixing ratio.
- Specific humidity
- "The (dimensionless) ratio of the mass of water vapor to the total mass of the system," dry air and vapor together. It is a little smaller than the mixing ratio, and "for many purposes they can be equated."[1] See specific humidity.
- Absolute humidity
- "The ratio of the mass of water vapor present to the volume occupied by the mixture," in grams per cubic meter. Because it changes when air expands or is compressed, "it is not commonly used by meteorologists."[1] See absolute humidity.
- Wet-bulb temperature
- "The temperature an air parcel would have if cooled adiabatically to saturation at constant pressure by evaporation of water into it, all latent heat being supplied by the parcel"; in practice, "the temperature read from the wet-bulb thermometer." It always lies between the dew point and the temperature.[1] See wet-bulb temperature.
- Precipitable water
- "The total atmospheric water vapor contained in a vertical column of unit cross-sectional area," expressed as the depth of water it would make "if completely condensed." It describes a whole column, not one sample.[1] See precipitable water.
The table applies each definition to one real sample: the air at the ground at Norman, Oklahoma, when the weather balloon was launched at 1 pm CDT on May 20, 2013, two hours before the Moore tornado. The skew-T lesson lifts this same air into a storm.[18]
| Norman, Oklahoma, 1 pm CDT May 20, 2013, pressure 966 hPa | Value |
|---|---|
| Temperature | 27.4 °C (81.3 °F) |
| Dew point | 22.4 °C (72.3 °F) |
| Dew point depression | 5.0 °C (9 °F) |
| Vapor pressure | 27.1 hPa |
| Saturation vapor pressure | 36.5 hPa |
| Relative humidity | 74 percent |
| Mixing ratio | 17.9 g/kg |
| Specific humidity | 17.6 g/kg |
| Absolute humidity | 19.5 g/m³ |
| Wet-bulb temperature | 23.7 °C (74.7 °F) |
| Precipitable water, surface to 300 hPa | 32.5 mm (1.28 in) |
Computed here from the University of Wyoming's record of the sounding, which itself lists a relative humidity of 74 percent and a mixing ratio of 17.92 g/kg for this level.[6] Every row describes the same air, and each has its use. The mixing ratio does not change when unsaturated air rises or sinks, which makes it the quantity a skew-T tracks. The wet-bulb temperature is how far evaporation can cool the air, which matters for rain falling into dry air and for sweating people. The dew point depression, the gap between temperature and dew point, is how much the air must cool to saturate. Only one row, the relative humidity, would change if the sun came out and the air warmed by 5 °C: it would fall to about 56 percent, with every molecule of vapor still in place.
Why relative humidity misleads
Relative humidity divides the vapor that is there by the vapor that could be there, and the second number is a function of temperature. So relative humidity measures two things at once, and on most days the temperature is the one that moves it. NWS La Crosse, Wisconsin puts the consequence plainly: a day at 30 °F with a dew point of 30 °F has a relative humidity of 100 percent, a day at 80 °F with a dew point of 60 °F only 50 percent, and yet the warmer day feels far more humid, because of "the higher dew point."[2] Computed from the saturation curve, the 30 °F air holds 5.6 hPa of water vapor and the 80 °F air 17.7 hPa, more than three times as much.
- Temperature
- Dew point
- Relative humidity
Table: Des Moines International Airport, hourly, September 7, 2025 (CDT)
| Time | Temperature, °F | Dew point, °F | Relative humidity, % | Wind, kt | Weather |
|---|---|---|---|---|---|
| Sept. 7, 12:54 am | 51 | 44 | 77 | 0 | |
| Sept. 7, 1:54 am | 50 | 45 | 83 | 0 | |
| Sept. 7, 2:54 am | 51 | 44 | 77 | 0 | |
| Sept. 7, 3:54 am | 50 | 45 | 83 | 0 | |
| Sept. 7, 4:54 am | 45 | 44 | 96 | 4 | |
| Sept. 7, 5:54 am | 48 | 44 | 86 | 0 | |
| Sept. 7, 6:54 am | 43 | 42 | 96 | 0 | MIFG |
| Sept. 7, 7:54 am | 51 | 43 | 74 | 4 | |
| Sept. 7, 8:54 am | 54 | 45 | 72 | 3 | |
| Sept. 7, 9:54 am | 58 | 47 | 67 | 3 | |
| Sept. 7, 10:54 am | 62 | 43 | 50 | 3 | |
| Sept. 7, 11:54 am | 64 | 42 | 45 | 3 | |
| Sept. 7, 12:54 pm | 68 | 44 | 42 | 5 | |
| Sept. 7, 1:54 pm | 69 | 42 | 38 | 4 | |
| Sept. 7, 2:54 pm | 71 | 43 | 36 | 3 | |
| Sept. 7, 3:54 pm | 72 | 44 | 37 | 0 | |
| Sept. 7, 4:54 pm | 72 | 45 | 38 | 7 | |
| Sept. 7, 5:54 pm | 71 | 45 | 39 | 5 | |
| Sept. 7, 6:54 pm | 70 | 46 | 42 | 6 | |
| Sept. 7, 7:54 pm | 67 | 46 | 47 | 7 | |
| Sept. 7, 8:54 pm | 65 | 45 | 48 | 8 | |
| Sept. 7, 9:54 pm | 63 | 46 | 54 | 10 | |
| Sept. 7, 10:54 pm | 60 | 47 | 62 | 8 | |
| Sept. 7, 11:54 pm | 59 | 47 | 64 | 7 |
Nothing was added to or taken from the air at Des Moines that day to speak of; the dew point barely moved. The relative humidity fell by 60 percentage points because the air warmed by 29 °F. That is the ordinary daily cycle almost everywhere: relative humidity peaks near sunrise, the coolest hour, and bottoms out in mid-afternoon, the warmest. A forecast that says humidity "will drop this afternoon" usually says nothing about the moisture at all.
The same arithmetic makes relative humidity a poor way to compare places. At 7:53 pm AKST on January 10, 2025, Fairbanks, Alaska reported 6 °F with a dew point of 3 °F: a relative humidity of 87 percent. On the afternoon of July 15, 2025, Phoenix reported 105 °F with a dew point of 58 °F: 22 percent. The Phoenix air held 16.4 hPa of water vapor and the Fairbanks air 1.75, a ratio of more than nine to one.[5]
Relative humidity does have its uses. It says how close air is to saturation, and so how readily water evaporates into it. It is also what most modern sensors measure directly, as the section on instruments explains. But as a measure of how much water vapor is in the air, whether for comfort, for fog or for thunderstorms, the dew point is the number to read.
Dew point and comfort
People cool themselves by sweating, and sweat evaporates more slowly into air that already holds more water vapor. How muggy a day feels therefore tracks the dew point. NWS La Crosse gives a summer scale:[2]
| Dew point | In °C | How it feels (NWS La Crosse) |
|---|---|---|
| 55 °F or lower | 12.8 °C or lower | "Dry and comfortable" |
| 55 to 65 °F | 12.8 to 18.3 °C | Becoming "sticky," with muggy evenings |
| 65 °F or higher | 18.3 °C or higher | "Lots of moisture in the air, becoming oppressive" |
Table: routine observations nearest 21:53 UTC, July 15, 2025
| Airport | Temperature, °F | Dew point, °F | Relative humidity, % | Wet-bulb, °F |
|---|---|---|---|---|
| Miami | 84 | 75 | 74 | 77 |
| New Orleans | 95 | 73 | 49 | 79 |
| Boston | 85 | 72 | 65 | 76 |
| Chicago | 89 | 70 | 54 | 75 |
| Minneapolis | 92 | 70 | 49 | 76 |
| Des Moines | 88 | 65 | 47 | 72 |
| Phoenix | 105 | 58 | 22 | 73 |
| Seattle | 84 | 53 | 35 | 65 |
| San Francisco | 69 | 52 | 55 | 59 |
| El Paso | 98 | 49 | 19 | 67 |
| Las Vegas | 108 | 46 | 13 | 69 |
| Denver | 87 | 44 | 22 | 62 |
Temperature and moisture act together on the body, and two indices combine them. The heat index is, in the AMS definition, "an approximation of how hot it 'feels' for a given combination of air temperature and relative humidity (RH)," adapted by the National Weather Service from Robert Steadman's work.[1] The wet-bulb temperature, taken up at the end of this lesson, measures directly how far evaporation can cool. Live dew points for any station are on the observations page.
Dew, frost and fog
On a clear, calm night the ground loses heat by radiation to space, and it cools the air touching it. When a surface cools to below the dew point of the air around it, water condenses on it. The AMS defines dew as "water condensed onto grass and other objects near the ground, the temperatures of which have fallen below the dewpoint of the surface air due to radiational cooling during the night, but are still above freezing." It lists three conditions that favor it: a radiating surface insulated from the soil's heat, "a clear, still atmosphere," and "high relative humidity in the surface air layers, or an adjacent source of moisture such as a lake."[1]
NWS Houston/Galveston's training page adds the forecaster's view: "The favorable weather elements for dew include clear skies, light wind, decent soil moisture, and low night-time dewpoint depressions." The depression "determines how much the air will need to cool to reach saturation"; with one "greater than 25 units of F, quite a bit of night-time cooling will need to take place." And "soil moisture is EXTREMELY critical to producing dew (especially heavy dew)."[7]
When the dew point is below freezing it is called the frost point, and the vapor skips the liquid stage. Frost, or hoarfrost, "forms when air with a dewpoint below freezing is brought to saturation by cooling"; it is deposited much as dew is, "except that the temperature of the befrosted object must be below freezing." Dew that freezes after forming is something else, called white dew.[1]
The dew point as a forecast of the low
Once the air itself cools to its dew point, condensation releases latent heat and slows further cooling, and the dew point starts to fall as water leaves the air. So the evening dew point is a rough floor under the night's low on a calm, clear night: the temperature can sink to it, but rarely far below. The Des Moines morning above is an example. The temperature fell to 43 °F with a dew point of 42 °F and stopped; the sun did the rest.
If the air near the ground cools to its dew point through a deep enough layer, the result is radiation fog: in the AMS definition, fog "produced over a land area when radiational cooling reduces the air temperature to or below its dewpoint," favored by "a shallow surface layer of relatively moist air beneath a dry layer and clear skies" and "light surface winds."[1]
- Temperature
- Dew point
- Visibility
Table: Phoenix Sky Harbor, January 8 to 9, 2003 (MST)
| Time | Temperature, °F | Dew point, °F | Relative humidity, % | Visibility, mi | Weather |
|---|---|---|---|---|---|
| Jan. 8, 12:56 pm | 61 | 55 | 81 | 10 | |
| Jan. 8, 1:56 pm | 63 | 54 | 72 | 10 | |
| Jan. 8, 2:56 pm | 63 | 53 | 70 | 10 | |
| Jan. 8, 3:56 pm | 61 | 54 | 78 | 10 | -RA |
| Jan. 8, 4:56 pm | 60 | 56 | 86 | 7 | -RA |
| Jan. 8, 5:56 pm | 60 | 57 | 90 | 10 | |
| Jan. 8, 6:56 pm | 59 | 57 | 93 | 8 | |
| Jan. 8, 7:56 pm | 58 | 57 | 97 | 8 | |
| Jan. 8, 8:56 pm | 57 | 56 | 96 | 8 | |
| Jan. 8, 9:56 pm | 57 | 56 | 96 | 8 | |
| Jan. 8, 10:56 pm | 57 | 55 | 93 | 8 | |
| Jan. 8, 11:56 pm | 55 | 54 | 96 | 7 | |
| Jan. 9, 12:56 am | 56 | 54 | 93 | 8 | -RA |
| Jan. 9, 1:56 am | 56 | 54 | 93 | 9 | |
| Jan. 9, 2:56 am | 56 | 55 | 97 | 6 | BR |
| Jan. 9, 3:56 am | 56 | 53 | 90 | 10 | |
| Jan. 9, 4:56 am | 54 | 53 | 97 | 5 | BR |
| Jan. 9, 5:43 am | 54 | 52 | 94 | 0.5 | FG |
| Jan. 9, 5:48 am | 52 | 52 | 100 | 0.25 | FG |
| Jan. 9, 5:56 am | 52 | 52 | 100 | 0.25 | FG |
| Jan. 9, 5:58 am | 52 | 52 | 100 | 0.25 | FG |
| Jan. 9, 6:56 am | 53 | 53 | 100 | 0.25 | FG |
| Jan. 9, 7:56 am | 52 | 52 | 100 | 0.25 | FG |
| Jan. 9, 8:56 am | 53 | 53 | 100 | 0.25 | FG |
| Jan. 9, 9:56 am | 52 | 52 | 100 | 0.25 | FG |
| Jan. 9, 10:39 am | 54 | 54 | 100 | 0.5 | FG |
| Jan. 9, 10:56 am | 53 | 53 | 100 | 1 | BR |
| Jan. 9, 11:37 am | 55 | 54 | 94 | 3 | BR |
| Jan. 9, 11:56 am | 58 | 55 | 90 | 3 | BR |
| Jan. 9, 12:56 pm | 62 | 55 | 78 | 5 | HZ |
| Jan. 9, 1:56 pm | 65 | 54 | 68 | 10 |
The National Weather Service office in Phoenix studied this night because dense fog there is rare. Its write-up describes a rule from UPS Airlines forecasters, the crossover temperature: "the minimum dew point observed during the warmest daytime hours." If there is little turbulent mixing, fog should be forecast "when the shelter temperature is expected to cool to a few degrees below the crossover temperature, rather than a few degrees below the dew point," since that indicates "when saturation will occur aloft." On January 8 the crossover temperature was 53 °F and the forecast low 52 °F. The low that morning was 52 °F, "1 F below the 'crossover temperature'," and visibility "was at or below 1/4 mile from 1248 UTC until shortly after 1700 UTC," with the airport under a two-hour ground stop.[8]
The office's summary lists what dense fog at Phoenix needs, all at once: widespread rain the day or evening before, a nearly saturated lowest 100 mb, a persistently small dew point depression, a minimum temperature below the crossover temperature, light wind with little shear, and cloud cover no more than broken.[8]
The dew point aloft
Away from the ground, the dew point changes in a different way. When unsaturated air rises, it keeps its mixing ratio, but its pressure falls, and with it the vapor pressure. So the dew point of rising air falls, though slowly: the AMS gives "a rate only about one-fifth as great as the dry-adiabatic lapse rate."[1] Lifting the Norman sample above from 966 to 900 hPa, 623 m, lowers its dew point from 22.4 to 21.2 °C, 1.9 °C per kilometer, while its temperature falls at 9.8 °C per kilometer. The two close in at about 8 °C per kilometer and meet at the cloud base, 642 m above the ground for this air, found on the chart in the skew-T lesson.[18] The wider the dew point depression at the ground, the higher the base of the clouds. The lesson on air parcels follows the same climb.
On a sounding the dew point is the left-hand trace, and it is often the more revealing one: a dew point that plunges with height marks a dry layer, one that hugs the temperature trace marks cloud. The whole column's water is the precipitable water. The Norman sounding held 32.5 mm (1.28 inches); the Corpus Christi sounding launched as Hurricane Harvey approached in August 2017, analyzed in the skew-T lesson, held 2.74 inches.[18]
How humidity is measured
The oldest instrument still in use is the psychrometer: "two thermometers exposed side by side, one of which (the dry bulb) is an ordinary glass thermometer, while the other (the wet bulb) has its bulb covered with a jacket of clean muslin that is saturated with distilled water." Evaporation cools the wet bulb, and "the lower the ambient humidity, the greater the rate of evaporation and, consequently, the greater the depression of the wet-bulb temperature." Tables or the psychrometric formula turn the two readings into a dew point. In a sling psychrometer the thermometers are "whirled by hand in order to provide the necessary ventilation."[1]
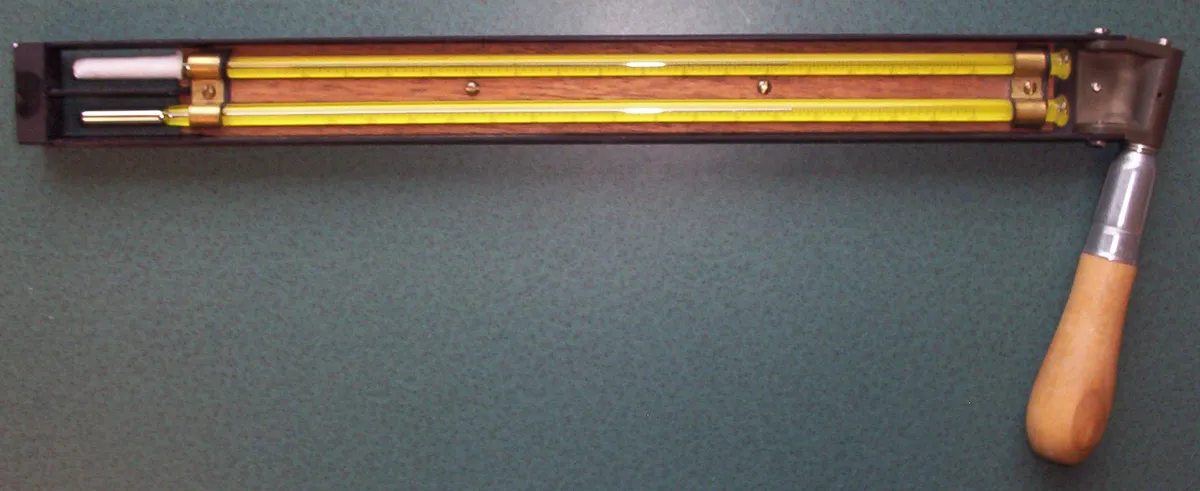
The hygrometer, "any instrument that measures the water vapor content of the atmosphere," comes in six basic kinds by the AMS count, sorted by whether they work by evaporation, by a change in size or electrical properties of a material that absorbs moisture, by condensation, by diffusion or by the absorption of light.[1] Two matter for the US surface network.
- The chilled mirror. The most widely used dewpoint hygrometers cool "a small polished-metal reflecting surface" electrically, watch it with an optical sensor, and hold it at the temperature at which a thin layer of dew is maintained: "The mirror temperature equals the dewpoint."[1] The Automated Surface Observing System (ASOS) was fielded in the 1990s with chilled-mirror hygrothermometers, the Technical Services Laboratory models H083 and 1088. They were accurate but, as the National Weather Service's upgrade plan says, a technician had to "clean the mirrors much more frequently than the normal 90-day maintenance interval."[10][11]
- The capacitive sensor. From June 2002 the network began taking its dew point instead from the Vaisala DTS1, based on a commercial probe whose "solid state capacitive relative humidity element" is kept slightly warmer than the air so that dew never forms on it; the sensor measures relative humidity and computes the dew point. The chilled-mirror units stayed on for temperature.[10][11] In side-by-side tests in Nebraska in 2003, the new sensors' dew points differed from the chilled mirror's by up to about 0.5 °C when the dew point depression exceeded 20 °C.[13] The DTS1 has itself been retired from support, and in 2025 the program began replacing both sensors at every site with the Vaisala HMP155E, a probe that measures temperature and relative humidity, "from which dew point temperature (Td) is derived."[12]
So the modern network measures relative humidity and reports the dew point, the reverse of the chilled mirror. Weather balloons do the same: the radiosonde transmits pressure, temperature and relative humidity as it rises.[19] A dew point derived this way is least certain in dry air: in the Nebraska comparison the differences grew with the dew point depression, and Lin and Hubbard attributed those at large depressions to "the uncertainties of derived dew point temperature outputs."[13]
Moisture and thunderstorms
A thunderstorm is powered by the latent heat released as its updraft condenses water vapor, which is why forecasters look at low-level moisture before almost anything else. NWS Houston/Galveston's training page on thunderstorms gives the rules of thumb: "As a general rule, the surface dewpoint needs to be 55 degrees Fahrenheit or greater for a surface based thunderstorm to occur," and "Severe thunderstorms are more likely when the surface dewpoint is 55 F or higher, all else being equal." Low dew points "inhibit sufficient latent heat release and significantly reduce the tornado threat."[9] The same page grades moisture for supercells: under 55 °F low, 55 to 64 "semi-juicy," 65 to 74 "juicy," and over 75 "incredibly juicy."[9]
The numbers matter because of the saturation curve. A dew point of 55 °F is a mixing ratio of about 9.3 g/kg at sea level; 70 °F is 16.0 g/kg, almost twice the vapor and almost twice the latent heat. The Norman air above, at 72 °F, gave a surface parcel 4,892 J/kg of CAPE;[18] the lesson on CAPE and CIN explains the number. "The depth of moisture in the lower troposphere and the rate of moisture advection are also important to examine," the Houston page adds, and "the advection of higher dew point values into the boundary layer can increase instability in a severe weather situation." Along cold fronts it looks for "high dewpoints ahead of the front (60 F or greater)."[9]
East of the Rockies that moisture usually comes from one place. "Warm and moist air from the Gulf Stream or Gulf of Mexico increases latent instability," in the Houston page's words.[9] When a cold front sweeps the Gulf air out of the Plains, the return of southerly winds brings it back, and forecasters watch that moisture return on surface maps of dew point in the days before a severe weather event. Where the moist air meets dry air from the west, the two are separated by the dryline, in the AMS definition "a low-level mesoscale boundary or transition zone hundreds of kilometers in length and up to tens of kilometers in width separating dry air from moist air." In the United States it marks "the boundary between moist air from the Gulf of Mexico and dry continental air from the west" and is "most often present during the spring, where it is often the site of thunderstorm development."[1] The Houston page judges its strength by the dew point: "The higher the dewpoint gradient from one side of the dryline to the other is a good indication of dryline intensity."[9] A later lesson in the course is devoted to it.
The most humid air on record
The weather historian Christopher Burt, writing for Weather Underground in 2011, gave the highest dew point he knew of as "95° at Dhahran, Saudi Arabia at 3 p.m. on July 8, 2003," with a temperature of 108 °F and "a theoretical heat index of 176°." He gave the highest in the United States as "90° at Appleton, Wisconsin at 5 p.m. on July 13th," 1995, with the temperature at 101 °F and "a heat index reading of 148°." He also noted an 88 °F dew point at Moorhead, Minnesota on July 19, 2011, and cautioned that other claimed extremes "have not been vetted for accuracy."[14]
- Temperature, °C
- Dew point, °C
Table: Dhahran (OEDR), July 8, 2003, local time (UTC+3)
| Time | Temperature, °C | Dew point, °C | Relative humidity, % | Wet-bulb, °C | Weather |
|---|---|---|---|---|---|
| 12:00 am | 31 | 30 | 94 | 30.2 | |
| 1:00 am | 30 | 30 | 100 | 30.0 | BR |
| 2:00 am | 30 | 30 | 100 | 30.0 | |
| 3:00 am | 30 | 30 | 100 | 30.0 | FG |
| 4:00 am | 29 | 29 | 100 | 29.0 | FG |
| 5:00 am | 30 | 30 | 100 | 30.0 | FG |
| 6:00 am | 30 | 29 | 94 | 29.2 | FG |
| 7:00 am | 32 | 28 | 79 | 28.9 | |
| 8:00 am | 32 | 27 | 75 | 28.1 | HZ |
| 9:00 am | 35 | 29 | 71 | 30.3 | HZ |
| 10:00 am | 38 | 32 | 72 | 33.1 | |
| 11:00 am | 39 | 34 | 76 | 34.9 | |
| 12:00 pm | 40 | 34 | 72 | 35.0 | |
| 1:00 pm | 42 | 35 | 68 | 36.1 | |
| 2:00 pm | 43 | 33 | 58 | 34.8 | |
| 3:00 pm | 43 | 33 | 58 | 34.8 | |
| 4:00 pm | 41 | 35 | 72 | 36.0 | HZ |
| 5:00 pm | 38 | 33 | 76 | 33.9 | HZ |
| 6:00 pm | 36 | 32 | 80 | 32.8 | BR |
| 7:00 pm | 35 | 31 | 80 | 31.8 | BR |
| 8:00 pm | 35 | 31 | 80 | 31.8 | BR |
| 9:00 pm | 35 | 31 | 80 | 31.8 | |
| 10:00 pm | 34 | 31 | 84 | 31.6 | |
| 11:00 pm | 34 | 31 | 84 | 31.6 | |
| 12:00 am | 32 | 29 | 84 | 29.6 |
Table: Appleton (ATW), July 13, 1995, CDT
| Time | Temperature, °F | Dew point, °F | Relative humidity, % | Wet-bulb, °F | Weather |
|---|---|---|---|---|---|
| 5:30 am | 79 | 79 | 100 | 79 | FG |
| 6:00 am | 79 | 79 | 100 | 79 | FG |
| 7:00 am | 80 | 78 | 94 | 78 | FG |
| 8:00 am | 84 | 82 | 94 | 82 | FG |
| 9:00 am | 87 | 82 | 85 | 83 | FG |
| 10:00 am | 89 | 87 | 94 | 87 | FG |
| 12:00 pm | 94 | 88 | 83 | 89 | DZ |
| 1:00 pm | 96 | 87 | 75 | 89 | |
| 2:00 pm | 98 | 87 | 71 | 89 | |
| 3:00 pm | 100 | 89 | 71 | 91 | |
| 4:00 pm | 101 | 86 | 63 | 89 | |
| 5:00 pm | 101 | 90 | 71 | 92 | |
| 6:00 pm | 99 | 89 | 73 | 91 | |
| 7:00 pm | 96 | 85 | 71 | 87 | |
| 8:00 pm | 89 | 83 | 83 | 84 | |
| 9:00 pm | 87 | 81 | 83 | 82 | |
| 10:00 pm | 88 | 81 | 80 | 83 |
The archived reports support both figures, with one difference in the details. Dhahran's reports give temperatures and dew points in whole degrees Celsius, and the 35 °C dew point appears at 1000 UTC, 1 pm local time, with 42 °C (108 °F), and again at 4 pm with 41 °C; at 3 pm the report was 43 °C with a dew point of 33 °C. A whole-degree 35 °C could be anything from 34.5 to 35.4 °C. The Appleton report at 2200 UTC, 5 pm CDT, reads 101 °F with a 90 °F dew point, and its precise remark group gives 38.3 and 32.2 °C.[5]
Wet-bulb temperature and the limits of heat
A body sheds heat by sweating only if the sweat can evaporate, and the lowest temperature evaporation can reach is the wet-bulb temperature. When the wet-bulb temperature approaches skin temperature, sweating stops working. Sherwood and Huber (2010) put a number on it: "Peak heat stress, quantified by the wet-bulb temperature T(W), is surprisingly similar across diverse climates today. T(W) never exceeds 31 degrees C. Any exceedence of 35 degrees C for extended periods should induce hyperthermia in humans and other mammals, as dissipation of metabolic heat becomes impossible."[15]
- Constant wet-bulb temperature
- Wet-bulb 35 °C
- Saturation
Table: the plotted observations
| Observation | Temperature, °C | Dew point, °C | Pressure used, hPa | Wet-bulb, °C |
|---|---|---|---|---|
| Dhahran, 2003 | 42.0 | 35.0 | 995 | 36.1 |
| Appleton, 1995 | 38.3 | 32.2 | 978 | 33.3 |
| New Orleans | 35.0 | 22.8 | 1013 | 26.0 |
| Miami | 28.9 | 23.9 | 1013 | 25.2 |
| Phoenix | 40.6 | 14.4 | 975 | 22.7 |
| Las Vegas | 42.2 | 7.8 | 935 | 20.3 |
The chart shows why desert heat and humid heat are different hazards. Along each green line, dry heat and humid heat trade off: a wet-bulb temperature of 30.55 °C, a value that returns below, is reached at 36 °C with a dew point of about 29 °C, or at 40 °C with a dew point of about 28 °C. The line flattens as it nears saturation, so in humid air each extra degree of dew point counts for almost a full degree of wet-bulb temperature, while in dry air it counts for little.
Reports like Dhahran's are not unique. Raymond, Matthews and Horton (2020), examining weather station records worldwide, found that "some coastal subtropical locations have already reported a TW of 35°C and that extreme humid heat overall has more than doubled in frequency since 1979," and that "the most extreme humid heat is highly localized in both space and time."[17] Allowing for the rounding of its whole-degree reports, the Dhahran observation computed here lies between about 35.7 and 36.5 °C.[5]
The 35 °C limit is theoretical, and when it was finally tested it proved too generous. Vecellio and colleagues at Penn State (2022) measured the wet-bulb temperature at which young, healthy adults doing light activity could no longer keep their core temperature steady. "No subject's Twb,crit reached the 35°C limit." In humid environments of 36 to 40 °C the critical values "averaged 30.55 ± 0.98°C," and they fell further in hot, dry air, where heat gained directly from the air outpaced evaporative cooling. The authors conclude that "a wet-bulb temperature threshold cannot be applied to human adaptability across all climatic conditions and where appropriate (high humidity), that threshold is well below 35°C."[16] At 36 °C, a wet-bulb temperature of 30.55 °C corresponds to a dew point of about 29 °C (84 °F) and a relative humidity of 68 percent: humid, but not exotic.
Reading humidity: a checklist
- Read the dew point, not the relative humidity, whenever the question is how much moisture there is: comfort, storms, fog, rainfall potential.
- Compare it with the comfort scale: 55 °F and below dry, 55 to 65 °F sticky, 65 °F and above oppressive.
- Look at the depression, temperature minus dew point. Small means close to saturation: dew, fog or low clouds if the air cools, and a low cloud base if it rises.
- On a calm, clear evening, treat the dew point as a rough floor for the night's low, and the afternoon's lowest dew point, the crossover temperature, as the guide to fog.
- On a storm day, check that surface dew points are at least in the mid 50s °F, how deep the moist layer is on the sounding, and whether moisture is increasing.
- In heat, read the wet-bulb temperature or the heat index, which combine the two, and remember that the dangerous threshold for people is well below 35 °C.
Check yourself
-
At dawn the relative humidity is 95 percent; by 3 pm it is 40 percent. Did the air dry out?
Answer
Probably not. The temperature rose, which raised the saturation vapor pressure, so the ratio fell. Check the dew point: at Des Moines on September 7, 2025 it stayed within 5 °F all day while the relative humidity fell from 96 to 36 percent.
-
San Francisco reports 55 percent relative humidity and New Orleans 49 percent. Which air holds more water vapor?
Answer
New Orleans, at 95 °F with a dew point of 73 °F, holds about twice the vapor pressure of San Francisco at 69 °F with a dew point of 52 °F. Relative humidity cannot compare air at different temperatures; the dew point can.
-
By roughly how much does the most water vapor air can hold rise per degree Celsius of warming, and is the rate the same at all temperatures?
Answer
About 7 percent per degree near 0 °C, from the Clausius–Clapeyron relation. The rate falls as the air warms: 6.2 percent at 20 °C and 5.8 percent at 30 °C by Bolton's formula.
-
Why does dew form on grass before the air two meters up is saturated?
Answer
The grass cools by radiation faster than the air above it, and dew forms wherever a surface falls below the dew point of the air touching it. The thermometer in its shelter can still read a few degrees above the dew point.
-
The afternoon's lowest dew point is 48 °F, and the forecast low under clearing skies and calm wind is 44 °F. What does the crossover rule suggest?
Answer
Fog. The low is forecast to fall several degrees below the crossover temperature, which by the rule described by NWS Phoenix points to dense fog, provided there is little turbulent mixing.
-
Surface dew points on a spring afternoon in Oklahoma are in the mid 40s °F. What does that say about surface-based severe storms?
Answer
They are unlikely. NWS Houston/Galveston's rule of thumb is a surface dew point of 55 °F or more for a surface-based thunderstorm; low dew points limit the latent heat release and reduce the tornado threat. Elevated storms fed by moister air aloft are still possible.
-
Is a wet-bulb temperature of 32 °C survivable for a healthy person at rest?
Answer
Not for long. It is below the theoretical 35 °C limit of Sherwood and Huber, but above the mean critical value of 30.55 °C that Vecellio and colleagues measured for young, healthy adults doing light activity in humid heat.
Video


Methods
Surface observations are the routine and special reports of the Automated Surface Observing
System and, for Dhahran and for Appleton in 1995, the METAR reports archived by the Iowa
Environmental Mesonet, used as archived: temperatures and dew points in whole degrees
Fahrenheit or Celsius, or in tenths where the report's remark group gives them. Saturation
vapor pressure is Bolton's formula over liquid water, as given in the AMS glossary; relative
humidity is the ratio of the saturation vapor pressures at the dew point and at the
temperature; the mixing ratio is 0.622 e / (p − e); absolute humidity uses
a gas constant for water vapor of 461.5 J kg⁻¹ K⁻¹. Wet-bulb temperature is the isobaric
(psychrometric) wet-bulb temperature, solved by bisection from the balance between the heat
given up by the air and the latent heat taken up by evaporation, with a latent heat that
varies with temperature, at the station pressure where the report has an altimeter setting and
at 1000 hPa for the lines on the chart. Rounding of whole-degree reports is tested by
recomputing at both ends of each value's range. Precipitable water is integrated from the
surface to 300 hPa. The crossover temperature is the lowest dew point reported between noon and
5 pm. The code and the data are in the site's repository, under scripts/learn/.
Related
The dew point trace, the mixing ratio lines and the cloud base are put to work in How to read a skew-T diagram. The previous lessons in the unit cover air pressure and temperature and heat; the next, how clouds form, follows moist air up to the point where it condenses. For the moisture that feeds tornadic storms, see How tornadoes form. Current dew points and relative humidity for stations across the country are on the observations page, and unfamiliar terms are in the glossary.
Sources
Quotations are verbatim from the source named. Figures and table values marked "computed here" are described under Methods.
- American Meteorological Society, Glossary of Meteorology, entries water vapor, vapor pressure, saturation vapor pressure, saturation, Clausius–Clapeyron equation, humidity, dewpoint, relative humidity, mixing ratio, specific humidity, vapor density (absolute humidity), wet-bulb temperature, precipitable water, heat index, dew, hoarfrost, radiation fog, psychrometer, sling psychrometer, hygrometer, dewpoint hygrometer and dryline.
- National Weather Service La Crosse, WI, Dew Point vs Humidity.
- Douville, H., et al., 2021: Water Cycle Changes, chapter 8 of Climate Change 2021: The Physical Science Basis, IPCC Sixth Assessment Report, Working Group I: section 8.2.1 and the executive summary.
- Bolton, D., 1980: The computation of equivalent potential temperature. Monthly Weather Review, 108, 1046–1053, as given in the AMS glossary entry for the Clausius–Clapeyron equation.
- Iowa Environmental Mesonet, Iowa State University, ASOS and METAR archive: Des Moines (DSM) September 2025; Phoenix (PHX) January 8 to 9, 2003; twelve US airports July 15, 2025; Fairbanks (PAFA) January 2025; Dhahran (OEDR) July 7 to 9, 2003; Appleton (ATW) July 12 to 14, 1995.
- University of Wyoming, Department of Atmospheric Science, upper-air soundings: Norman, OK (72357), 18 UTC May 20, 2013.
- Jeff Haby, Dew and Frost Development, National Weather Service Houston/Galveston training pages.
- Doug Green, NWS Phoenix, Dense Fog over South-Central Arizona on 9 January 2003 and the UPS Radiation Fog Paper, NWS Western Region Technical Attachment Lite 03-20, citing R. Baker, J. Cramer and J. Peters, 2002: Radiation Fog: UPS Airlines Conceptual Models and Forecast Methods.
- Jeff Haby, Thunderstorm Ingredients, National Weather Service Houston/Galveston training pages.
- National Weather Service, Office of Operational Systems, ASOS Product Improvement Implementation Plan, Addendum II, for Dew Point Sensor Upgrade, August 16, 2002.
- Jennifer M. Dover and Barbra Childs, A New Low Maintenance Dew Point Sensor for the National Weather Service (NWS) Automated Surface Observing System (ASOS), American Meteorological Society conference paper 14.3.
- National Weather Service, ASOS Current Events: temperature and dew point sensor replacement.
- X. Lin and K. G. Hubbard, Comparison of ASOS Dew Point Temperatures: HO-1088 and DTS1, 84th AMS Annual Meeting, 2004, paper 4.2.
- Christopher C. Burt, Weather Underground, Record Dew Point Temperatures, August 11, 2011.
- Steven C. Sherwood and Matthew Huber, 2010: An adaptability limit to climate change due to heat stress. Proceedings of the National Academy of Sciences, 107, 9552–9555.
- Daniel J. Vecellio, S. Tony Wolf, Rachel M. Cottle and W. Larry Kenney, 2022: Evaluating the 35°C wet-bulb temperature adaptability threshold for young, healthy subjects (PSU HEAT Project). Journal of Applied Physiology, 132, 340–345.
- Colin Raymond, Tom Matthews and Radley M. Horton, 2020: The emergence of heat and humidity too severe for human tolerance. Science Advances, 6, eaaw1838.
- WeatherOverTime, How to read a skew-T diagram, for the Norman cloud base and CAPE and the Corpus Christi precipitable water.
- National Weather Service, Radiosonde Observation, upper-air fact sheet.
- Steve Hillebrand, U.S. Fish and Wildlife Service, The morning dew gently rests on the fern leaf, via Wikimedia Commons, public domain.
- CambridgeBayWeather, Sling psychrometer, Wikimedia Commons, public domain.
- WCPO 9, Weather 101: Relative Humidity vs. Dew Point, YouTube.
- NEWS CENTER Maine, EXPLAINER: Humidity vs. Dewpoint, YouTube.
- Grist, The temperature threshold the human body can't survive, YouTube.


Corrections: contact@weatherovertime.com.
Unit 1: The atmosphere
- Layers of the atmosphere
Troposphere to thermosphere, and why weather happens in the lowest layer.
- Air pressure
What pressure is, how it is measured, and why it falls with height.
- Temperature and heat
How the sun heats the ground, the ground heats the air, and the day warms and cools.
- Dew point and humidity
Why dew point, not relative humidity, is the number forecasters watch.
- How clouds form and how to name them
Condensation, cloud bases, and the ten cloud genera.