Space Weather Now
NOAA’s scales stand at R0, S0 and G0 for the past 24 hours, the Sun’s X-ray output is B5.1 class, the planetary K index is 2+. 3 SWPC messages are in force. Every reading below is from NOAA’s Space Weather Prediction Center, read Sep 24, 16:11 UTC.
HF radio absorption right now
SWPC’s D-Region Absorption Prediction: the highest radio frequency that loses a decibel of signal crossing the lowest layer of the ionosphere, valid Sep 24, 16:07 UTC. X-ray flares darken the sunlit side; solar protons darken the polar caps.
The strongest absorption is at 15°N, 66°W, where radio below 2.1 MHz loses a decibel or more crossing the lower ionosphere; 26% of the globe has absorption above 1 MHz.

- 1 MHz
- 5 MHz
- 10 MHz
- 15 MHz
- 20 MHz
- 25 MHz
- 30 MHz
- 35 MHz
- X-ray
- Normal X-ray Background
- Protons
- Normal Proton Background
- Estimated recovery
- No Estimate
Now
The highest level on each of NOAA’s three scales over the past 24 hours, and the readings behind them.
- Radio blackouts
- R0 None
- Radiation storms
- S0 None
- Geomagnetic storms
- G0 None
- X-ray flux now
- B5.1 class (5.1e-7 W/m²), Sep 24, 16:06 UTC
- Largest flare in 7 days
- C3.7, peaking Sep 20, 22:34 UTC
- Protons, 10 MeV and up
- 0.27 pfu, below S1 (10 pfu)
- Planetary Kp
- 2+ (2.33), estimated
- Solar wind speed
- 383 km/s
- Solar wind density
- 7.6 protons/cm³
- Field Bz
- -4.9 nT
| Day | R1 to R2 | R3 or more | S1 or more | G level |
|---|---|---|---|---|
| Sep 24 | 20% | 1% | 1% | G1 |
| Sep 25 | 20% | 1% | 1% | G0 |
| Sep 26 | 20% | 1% | 1% | G0 |
The day before: R0, S0, G0.
Alerts in force
SWPC’s watches, warnings, alerts and summaries, in the forecasters’ own words.
- EXTENDED WARNING: Geomagnetic K-index of 4 expectedIn force Sep 24, 09:44 UTC to Sep 24, 21:00 UTC · Geomagnetic storms
Extension to Serial Number: 5419 Valid From: 2026 Sep 24 0944 UTC Now Valid Until: 2026 Sep 24 2100 UTC Warning Condition: Persistence
Potential Impacts: Area of impact primarily poleward of 65 degrees Geomagnetic Latitude. Induced Currents - Weak power grid fluctuations can occur. Aurora - Aurora may be visible at high latitudes such as Canada and Alaska.
- ALERT: Geomagnetic K-index of 4Issued Sep 24, 09:52 UTC · Geomagnetic storms
Threshold Reached: 2026 Sep 24 0945 UTC Synoptic Period: 0900-1200 Active Warning: YES
Potential Impacts: Area of impact primarily poleward of 65 degrees Geomagnetic Latitude. Induced Currents - Weak power grid fluctuations can occur. Aurora - Aurora may be visible at high latitudes such as Canada and Alaska.
- WATCH: Geomagnetic Storm Category G1 PredictedIn force until Sep 25, 00:00 UTC · Geomagnetic storms
Highest Storm Level Predicted by Day: Sep 22: None (Below G1) Sep 23: None (Below G1) Sep 24: G1 (Minor) THIS SUPERSEDES ANY/ALL PRIOR WATCHES IN EFFECT
Potential Impacts: Area of impact primarily poleward of 60 degrees Geomagnetic Latitude. Induced Currents - Weak power grid fluctuations can occur. Spacecraft - Minor impact on satellite operations possible. Aurora - Aurora may be visible at high latitudes, i.e., northern tier of the U.S. such as northern Michigan and Maine.
Every message of the past seven days (1)
- WARNING: Geomagnetic K-index of 4 expectedIn force Sep 24, 09:44 UTC to Sep 24, 15:00 UTC · Geomagnetic storms
Valid From: 2026 Sep 24 0944 UTC Valid To: 2026 Sep 24 1500 UTC Warning Conditions: Onset
Potential Impacts: Area of impact primarily poleward of 65 degrees Geomagnetic Latitude. Induced Currents - Weak power grid fluctuations can occur. Aurora - Aurora may be visible at high latitudes such as Canada and Alaska.
Solar flares
GOES-18 X-ray flux, the peak of each step. A flare of M1 or more is an R1 radio blackout on the sunlit side of the Earth.
35 flares in the past seven days: 0 X class, 0 M class and 10 C class.
- 1 to 8 Å, the flare class channel
- 0.5 to 4 Å
- 1 to 8 Å, the flare class channel
- 0.5 to 4 Å
- 1 to 8 Å, the flare class channel
- 0.5 to 4 Å
- 1 to 8 Å, the flare class channel
- 0.5 to 4 Å
The largest flares in the past seven days
| Peak (UTC) | Class | Began | Ended | Radio blackout |
|---|---|---|---|---|
| Sep 23, 15:32 UTC | C1.1 | 15:22 | 15:35 | Below R1 |
| Sep 23, 11:31 UTC | C1.6 | 11:14 | 11:45 | Below R1 |
| Sep 23, 06:21 UTC | C1.3 | 06:08 | 06:37 | Below R1 |
| Sep 22, 17:58 UTC | C1.1 | 17:43 | 18:50 | Below R1 |
| Sep 22, 17:20 UTC | C2.4 | 17:11 | 17:25 | Below R1 |
| Sep 22, 04:51 UTC | C2.0 | 04:27 | 05:01 | Below R1 |
| Sep 21, 06:29 UTC | C1.2 | 06:21 | 06:35 | Below R1 |
| Sep 21, 01:13 UTC | C1.1 | 00:59 | 01:25 | Below R1 |
| Sep 20, 22:34 UTC | C3.7 | 22:25 | 22:43 | Below R1 |
| Sep 19, 18:17 UTC | C3.3 | 17:57 | 18:32 | Below R1 |
Solar radiation
GOES integral protons, the peak of each step. A radiation storm is measured at 10 MeV and up; the S levels are marked.
The 10 MeV proton flux is 0.27 pfu, below the 10 pfu that makes an S1 radiation storm, at Sep 24, 16:00 UTC.
- 10 MeV and up, the S scale channel
- 100 MeV and up
- 10 MeV and up, the S scale channel
- 100 MeV and up
- 10 MeV and up, the S scale channel
- 100 MeV and up
- 10 MeV and up, the S scale channel
- 100 MeV and up
The solar wind
SWPC’s real-time solar wind, ten-minute steps over the past day.
The solar wind is blowing at 383 km/s with 7.6 protons per cm³, and the field’s north-south component Bz is -4.9 nT, measured by SOLAR1 at Sep 24, 16:04 UTC.
Speed
- Speed, km/s
Density
- Density, protons/cm³
Magnetic field
- Bz, most southward in each step, nT
- Bt, nT
Measured about 1.5 million km upstream at the L1 point, which the wind crosses 30 to 90 minutes before it reaches Earth. A strongly southward Bz, negative, is what lets it pour energy into the Earth’s field; fast wind with a southward Bz is how a storm builds. The aurora section reads the same wind for tonight’s aurora.
The Sun right now
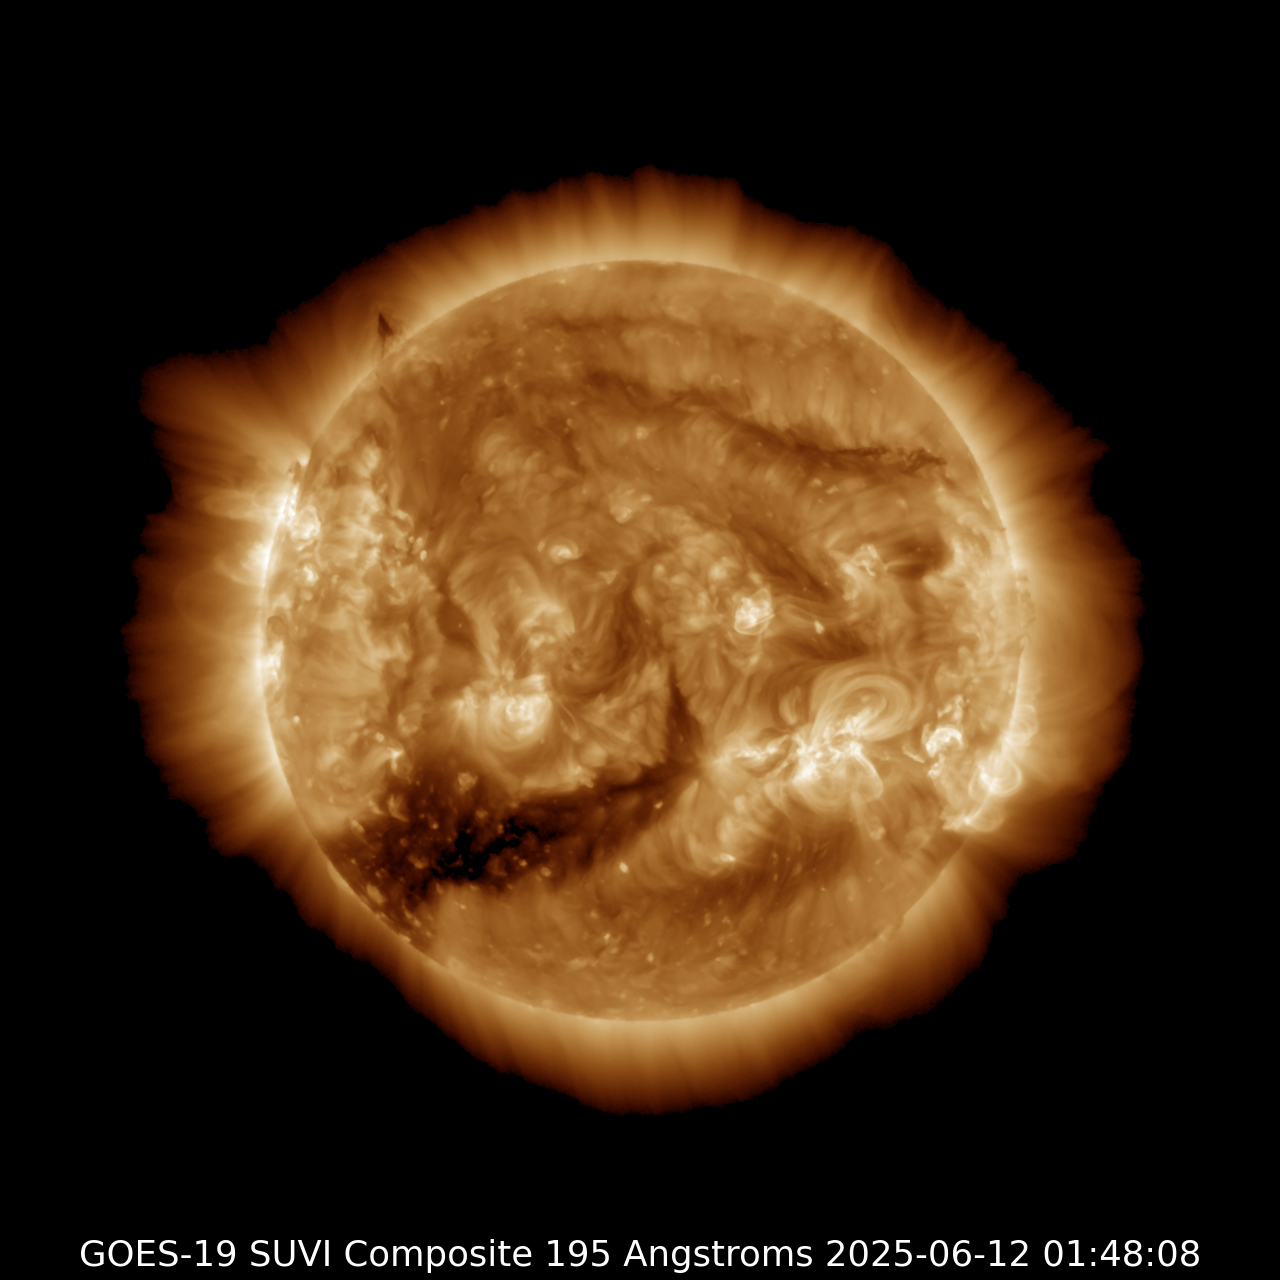
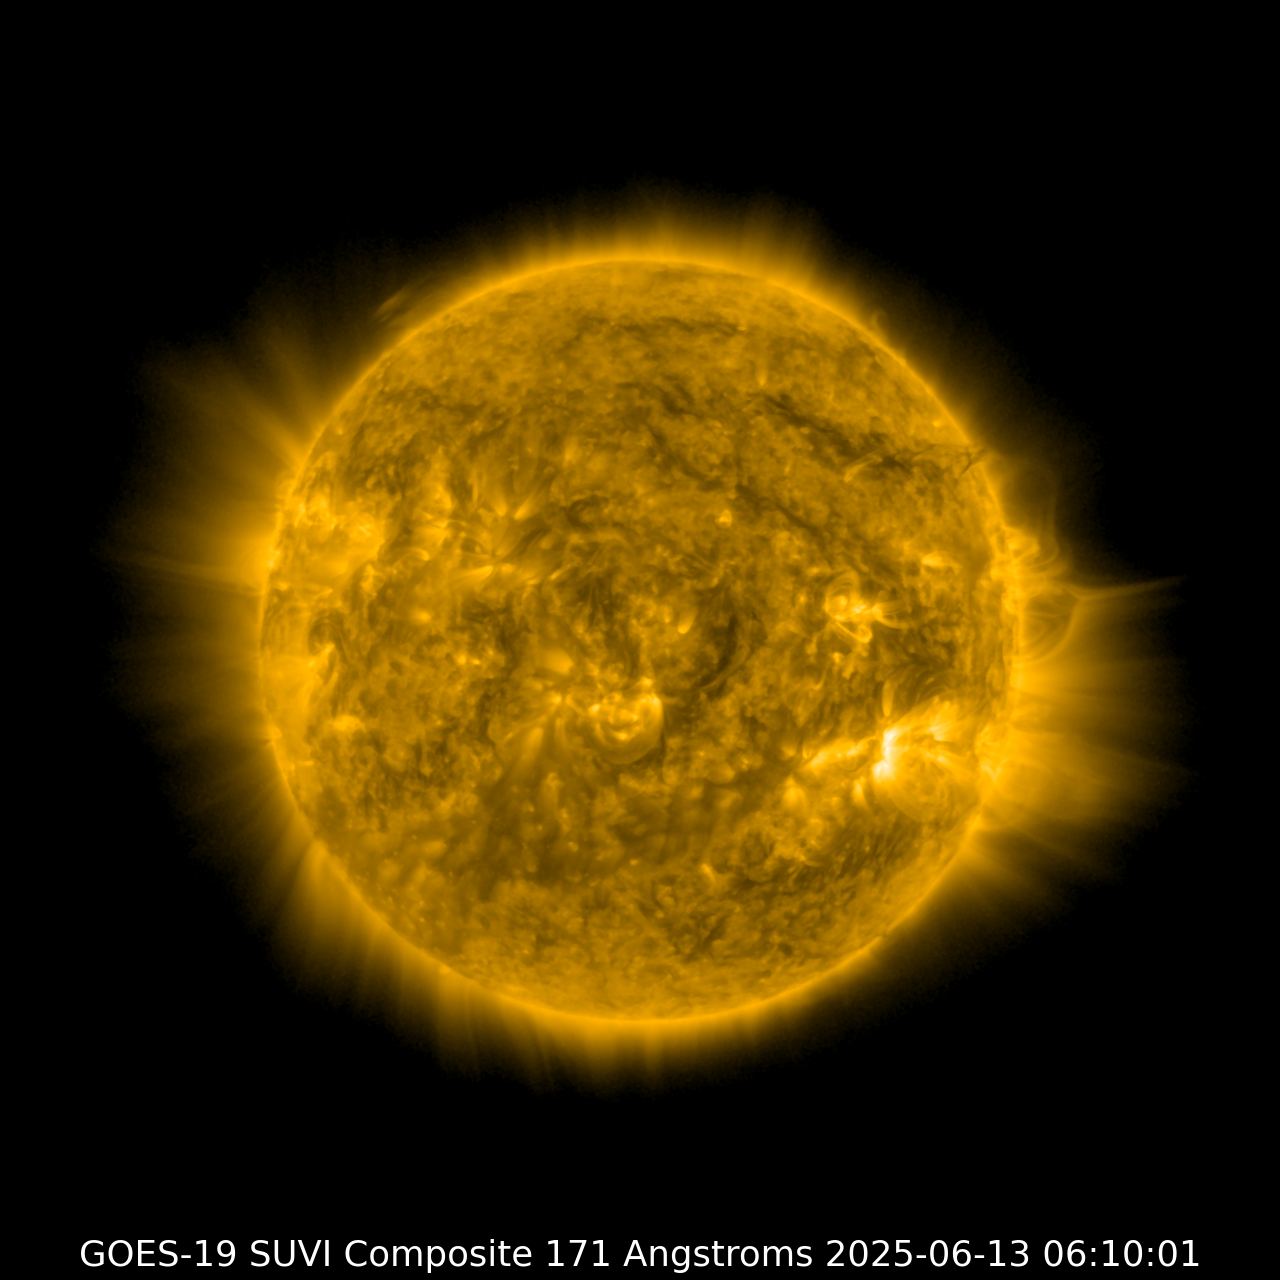
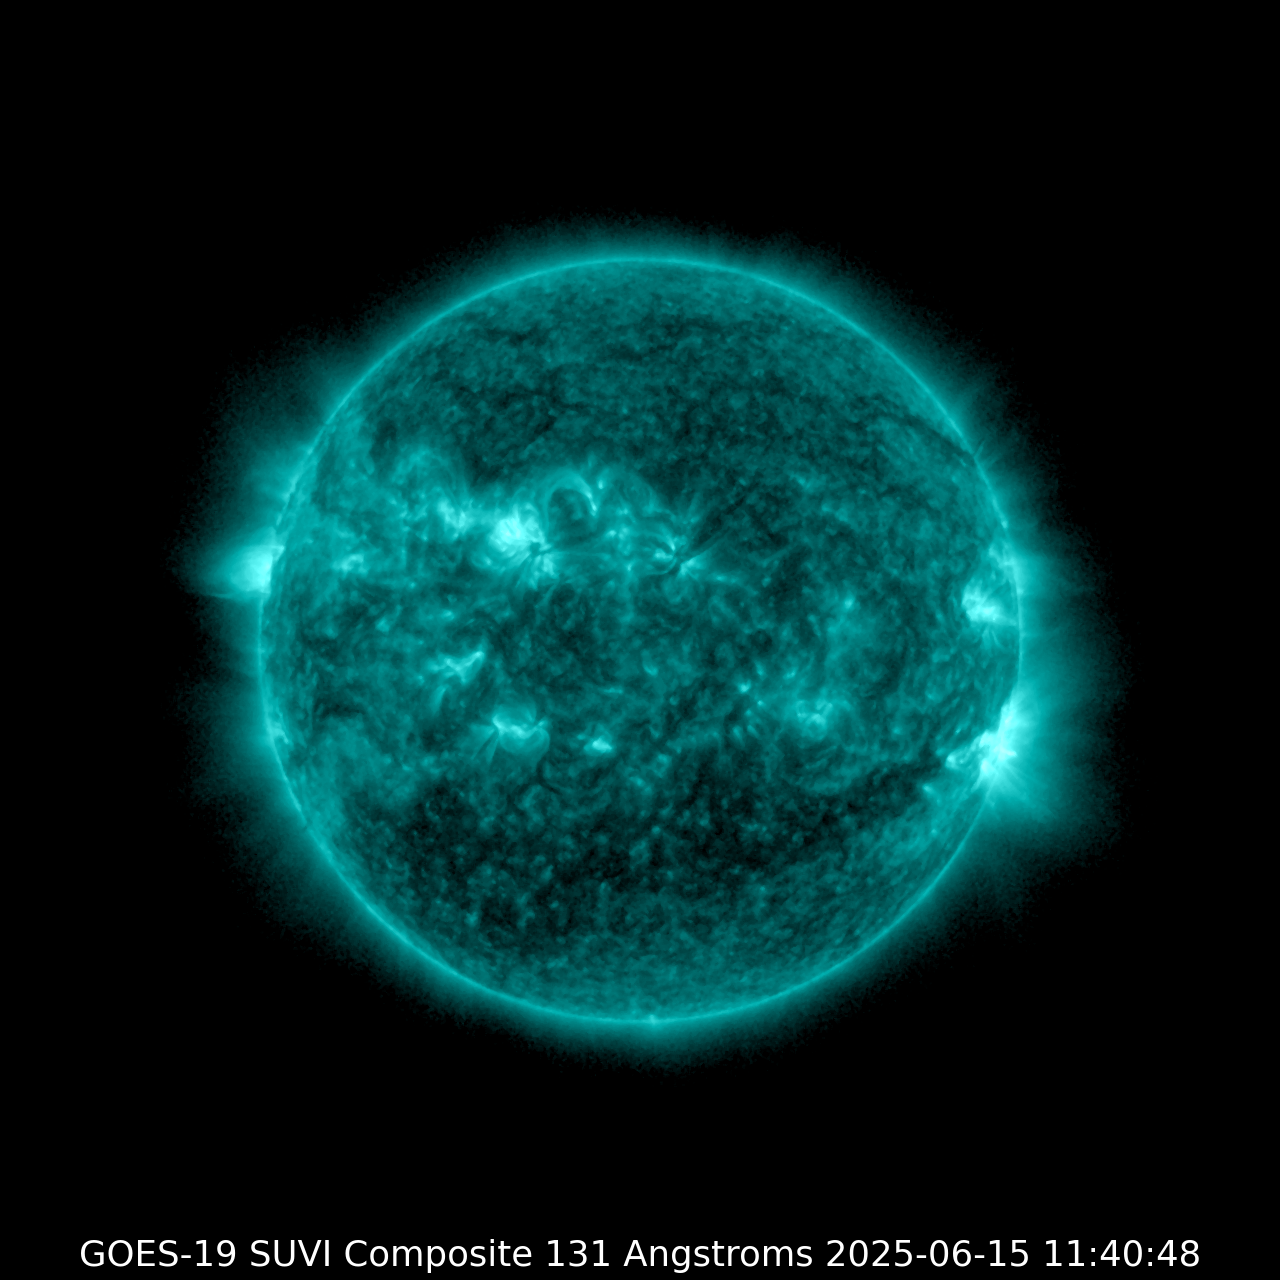
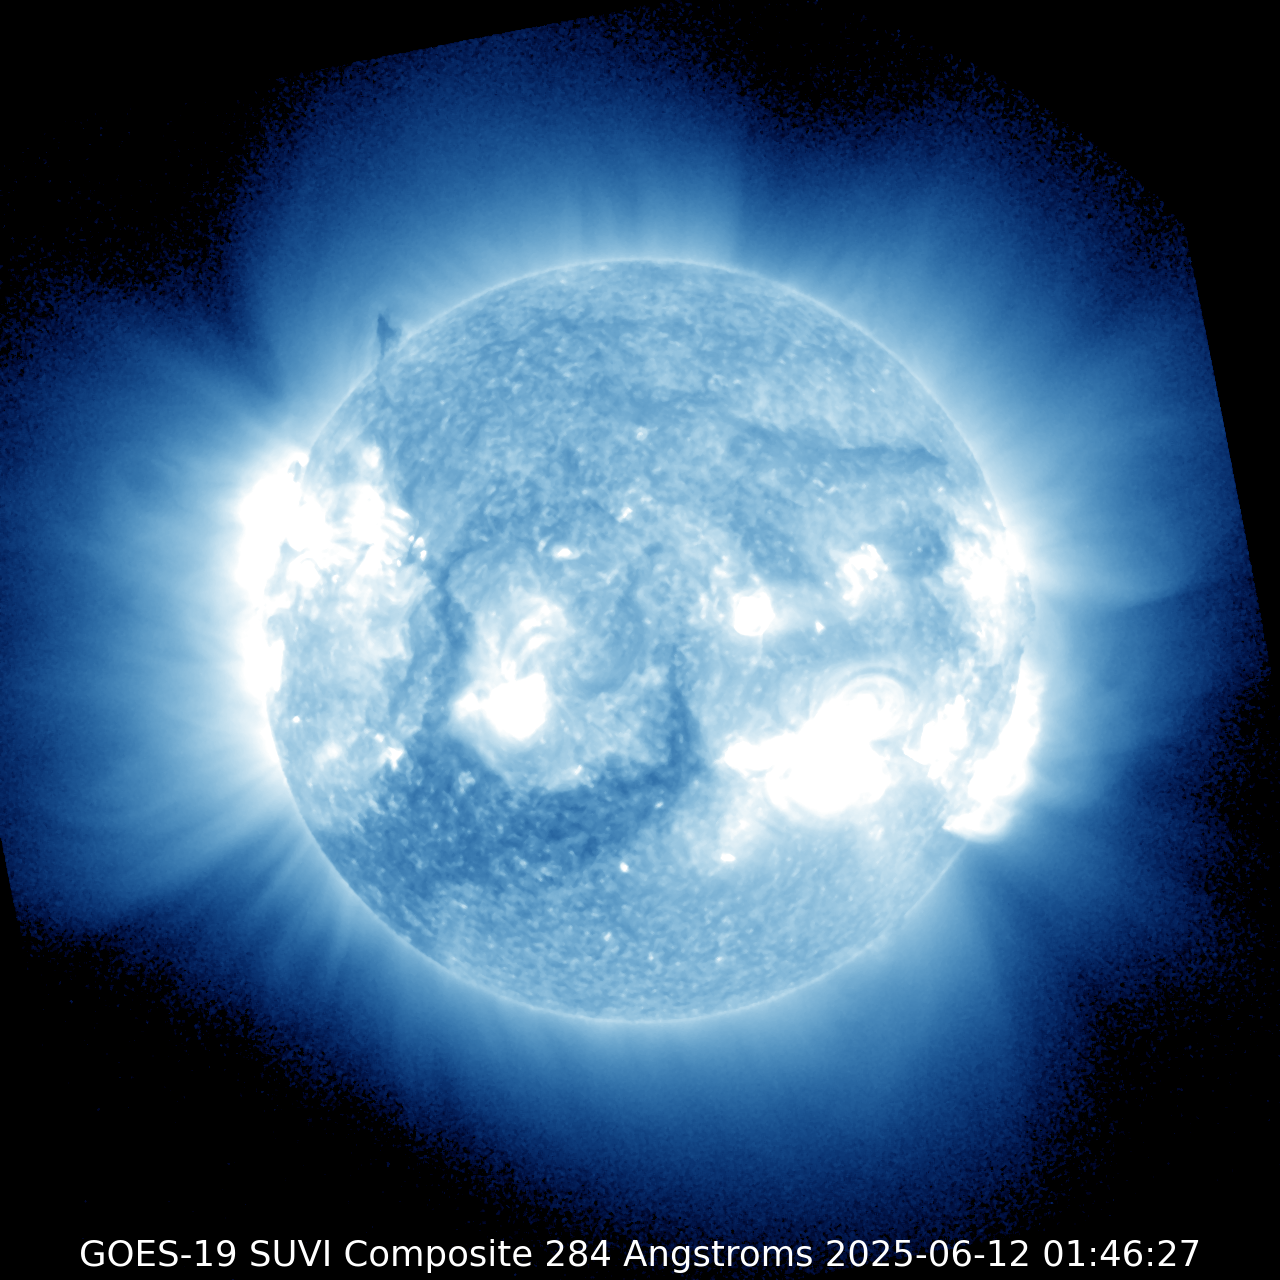
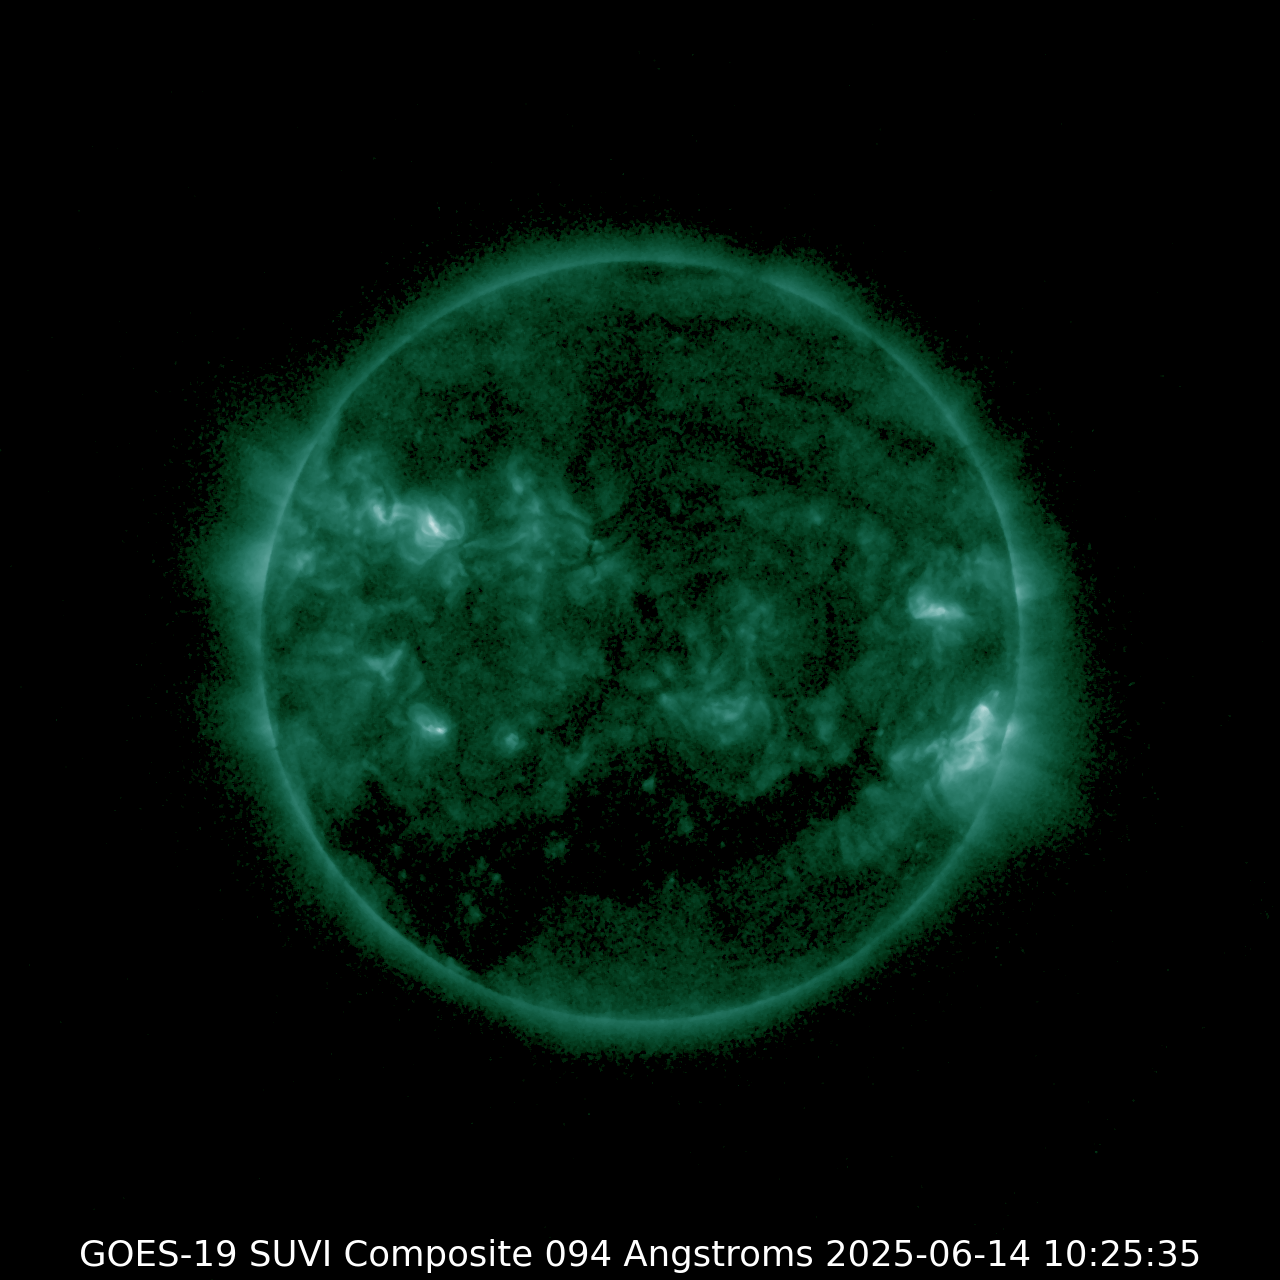
The Solar Ultraviolet Imager on the primary GOES satellite, a new picture every four minutes in six extreme ultraviolet channels. Bright knots are active regions, where flares come from; dark patches in the corona are coronal holes, the source of fast solar wind.
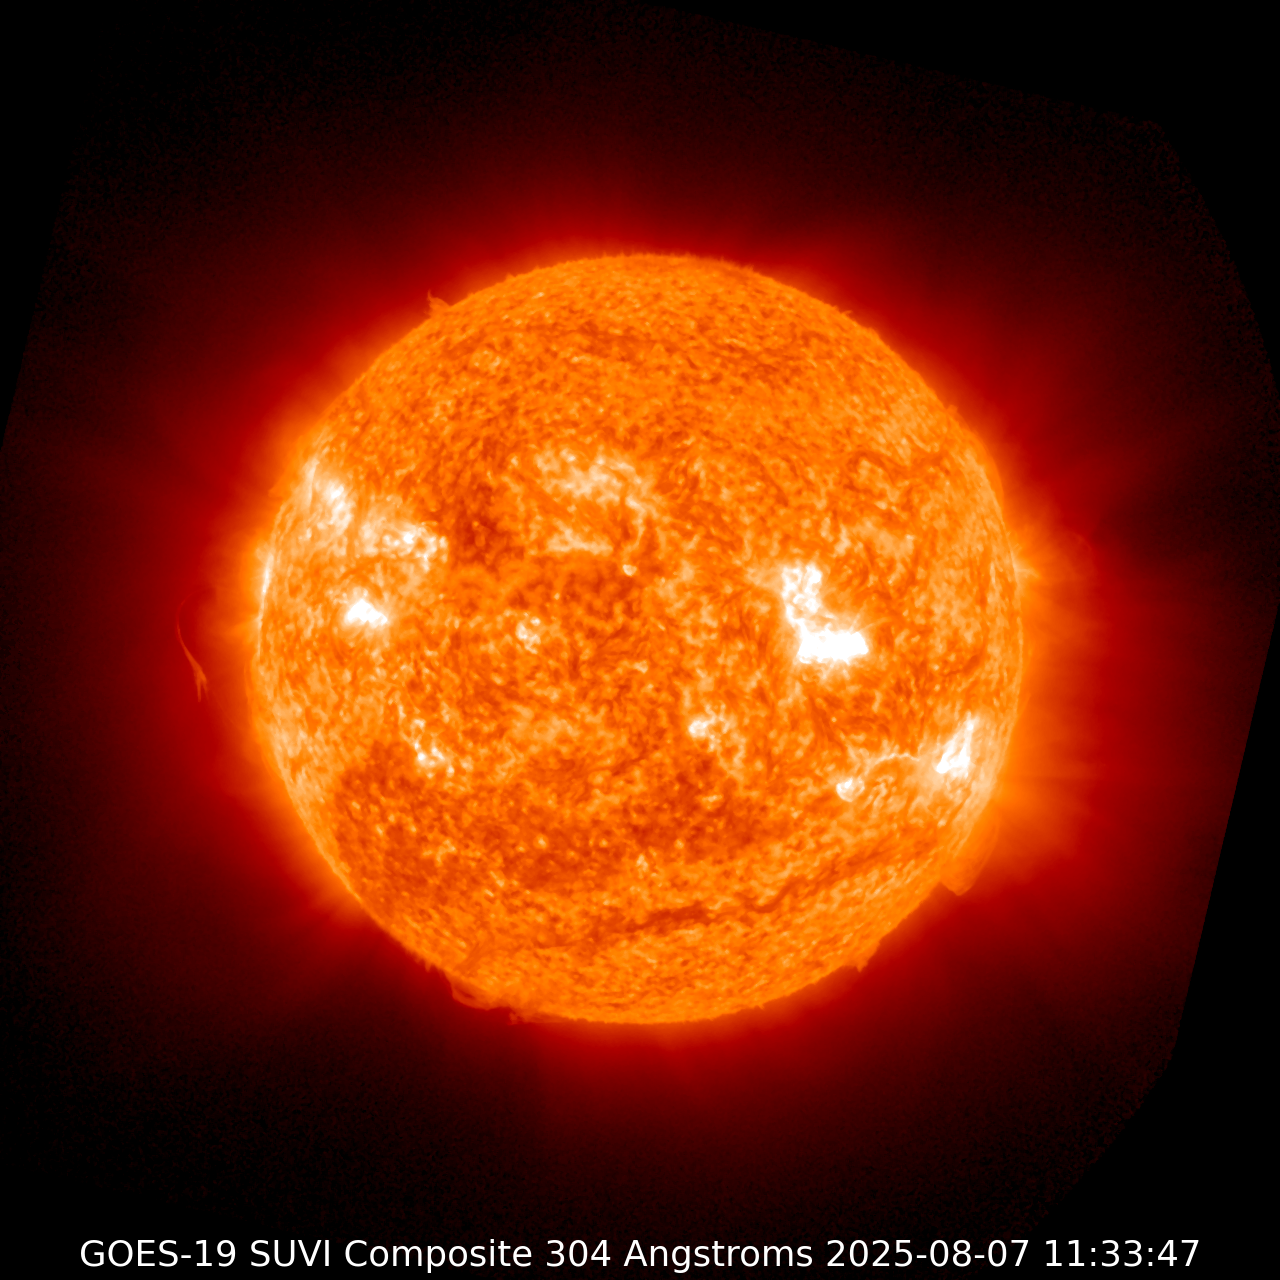
- 304 Å
- helium at about 50,000 K: the chromosphere, filaments and prominences
- 195 Å
- iron at about 1.5 million K: the corona, active regions and dark coronal holes
- 171 Å
- iron at about 700,000 K: the quiet corona and coronal loops
- 131 Å
- iron at about 10 million K: the hottest flaring plasma
- 284 Å
- iron at about 2 million K: coronal holes
- 094 Å
- iron at about 6 million K: flaring regions
SWPC’s 3-day forecast
In the forecasters’ own words, issued Sep 24, 12:30 UTC.
The geomagnetic field
The greatest observed 3 hr Kp over the past 24 hours was 4 (below NOAA Scale levels). The greatest expected 3 hr Kp for Sep 24-Sep 26 2026 is 4.67 (NOAA Scale G1).
Rationale: G1 (Minor) geomagnetic storming is likely on 24 Sep due to positive polarity CH HSS influences. Unsettled to active levels are expected to persist on 25 and 26 Sep as HSS effects gradually wane.
Solar radiation
Solar radiation, as observed by NOAA GOES-18 over the past 24 hours, was below S-scale storm level thresholds.
Rationale: No S1 (Minor) or greater solar radiation storms are expected. No significant active region activity favorable for radiation storm production is forecast.
Radio blackouts
No radio blackouts were observed over the past 24 hours.
Rationale: There is a slight chance for R1-R2 (Minor-Moderate) radio blackouts through 26 Sep primarily due to the flare potential of Active Regions 4536, 4538, and 4537.
| Chance of | Sep 24 | Sep 25 | Sep 26 |
|---|---|---|---|
| Radio blackout, R1 to R2 | 20% | 20% | 20% |
| Radio blackout, R3 or greater | 1% | 1% | 1% |
| Solar radiation storm, S1 or greater | 1% | 1% | 1% |
The Kp forecast by three-hour block, and what it means for the aurora town by town, is on the aurora forecast.
The 27-day outlook
SWPC’s outlook for the next four weeks, issued Sep 21, 03:17 UTC, built largely on the Sun’s 27-day rotation: active regions and coronal holes that faced Earth last rotation are expected to face it again.
The most active day expected is Sep 25, with a largest Kp of 5 and an Ap of 18; the 10.7 cm radio flux is expected to peak at 115 on Sep 30.
| Day (UTC) | 10.7 cm flux | Ap | Largest Kp |
|---|---|---|---|
| Sep 24 | 100 | 20 | 4 |
| Sep 25 | 105 | 18 | 5 |
| Sep 26 | 105 | 12 | 3 |
| Sep 27 | 100 | 8 | 3 |
| Sep 28 | 105 | 5 | 2 |
| Sep 29 | 110 | 5 | 2 |
| Sep 30 | 115 | 5 | 2 |
| Oct 1 | 115 | 5 | 2 |
| Oct 2 | 110 | 5 | 2 |
| Oct 3 | 105 | 5 | 2 |
| Oct 4 | 110 | 12 | 3 |
| Oct 5 | 110 | 15 | 4 |
| Oct 6 | 115 | 12 | 4 |
| Oct 7 | 115 | 10 | 3 |
| Oct 8 | 110 | 8 | 3 |
| Oct 9 | 105 | 5 | 2 |
| Oct 10 | 110 | 5 | 2 |
| Oct 11 | 100 | 9 | 3 |
| Oct 12 | 97 | 8 | 3 |
| Oct 13 | 96 | 8 | 3 |
| Oct 14 | 95 | 8 | 3 |
| Oct 15 | 100 | 5 | 2 |
| Oct 16 | 105 | 5 | 2 |
| Oct 17 | 100 | 5 | 2 |
The solar cycle
SWPC’s own monthly sunspot count since Jan 1997, and its prediction to Dec 2030. Flares, radiation storms and the strongest geomagnetic storms cluster around the maximum of each roughly eleven-year cycle.
Solar cycle 25’s smoothed sunspot number peaked at 153.6 in Oct 2024 on SWPC’s count, and stood at 100.8 in Feb 2026, the latest month a 13-month average can be taken for.
- Monthly sunspot number (SWPC)
- 13-month smoothed
- SWPC’s prediction
Geomagnetic storms since 1932
From GFZ Potsdam’s Kp record, three-hourly since January 1932.
4,139 geomagnetic storms of G1 or more are on record since 1932, 70 of them G5.
The strongest
- G5 (Extreme) Geomagnetic Storm of November 12, 1960
- G5 (Extreme) Geomagnetic Storm of October 29, 2003
- G5 (Extreme) Geomagnetic Storm of March 23, 1940
- G5 (Extreme) Geomagnetic Storm of September 18, 1941
- G5 (Extreme) Geomagnetic Storm of March 13, 1989
- G5 (Extreme) Geomagnetic Storm of October 5, 1960
- G5 (Extreme) Geomagnetic Storm of August 4, 1972
- G5 (Extreme) Geomagnetic Storm of May 10, 2024
The latest
What this means
NOAA rates space weather on three scales of five levels each. R is for radio blackouts, caused by the X-rays of a solar flare, which reach Earth in eight minutes and darken HF radio on the sunlit side. S is for solar radiation storms, energetic protons that arrive in tens of minutes to hours and hit the polar regions, aircraft on polar routes, astronauts and satellites. G is for geomagnetic storms, driven by a coronal mass ejection or a fast stream of solar wind a day to four days after it leaves the Sun, which push the aurora toward the equator and can disturb power grids and satellite navigation.
Radio blackouts
| Level | Flare | What it does |
|---|---|---|
| R1 Minor | M1 | Weak or minor degradation of HF radio on the sunlit side, occasional loss of contact. |
| R2 Moderate | M5 | Limited HF blackout on the sunlit side, loss of contact for tens of minutes. |
| R3 Strong | X1 | Wide-area HF blackout for about an hour on the sunlit side; low-frequency navigation degraded. |
| R4 Severe | X10 | HF blackout on most of the sunlit side for one to two hours; outages of satellite navigation. |
| R5 Extreme | X20 | Complete HF blackout on the entire sunlit side for hours; no HF contact with ships and aircraft there. |
Solar radiation storms
| Level | 10 MeV protons | What it does |
|---|---|---|
| S1 Minor | 10 pfu | Minor impacts on HF radio in the polar regions. |
| S2 Moderate | 100 pfu | Elevated radiation risk to passengers and crew on high-latitude flights; infrequent single-event upsets on satellites. |
| S3 Strong | 1,000 pfu | Radiation hazard to astronauts outside a spacecraft; degraded HF radio through the polar regions. |
| S4 Severe | 10,000 pfu | Memory upsets on satellites, star-tracker problems; blackout of HF radio through the polar regions. |
| S5 Extreme | 100,000 pfu | Unavoidable high radiation hazard to astronauts; satellites may be rendered useless. |
Geomagnetic storms
| Level | Kp | Aurora |
|---|---|---|
| G1 Minor | 5 | Reaches about 60° geomagnetic latitude; commonly visible at high latitudes: northern Michigan and Maine. |
| G2 Moderate | 6 | Reaches about 55° geomagnetic latitude; has been seen as low as New York and Idaho. |
| G3 Strong | 7 | Reaches about 50° geomagnetic latitude; has been seen as low as Illinois and Oregon. |
| G4 Severe | 8 | Reaches about 45° geomagnetic latitude; has been seen as low as Alabama and northern California. |
| G5 Extreme | 9 | Reaches about 40° geomagnetic latitude; has been seen as low as Florida and southern Texas. |
From NOAA’s space weather scales.
Sources
NOAA Space Weather Prediction Center: the NOAA scales, GOES X-ray flux and flares, GOES integral protons, the real-time solar wind from L1, D-RAP, SUVI imagery, its watches, warnings and alerts, the 3-day forecast, the 27-day outlook and its solar cycle progression, all US government works. The sunspot numbers are SWPC’s own count; the international sunspot number, from SILSO at the Royal Observatory of Belgium, is licensed for non-commercial use only and is not shown. Read Sep 24, 16:11 UTC.