The jet stream
About ten kilometers up, where airliners cruise, the wind blows far harder than anywhere near the ground. It gathers into narrow rivers of air that circle each hemisphere from west to east, meander north and south, and reach 100 m/s on the strongest winter days. They steer storms, split the weather into cold and warm sides, add an hour to some westbound flights and set off the bumps of clear-air turbulence. This lesson explains what the jet stream is, how it was found, why it exists, where it sits and how it moves through the year, what jet streaks do, and how a separate jet near the ground feeds the night storms of the Great Plains. The examples are real: a weather-balloon record over Japan, a winter night when an airliner crossed Pennsylvania at 801 mph over the ground, thirty years of reanalysis, a summer of Oklahoma soundings and every nonstop flight between New York and Los Angeles in 2024.
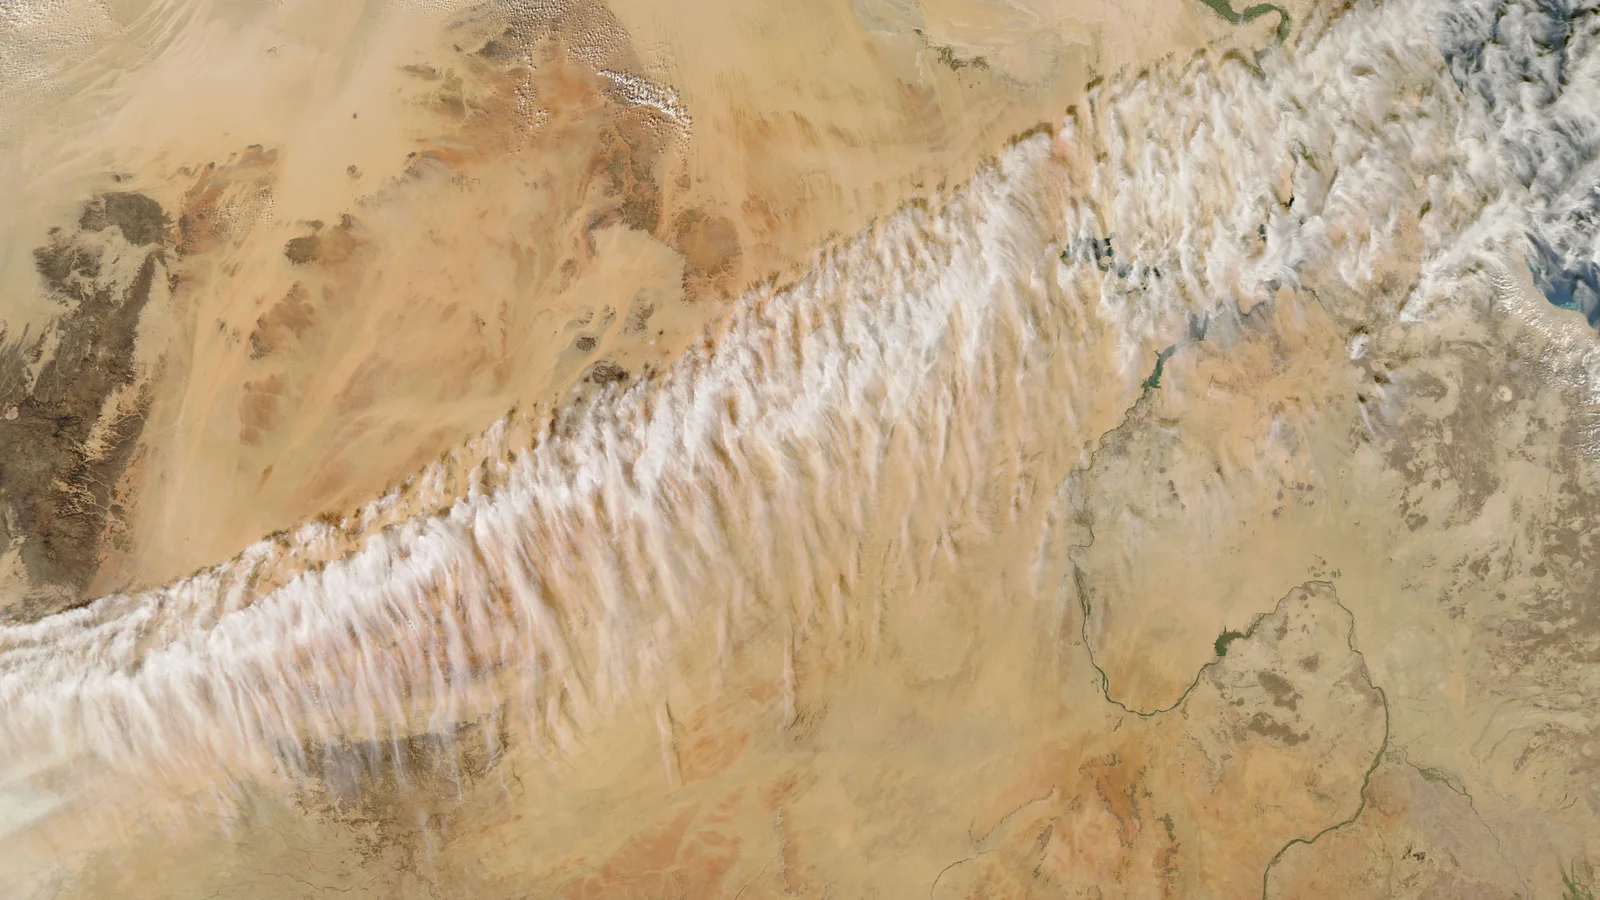
- What the jet stream is, in the AMS and WMO definitions, and how it was found.
- Why it exists: the temperature contrast between the tropics and the poles and the thermal wind, worked through with real balloon data.
- The polar-front and subtropical jets, where each sits, the tropopause break and the seasons, from thirty years of reanalysis.
- Jet streaks and the four-quadrant model of divergence.
- The low-level jet of the Great Plains, a different wind with a different cause.
- Aviation and severe weather: flight times, turbulence, tornadoes and the records.
What the jet stream is
The American Meteorological Society defines a jet stream as "relatively strong winds concentrated within a narrow stream in the atmosphere." The term can apply to such a stream in any direction, the AMS notes, but "it is coming more and more to mean only a quasi-horizontal jet stream of maximum winds embedded in the midlatitude westerlies, and concentrated in the high troposphere."[1] The westerlies are the prevailing west-to-east flow of the middle latitudes, and "even the annual average westerlies are markedly enhanced in some regions, namely, the jet streams."[1]
The World Meteorological Organization gives the jet stream dimensions and a speed. As summarized by the meteorologist Elmar Reiter, jet streams by the WMO definition "are air currents with quasihorizontal axes, thousands of km long, hundreds of km wide, and several km deep. Wind speeds in the core of a jet stream should exceed 30 m/sec. Vertical gradients are of the order of 5 m/sec/km. Horizontal gradients are of the order of 5 m/sec/100 km."[2] 30 m/s is 67 mph or 58 knots. Forecasters drawing charts use a slightly lower line: "in the analysis of upper-level charts, a jet stream is indicated wherever it is reliably determined that the wind speed equals or exceeds 50 knots," the AMS says, which is 25.7 m/s.[1] Conversions computed here.
- Height
- Typically around 30,000 feet (9,100 m), NOAA says; the FAA gives flight levels 200 to 450, about 6 to 14 km.[3][12]
- Direction
- From west to east in both hemispheres, but "the band often shifts north and south because jet streams follow the boundaries between hot and cold air."[3]
- Two in each hemisphere
- The polar-front jet of the middle latitudes and the subtropical jet near 30°.[1]
- Strongest
- In winter, "since these hot and cold air boundaries are most pronounced in winter."[3]
On a weather map the jet is often drawn as a single arrow, but NOAA's JetStream course warns that jets "are wider and not as distinct as a single line; they are regions where the wind speed increases toward a central core of greatest strength."[3] The lines that outline them are isotachs, lines of equal wind speed.[1]
How it was found
The strong winds aloft were measured in Japan two decades before they had a name. Wasaburo Ooishi (also written Oishi), a physicist at the Central Meteorological Office, founded the Tateno aerological observatory in 1920, about 50 km northeast of Tokyo. There, in the winter of 1924, he launched balloons that rose to 9 or 10 km and followed them with a theodolite, estimating the average wind in each layer. He "discovered winds of about 70 m/s below about 10 km altitude," from the west, writes David Quintero Plaza of the Spanish meteorological agency AEMET, drawing on the historian John Lewis.[4] Between 1923 and 1925 Ooishi made almost 1,300 such observations and published them in the observatory's reports in Esperanto, the constructed international language; the Japan Esperanto Society was another of his posts. "Not surprisingly, his research was ignored," in the words of Air & Space magazine.[5]
In the United States the first hint came from an airplane. In 1935 the aviator Wiley Post, wearing a pressure suit he had developed with the B. F. Goodrich Company, flew his Lockheed Vega Winnie Mae high enough to "cruise for long distances at high altitude in the jetstream." On March 15, 1935 he flew from Burbank, California to Cleveland, Ohio, 2,035 miles, in 7 hours 19 minutes. "At times, the Winnie Mae attained a ground speed of 340 mph, indicating that the airplane was indeed operating in the jetstream," the National Air and Space Museum records.[6] In Germany, Heinrich Seilkopf described the current in 1939 and named it the Strahlströmung, the jet stream.[4]
The war made it impossible to ignore. "The first surprise came in 1944 when B-29 pilots flying toward targets in Japan discovered at their cruising altitudes winds as high as 230 mph. The winds caused bombs to miss targets and, as headwinds, required bombers to use far more fuel than expected."[5] 230 mph is 103 m/s (computed here). Japan put the same winds to use: its army launched almost 9,000 hydrogen balloons carrying bombs toward North America over eight months from late 1944, with trajectories worked out by Hidetoshi Arakawa of the Central Meteorological Observatory, who drew on Ooishi's work. About 300 are known to have arrived; one killed Elsie Mitchell and five children near Bly, Oregon in May 1945.[5]
After the war, theory caught up in Chicago. In 1947 the staff members of the Department of Meteorology at the University of Chicago, in a paper signed jointly rather than by name, and Carl-Gustaf Rossby, in a paper of his own the same year, proposed a mechanism for the jet based on the mixing of vorticity in the cold air over the polar cap. Reiter notes that the theory left unexplained why the core is found "in the warm air south of the frontal zone, rather than in the polar cold air north of it."[2] The picture used today, a polar-front jet over the frontal zone and a subtropical jet at the poleward edge of the tropical circulation, is the one Erik Palmén drew in 1954, as the next sections show.[2] Dave Fultz, a student of Rossby, reproduced jets and their meanders in a rotating, heated dishpan of fluid, "confirming that all that was needed to have the jet stream was rotation and heating."[4]
A jet on the map
Forecasters look for the jet on the 250 or 300 hPa constant-pressure chart, the height of a pressure surface near 10 km, which the Air pressure lesson introduced. The wind aloft blows nearly along the height contours, faster where they are packed together. The chart below is one of the strongest jets on record over the eastern United States, drawn from the reanalysis of the National Centers for Environmental Prediction and the National Center for Atmospheric Research, a reconstruction of past weather on a global grid from the observations of the time.[1][7]
- 30 to 40
- 40 to 50
- 50 to 60
- 60 to 70
- 70 to 80
- 80+ m/s
- Height, m, every 120 m
Table: the fastest 250 hPa wind at each 10° of longitude, 20° to 60° N, 00 UTC February 19, 2019
| Longitude | Latitude | Speed, m/s | Speed, mph |
|---|---|---|---|
| 120° W | 30° N | 46.1 | 103 |
| 110° W | 30° N | 61.4 | 137 |
| 100° W | 35° N | 75.6 | 169 |
| 90° W | 40° N | 81.5 | 182 |
| 80° W | 40° N | 88.9 | 199 |
| 70° W | 40° N | 90.4 | 202 |
| 60° W | 42.5° N | 79.6 | 178 |
| 50° W | 42.5° N | 85.6 | 191 |
| 40° W | 40° N | 62.2 | 139 |
The difference between the two numbers at Upton is a lesson in itself. The reanalysis grid is 2.5° of latitude and longitude, about 280 km, and a value at a grid point is an average over roughly that distance, so the narrow core of a jet is smoothed away. A balloon measures one column. That night The Weather Channel reported the Upton reading as "the strongest wind on record at this altitude for the New York City area," and balloons at Pittsburgh and Albany set their own 250 hPa records of 227 and 229 mph.[10] Reading the chart takes four steps.
- Find the packed contours. Where the height lines crowd together the wind is strong.
- Follow the flow. In the Northern Hemisphere the wind blows along the contours with low heights on its left, here from southwest to northeast.
- Find the core. The darkest shading, inside the fastest isotach, is the jet streak.
- Note the sides. Cold air lies under the low heights on the left of the jet, warm air under the high heights on its right; the next sections explain why.
For the wind aloft now, the radar map on the home page has a wind layer that animates the Global Forecast System's wind at 250 hPa.
Wind that grows with height
A jet stream is a maximum in height as well as across the map. Near the ground friction slows the wind; above that the wind speeds up steadily with height to a peak near 10 km, and falls off above. The three soundings below are three of the strongest in the record.
- Yonago, Japan, Feb. 5, 2004
- Sterling, Virginia, Feb. 3, 2007
- Upton, New York, Feb. 19, 2019
Table: wind speed at standard levels in the three soundings, m/s
| Pressure, hPa | Yonago | Sterling | Upton |
|---|---|---|---|
| 1000 | 6.2 | 3.6 | 6.2 |
| 925 | 19.0 | 12.9 | 17.2 |
| 850 | 25.2 | 12.4 | 13.5 |
| 700 | 26.2 | 28.8 | 20.7 |
| 500 | 61.3 | 67.4 | 54.4 |
| 400 | 76.2 | 86.0 | 77.1 |
| 300 | 108.1 | 104.0 | 96.3 |
| 250 | 115.8 | 115.3 | 103.3 |
| 200 | 111.2 | 91.1 | 79.4 |
| 150 | 90.1 | 82.4 | 72.9 |
| 100 | 51.0 | 48.4 | 37.5 |
| 70 | 59.2 | 35.5 | 31.8 |
| 50 | 46.8 | 21.6 | 15.0 |
At Yonago the wind increased from 25.2 m/s at 850 hPa (1.4 km) to 118.9 m/s at 258 hPa (10.0 km): on average 10.9 m/s for every kilometer of height, and 19.2 m/s per kilometer in the steepest layer, between 605 and 573 hPa. Between the peak and 100 hPa, 16 km up, it fell by 11.2 m/s per kilometer. The Sterling and Upton soundings are almost the same shape: 11.7 and 10.7 m/s per kilometer on the way up, 11.3 and 10.5 on the way down. Computed here. That change of wind with height is vertical wind shear, twice the "order of 5 m/sec/km" the WMO definition gives for an ordinary jet.[2] Why the wind grows with height, and why it stops, is the subject of the next section.
Why it exists: the thermal wind
The sun heats the tropics far more than the poles, and the atmosphere carries the difference poleward. In NOAA's summary, "as the difference in temperature increases between the two locations, the strength of the wind increases."[3] The link between temperature and wind runs through two things the course has already met.
The first is the hypsometric equation of the Air pressure lesson: the thickness of a layer between two pressures is proportional to its mean temperature, so pressure surfaces sit lower over cold air. The second is the geostrophic wind, which the lesson What makes the wind blow introduces: away from the ground the wind blows along the height contours of a pressure surface, at a speed set by how steeply the surface slopes. In the AMS form,
Vg = (g / f) ∂z/∂n
where Vg is the geostrophic wind speed, g gravity, f the Coriolis parameter (2Ω sin φ, 8.84 × 10⁻⁵ per second at 37° N) and ∂z/∂n the slope of the pressure surface across the flow.[1] In words: the steeper the pressure surface, the faster the wind, and the wind blows with the low side on its left in the Northern Hemisphere.
Put the two together. Over a warm column every pressure surface sits higher than over a cold one, and the difference accumulates upward: each layer adds its own extra thickness on the warm side. So the slope of the pressure surfaces, small near the ground, grows with height, and the geostrophic wind grows with it. The AMS calls the difference between the geostrophic wind at the top and bottom of a layer the thermal wind, "the mean wind-shear vector in geostrophic balance with the gradient of mean temperature of a layer bounded by two isobaric surfaces," directed "along the isotherms with cold air to the left in the Northern Hemisphere." Its speed is
VT = (g / f) ∂h/∂n
where h is the thickness of the layer and n the distance across the thickness lines.[1] The geostrophic wind at the top of a layer is the wind at the bottom plus the thermal wind of the layer; as the AMS puts it, it is determined "by the thickness pattern of the layer."[1]
Japan on the day of the Yonago record shows it in real data. Six radiosondes, from Kagoshima in the south to Sapporo in the north, flew at the same moment through the jet.
- 850 hPa, 203 m
- 500 hPa, 420 m
- 300 hPa, 820 m
- 250 hPa, 900 m
Table: heights of the pressure surfaces, 00 UTC February 5, 2004, m
| Station | Latitude | 850 hPa | 500 hPa | 300 hPa | 250 hPa | Thickness 850 to 250 hPa | Wind at 250 hPa, m/s |
|---|---|---|---|---|---|---|---|
| Kagoshima | 31.6° N | 1,469 | 5,520 | 9,280 | 10,560 | 9,091 | 81.8 |
| Fukuoka | 33.6° N | 1,446 | 5,430 | 9,110 | 10,380 | 8,934 | 100.9 |
| Yonago | 35.4° N | 1,390 | 5,330 | 8,970 | 10,240 | 8,850 | 115.8 |
| Wajima | 37.4° N | 1,346 | 5,230 | 8,770 | 10,050 | 8,704 | 110.2 |
| Akita | 39.7° N | 1,329 | 5,170 | 8,660 | 9,900 | 8,571 | 65.9 |
| Sapporo | 43.1° N | 1,266 | 5,100 | 8,460 | 9,660 | 8,394 | 38.1 |
The worked numbers, all computed here from the soundings:
- The distance. Kagoshima (31.55° N) to Sapporo (43.05° N) is 1,279 km of latitude. At the midpoint, 37.3° N, f = 8.84 × 10⁻⁵ per second.
- The wind near the ground. At 850 hPa the height difference of 203 m gives Vg = (9.81 / 8.84 × 10⁻⁵) × (203 / 1,279,000) = 17.6 m/s. The six stations' measured westerly component at 850 hPa averaged 17.2 m/s.
- The wind at jet level. At 250 hPa, 900 m gives 78.1 m/s; the measured average was 84.5 m/s, and the fastest single station, Yonago, 115.8. A straight line between two stations 1,279 km apart cannot resolve a core a few hundred kilometers wide, but it gets the average close.
- The temperature behind it. The layer from 850 to 250 hPa was 9,091 m thick over Kagoshima and 8,394 m over Sapporo, mean temperatures of −19.4 °C and −38.8 °C. The 697 m difference gives a thermal wind of 60.5 m/s: the increase in westerly wind from 850 to 250 hPa that the temperature contrast alone requires. The measured increase was 67.3 m/s.
A difference of 19 °C across 1,279 km, spread through the lower two thirds of the atmosphere, is enough to add about 60 m/s of westerly wind between 1.5 and 10 km. That is the jet stream's engine. The wind is strongest where the temperature contrast is concentrated, which is why NOAA puts the jets over the latitudes "where changes in temperature at any one point are the greatest."[3] The same contrast is the energy source of the storms that travel along the jet: the AMS describes baroclinic instability as "converting potential energy of the basic flow into kinetic energy" of the disturbance.[1] How the jet's waves grow into troughs and ridges belongs to the lesson Troughs, ridges and shortwaves.
The polar-front and subtropical jets
The AMS distinguishes two jets in each hemisphere. "The predominant one, the polar-front jet stream, is associated with the polar front of middle and upper-middle latitudes. Very loosely, it may be said to extend around the hemisphere, but, like the polar front, it is discontinuous and varies greatly from day to day. A subtropical jet stream is found, at some longitudes, between 20° and 30° latitude and is strongest off the Asian coast."[1] The polar front is "the semipermanent, semicontinuous front separating air masses of tropical and polar origin."[1] NOAA puts the polar jet between 50° and 60° latitude and the subtropical jet near 30°, adding that both vary.[3]
The two have different origins. The subtropical jet forms at the poleward end of the Hadley cell, the tropical overturning in which air rises near the equator and flows poleward aloft. Air moving poleward keeps its angular momentum about the earth's axis while its distance from the axis shrinks, so it gains speed toward the east, as Reiter derives; the subtropical jet "has been deduced without resorting to considerations of the temperature distribution."[2] The polar-front jet is driven instead by the storms of the middle latitudes. In Quintero Plaza's summary, its most important source is "the transport of linear momentum by the large 'eddies' of the middle latitudes, that is, the large lows and anticyclones," which makes it more intense than the subtropical jet on a given day, and it sits lower because the tropopause is lower at its latitudes.[4] Both sit over strong temperature contrasts, so both obey the thermal wind.
- 10 to 20 m/s
- 20 to 30
- 30 to 40
- 40 or more
- Easterly, 10 m/s
- Tropopause
Table: zonal-mean westerly wind at 200 hPa by latitude, m/s (negative is easterly)
| Latitude | January | July |
|---|---|---|
| 90° N | 0.0 | 0.0 |
| 80° N | 4.4 | 3.3 |
| 70° N | 8.4 | 6.0 |
| 60° N | 12.4 | 7.2 |
| 50° N | 18.4 | 17.6 |
| 40° N | 30.8 | 19.1 |
| 30° N | 43.9 | 3.9 |
| 20° N | 27.1 | -2.8 |
| 10° N | 8.6 | -8.9 |
| Equator | 0.4 | -8.3 |
| 10° S | -0.9 | 3.8 |
| 20° S | 6.5 | 25.3 |
| 30° S | 19.0 | 41.0 |
| 40° S | 26.6 | 29.9 |
| 50° S | 30.3 | 26.8 |
| 60° S | 15.7 | 23.8 |
| 70° S | 4.8 | 13.6 |
| 80° S | 1.9 | 6.2 |
| 90° S | 0.0 | 0.0 |
An average around the globe hides the polar-front jet, because it wanders: on one day it lies at 40° N over the Pacific and at 55° N over Europe, and averaging smears it into a broad shoulder. The subtropical jet is steadier and survives the average as a sharp core. Two features in the figure still separate them.
- The subtropical jet is a core aloft. In the northern winter the 44 m/s core at 30° N sits at 200 hPa, about 11.8 km, over westerlies of only a few meters per second at 850 hPa.
- The polar-front jet reaches the ground. In the Southern Hemisphere a deep column of westerlies stands near 50° S from the surface upward in both months: the strongest 850 hPa westerlies on the chart, 13.5 m/s in January and 11.7 m/s in July, sit at 50° S, far poleward of the subtropical core at 30° S. Computed here.
On single days the two jets can lie far apart, cross or merge; both "can vary significantly, and even merge," in Quintero Plaza's words.[4] The FAA notes that "on occasion, the polar-front jet stream will dip south and pass under the subtropical jet stream," a place pilots watch for turbulence.[12]
The jet and the tropopause
The jet stream sits just under the tropopause, the lid of the troposphere described in Layers of the atmosphere. The reason is the thermal wind again. In the troposphere the air is colder toward the pole, so the westerly wind increases with height. In the lower stratosphere, above the tropopause, the pattern reverses in the middle latitudes: the air over the high latitudes, where the tropopause is low, is warmer at a given height than the air over the tropics, where it is high and very cold.
Japan on February 5, 2004 shows the reversal. At 150 hPa, 13.5 to 14 km up, it was −61.3 °C over Kagoshima and −48.3 °C over Sapporo: 13 °C warmer in the north. The layer from 250 to 100 hPa was 240 m thicker over Sapporo than over Kagoshima, which gives a thermal wind of −20.8 m/s across it: the westerly must weaken with height above the jet. It did: the six stations' westerly component fell from 84.5 m/s at 250 hPa to 58.4 m/s at 100 hPa. Computed here from the soundings.[8] The jet core is where the temperature gradient changes sign, and that is at the tropopause.
The tropopause is not a smooth surface. The AMS: "A sharp discontinuity in tropopause height exists near the subtropical jet stream in each hemisphere and is often referred to as the 'tropopause break.' Smaller discontinuities are found near higher-latitude jet streams."[1] The reanalysis average in the figure above shows it: in January the tropopause lies near 115 hPa (about 15.3 km in the standard atmosphere) at 25° N and 247 hPa (about 10.4 km) at 40° N, a drop of five kilometers across 15° of latitude, and the 44 m/s core sits in the step, at 30° N. Over the poles it lies near 280 hPa. Computed here.[7]
Summer and winter
The equator-to-pole temperature contrast is largest in winter, when the pole is in darkness, and smallest in summer. The jet follows. NOAA's description: "as the Sun's elevation increases each day in the spring, the average latitude of the jet stream shifts poleward. By summer in the Northern Hemisphere, the polar jet is typically found near the U.S. Canadian border. As Autumn approaches and the Sun's elevation decreases, the jet stream's average latitude moves toward the equator."[3]
- East Asia and the western Pacific, 120° to 150° E
- North America, 125° to 70° W
- All longitudes
Table: the strongest monthly mean westerly at 250 hPa and its latitude, 1991 to 2020
| Month | East Asia, m/s | Latitude | North America, m/s | Latitude | All longitudes, m/s | Latitude |
|---|---|---|---|---|---|---|
| January | 70.6 | 32.5° N | 33.1 | 32.5° N | 40.4 | 30.0° N |
| February | 67.1 | 32.5° N | 35.7 | 32.5° N | 40.6 | 30.0° N |
| March | 56.6 | 30.0° N | 32.7 | 30.0° N | 35.8 | 27.5° N |
| April | 42.9 | 32.5° N | 28.0 | 27.5° N | 28.0 | 27.5° N |
| May | 35.4 | 35.0° N | 20.1 | 25.0° N | 23.3 | 37.5° N |
| June | 30.9 | 37.5° N | 20.8 | 45.0° N | 21.4 | 40.0° N |
| July | 20.5 | 40.0° N | 22.8 | 47.5° N | 19.4 | 45.0° N |
| August | 23.9 | 42.5° N | 20.7 | 47.5° N | 19.9 | 45.0° N |
| September | 32.1 | 42.5° N | 22.3 | 52.5° N | 22.0 | 45.0° N |
| October | 40.3 | 37.5° N | 24.1 | 45.0° N | 24.9 | 42.5° N |
| November | 51.6 | 35.0° N | 28.2 | 40.0° N | 28.4 | 32.5° N |
| December | 65.7 | 32.5° N | 32.6 | 35.0° N | 36.1 | 32.5° N |
The East Asian jet is the strongest on earth in the long-term average: the fastest monthly mean 250 hPa wind anywhere in the reanalysis climatology is 73.8 m/s at 32.5° N, 142.5° E, just off Japan, in January. Computed here. That is the AMS's subtropical jet, "strongest off the Asian coast," and the place the record sounding came from.[1] Over North America the strongest monthly mean lies at 30° to 35° N from December to March and at 45° to 52.5° N from June to September, and the summer maximum is about 40 percent weaker than the winter one. Computed here. The FAA puts the same migration in practical terms: "Jet streams shift on a seasonal basis, moving into Canada by summer. As autumn approaches and the sun's elevation decreases, the jet stream moves south into the United States, helping to bring cooler air to the country."[12]
Jet streaks
Along any jet the wind is not uniform. The AMS defines a jet streak, or jet stream core, as "the region of a jet stream axis with the greatest winds."[1] Streaks move along the jet more slowly than the air passes through them. In the words of Rose and colleagues, writing in Weather and Forecasting: "Since the movement of a jet streak is typically slower than the wind speed within the jet, air parcels accelerate in the upstream or entrance region of a jet streak, and decelerate in the downstream or exit region."[13]
Speeding up and slowing down on a rotating earth require a push across the flow. In the entrance region the air is briefly out of geostrophic balance and drifts toward the cold side (to the left, looking downstream) as it accelerates; in the exit region it drifts toward the warm side as it slows. That cross-stream, or ageostrophic, flow piles air up on one side of the streak and removes it from the other. The result is the four-quadrant model, which Rose and colleagues summarize for a straight streak in the Northern Hemisphere: the ageostrophic flow "is associated with convergence in the left-entrance and right-exit quadrants, and divergence in the right-entrance and left-exit quadrants." Because the stratosphere above resists vertical motion, "beneath the divergence quadrants (i.e., the right entrance and left exit) there is implied upward motion, and beneath the convergence quadrants (i.e., the left entrance and right exit) there is implied downward motion."[13]
- Divergence, 3 or more
- 2 to 3
- 1 to 2
- Convergence, 1 to 2
- 2 to 3
- 3 or more, ×10⁻⁵ per second
- Isotachs, 70 m/s solid, 50 dashed
Table: mean 250 hPa divergence in four boxes around the jet streak, 10⁻⁵ per second
| Quadrant | Box | Mean divergence |
|---|---|---|
| Left entrance | 45 to 50° N, 97.5 to 85° W | -0.6 |
| Right entrance | 30 to 35° N, 102.5 to 95° W | 1.5 |
| Left exit | 42.5 to 47.5° N, 62.5 to 52.5° W | 2.1 |
| Right exit | 37.5 to 42.5° N, 47.5 to 40° W | -1.4 |
Averaged over boxes around the streak, the reanalysis divergence on that night was +2.1 × 10⁻⁵ per second under the left exit, +1.5 under the right entrance, −1.4 under the right exit and −0.6 under the left entrance. Computed here. The AMS puts the divergence of the wind around "migratory cyclonic systems" at "10⁻⁵ s⁻¹," and that of the geostrophic wind an order of magnitude smaller, so these are the values the model leads one to expect.[1] A divergence of 2 × 10⁻⁵ per second would remove 2 percent of the air in the layer every 1,000 seconds, about 17 minutes, if nothing replaced it; air rising from below replaces it, which is what makes the left exit and right entrance favored places for clouds, precipitation and storms.
The model is a first step, and forecasters know its limits: curvature changes the pattern, two streaks can interact, and the rising air depends on what the lower atmosphere is doing. How divergence aloft becomes ascent through the whole column, and how it is diagnosed on real charts, is the subject of Why air rises. Spin in and around the streak, the cyclonic shear on its cold side and the anticyclonic shear on its warm side, belongs to Vorticity.
The low-level jet
The same word names a different wind near the ground. The AMS defines a low-level jet as "a jet stream that is typically found in the lower 2–3 km of the troposphere. At night, sometimes called a nocturnal jet."[1] The most studied is the southerly jet of the Great Plains. Course notes from the University of Oklahoma summarize its climatology: "strong diurnal oscillation with strongest wind speeds at night," an average height of 500 to 1,000 m above the ground, near the top of the nocturnal inversion, and maximum winds that are often faster than the geostrophic wind. Bonner's 1968 study found the maximum near 800 m and the jet most frequent in spring and summer over Texas, Oklahoma, Kansas, Nebraska, Iowa, Missouri and Arkansas; a later study by Whiteman and colleagues found half of the maxima below 500 m and the peak "around 2 am LST."[14]
Its nightly peak comes not from the equator-to-pole temperature contrast but from the daily cycle of heating at the ground, acting on southerly flow that is already there: Bonner found the favorable conditions to be "a strong west to east pressure gradient across the Great Plains and an uninterrupted flow of air from the Gulf of Mexico."[14] The leading explanation of the nightly cycle, Blackadar's inertial oscillation of 1957, runs as the notes describe it: by day, turbulent mixing with the heated ground holds the lower air below its geostrophic speed; at nightfall the ground cools, a stable layer forms and the air above it decouples from the surface, "nearly frictionless and turbulence free," and accelerates. "The effect of the Coriolis force on this accelerating, frictionless airstream is to cause an inertial oscillation with supergeostrophic speeds being reached after several hours."[14] A second mechanism the notes list, the heating and cooling of the gently sloping terrain of the Plains, adds to it.[14] The Inversions and the cap lesson describes the night inversion that makes the decoupling possible.
- 00 UTC, 7 pm CDT
- 12 UTC, 7 am CDT
Table: average wind speed by height above the ground, Norman, Oklahoma, June to August 2024, m/s
| Height, m | 7 pm CDT | 7 am CDT | June 7, 7 pm | June 8, 7 am |
|---|---|---|---|---|
| 0 | 3.8 | 1.7 | 5.7 | 4.1 |
| 500 | 7.0 | 12.1 | 13.2 | 25.3 |
| 1,000 | 6.9 | 9.4 | 14.8 | 23.3 |
| 1,500 | 6.9 | 7.8 | 16.3 | 18.4 |
| 2,000 | 6.9 | 6.8 | 13.5 | 15.5 |
| 2,500 | 6.7 | 6.6 | 10.6 | 14.0 |
| 3,000 | 6.8 | 6.6 | 7.2 | 13.6 |
The low-level jet matters far more than its modest speed suggests. The Oklahoma notes list its effects: "increased northward transport of moisture at jet level," convergence at the nose of the jet, and a role in "the nighttime thunderstorm maximum observed in the Great Plains." A study they cite found the flow of moisture from the Gulf of Mexico at night 48 percent above its mean when a low-level jet is present, and the Great Plains floods of 1993 came with a prolonged run of strong low-level jets.[14] The glossary of this course lists the upper-level jet stream and the low-level jet as separate entries for that reason: they share a shape, not a cause.
The jet and aviation
Airliners cruise at the jet's height, so every long flight across the middle latitudes gains or loses to it. The U.S. Bureau of Transportation Statistics records the wheels-off to wheels-on time of every domestic flight by the large carriers.
- Eastbound, Los Angeles to Kennedy
- Westbound, Kennedy to Los Angeles
Table: median air time by month, 2024, minutes
| Month | Eastbound | Westbound | Difference | Flights east | Flights west |
|---|---|---|---|---|---|
| January | 287 | 335 | 48 | 749 | 752 |
| February | 280 | 345 | 65 | 717 | 713 |
| March | 285 | 336 | 51 | 784 | 785 |
| April | 286 | 336 | 50 | 780 | 781 |
| May | 290 | 328 | 38 | 824 | 823 |
| June | 294 | 316 | 22 | 808 | 815 |
| July | 298 | 314 | 16 | 863 | 875 |
| August | 295 | 312 | 17 | 840 | 854 |
| September | 294 | 313 | 19 | 852 | 857 |
| October | 293 | 316 | 23 | 887 | 886 |
| November | 279 | 339 | 60 | 843 | 844 |
| December | 288 | 331 | 43 | 872 | 874 |
Over the year the median eastbound flight spent 290 minutes in the air and the median westbound flight 326. In February, when the route's mean 250 hPa westerly was 33 m/s, the medians were 280 and 345 minutes, a gap of 65; in July, with 15 m/s, they were 298 and 314, a gap of 16. On March 31, 2024 the daily gap reached 116 minutes. Computed here.
The arithmetic is simple. An airliner flies at a roughly fixed speed through the air, near 561 mph (251 m/s) for a Boeing 787 at cruise by one published figure.[10] Over a distance D with a wind component u along the route, the flight takes D/(V + u) with the wind behind it and D/(V − u) against it, a difference of about 2Du/V² when u is much smaller than V. For the 3,974 km great circle from Kennedy to Los Angeles and V = 251 m/s, that is 2.1 minutes per m/s of wind, and a 30 m/s wind opens a gap of 64 minutes. The flights agree: 2.2 minutes per m/s. Computed here. The yearly gap of 36 minutes corresponds to an effective wind of 17.1 m/s along the route, less than the 23.2 m/s mean of the 250 hPa westerly over the route in 2024, presumably because flights cruise over a range of heights and tracks and do not spend the whole trip in the core.
At the extremes, tailwinds push airliners past the speed of sound over the ground while they stay subsonic through the air. On February 9, 2020, British Airways flight 112, a Boeing 747-400, flew from New York Kennedy to London Heathrow in 4 hours 56 minutes, the fastest subsonic transatlantic crossing on the Guinness World Records list, reaching "1,327 km/h (825 mph) relative to the ground below" in jet-stream winds of up to 418 km/h (260 mph) that Guinness credits to Storm Ciara.[11] On the night of the map above, a Virgin Atlantic Boeing 787-9 from Los Angeles to London "cruised at speeds as high as 801 mph over central Pennsylvania," and landed 48 minutes early.[10]
The jet's shear is also the main source of clear-air turbulence, which the AMS defines as "a higher altitude (6–15 km) turbulence phenomenon occurring in cloud-free regions, associated with wind shear, particularly between the core of a jet stream and the surrounding air."[1] The FAA's advisory circular on avoiding it gives rules of thumb: "The threshold wind speed in the jet stream for CAT is generally considered to be 110 kts," though "it is not the wind speed itself that causes CAT; it is the wind shear"; "moderate CAT is considered likely when the vertical wind shear is 5 kts per 1,000 feet or greater, and/or the horizontal wind shear is 40 kts per 150 miles or greater." It is most frequent "on the poleward side of the jet stream," near the tropopause and upper fronts, and a turbulent patch is typically 100 to 300 miles long, 50 to 100 miles wide and 5,000 feet deep.[12] By that measure the Yonago jet was rough air: 110 knots is 56.6 m/s, and 5 knots per 1,000 feet is 8.4 m/s per kilometer, which the Yonago sounding exceeded on average all the way from 1.4 km to the core, at 10.9 m/s per kilometer. Computed here.
The jet and severe weather
Severe thunderstorms need moisture, instability, lift and wind shear. The jet stream supplies two of them. The wind increasing with height beneath it is the deep-layer shear that organizes storms into supercells, and its streaks help lift the air. The How tornadoes form lesson describes how that shear is turned into rotation.
Forecasters have long used the four-quadrant model to find where. Rose and colleagues tested it against 1,420 tornadoes of F1 or stronger within three hours of 00 UTC in the springs of 1990 to 1999, placing each against the jet streaks on the 250 hPa reanalysis chart. "Tornadoes occurred primarily within the two exit quadrants, with the left-exit quadrant favored over the right-exit quadrant," they found; the right entrance was favored over the left entrance.[13]
| Under the jet streak's | Outbreak days (65) | Other days (216) | All tornadoes (1,420) |
|---|---|---|---|
| Left exit | 44% | 30% | 37% |
| Right exit | 28% | 21% | 25% |
| Right entrance | 16% | 25% | 20% |
| Left entrance | 7% | 11% | 9% |
| North or south of the jet, or unclassified | 6% | 13% | 9% |
Tornadoes of F1 or stronger, April to June 1990 to 1999, 21 to 03 UTC; an outbreak day had six or more. From Rose and colleagues' Table 2.[13] The divergent quadrants were favored as the model predicts, but the whole exit region was favored even more: twice as many tornadoes lay under the exit region as under the entrance, and on outbreak days "73% more tornadoes occurred in the conventionally unfavored right-exit quadrant than in the conventionally favored right-entrance quadrant." The authors suggest that surface lows, warm sectors and moist southerly flow may simply lie more often under exit regions.[13] The model points to where lift is likely, not where storms must form.
The two jets also work together. Rose and colleagues cite Uccellini and Johnson's proposal that the mass adjustments beneath an upper-level jet streak can strengthen the low-level jet, and the Oklahoma notes add that a low-level jet "especially when combined with an upper-level jet, provides a veering of winds with height that is favorable for the development of severe weather and tornadoes."[13][14]
Records
| Record | Speed | Where and when | Source |
|---|---|---|---|
| Fastest jet-stream wind measured by a weather balloon, at 250 hPa | 115.7 m/s (258.8 mph) | Yonago, Japan, Feb. 5, 2004 | Guinness, from IGRA[9] |
| The same balloon, fastest reported level | 118.9 m/s (266 mph) | 258 hPa, 10.0 km | Wyoming archive[8] |
| Sterling, Virginia, recalled by NOAA's Bill Blackmore | 258 mph (115.3 m/s) | 7 am EST Feb. 3, 2007, about 34,000 feet | weather.com; Wyoming archive[10][8] |
| New York City area, 250 hPa | 231 mph (103.3 m/s) | Upton, New York, 7 pm EST Feb. 18, 2019 | weather.com; Wyoming archive[10][8] |
| Albany, New York, just under 38,000 feet | 243 mph | Evening of Feb. 19, 2019 | weather.com[10] |
| Fastest monthly mean 250 hPa wind, 1991 to 2020 | 73.8 m/s | 32.5° N, 142.5° E, January | Computed here[7] |
| Fastest subsonic transatlantic flight | 825 mph over the ground | BA112, New York to London, 4 h 56 min, Feb. 9, 2020 | Guinness[11] |
Guinness notes that its record is based on the 250 hPa level, "which corresponds to an altitude of around 10,400 metres," using balloon data from 2,788 stations in the Integrated Global Radiosonde Archive.[9] The Yonago sounding's own reported levels include a faster value just below 250 hPa, which a record kept at one level does not count. Older records are less complete: NOAA's Bill Blackmore told weather.com that with the radio direction-finding systems used before GPS radiosondes, "wind observations for a flight such as this would have terminated at around 20,000 feet, owing to 'limiting angles' of the tracking system," because a balloon in a jet is carried quickly toward the horizon.[10] NOAA gives the jet's top speeds as "more than 275 mph (239 kts / 442 km/h)" and the FAA "more than 240 knots"; neither names a measurement.[3][12]
Check yourself
-
By the WMO definition, what is the lower limit of the wind speed in a jet stream's core, and what speed does the AMS say analysts use on charts?
Answer
30 m/s (67 mph) in the WMO definition as Reiter reports it; the AMS says a jet is indicated on upper-level charts wherever the wind reaches 50 knots, about 25.7 m/s.
-
Why does the westerly wind increase with height through the troposphere in the middle latitudes?
Answer
The air is colder toward the pole, so layers are thinner there and pressure surfaces slope down toward the pole more steeply at each higher level. The geostrophic wind is proportional to that slope, so it grows with height. This is the thermal wind.
-
Over Kagoshima the 850 to 250 hPa layer was 9,091 m thick and over Sapporo, 1,279 km to the north, 8,394 m. With f = 8.84 × 10⁻⁵ per second, roughly how much stronger must the westerly be at 250 hPa than at 850 hPa?
Answer
VT = (9.81 / 8.84 × 10⁻⁵) × (697 / 1,279,000) ≈ 60 m/s. The measured increase averaged over the six stations was 67 m/s.
-
Why does the wind decrease with height above the jet core?
Answer
Above the tropopause the temperature gradient reverses: the lower stratosphere over high latitudes is warmer than over the tropics. The thermal wind then points the other way and the westerly weakens with height. Over Japan on February 5, 2004 it was 13 °C warmer at 150 hPa over Sapporo than over Kagoshima.
-
Where is the subtropical jet, and what feature of the tropopause lies beneath it?
Answer
Near 30° latitude at about 200 hPa, 12 km, strongest off the coast of Asia in winter. It sits at the tropopause break, where the tropopause drops from near 15 km on the tropical side to near 10 km on the poleward side.
-
In the four-quadrant model of a straight jet streak in the Northern Hemisphere, which two quadrants have divergence aloft and rising air beneath?
Answer
The right entrance and the left exit. The left entrance and right exit have convergence aloft and sinking air. In the tornado climatology of Rose and colleagues, the left exit was the most favored quadrant, but the right exit was favored over the right entrance.
-
How is the Great Plains low-level jet different from the jet stream?
Answer
It lies in the lowest 2 to 3 km, usually 500 to 1,000 m above the ground, rather than near the tropopause, blows from the south over the Plains, and peaks at night, around 2 am, because the air above the nocturnal inversion decouples from the ground and accelerates in an inertial oscillation. Its nightly peak comes from the daily heating cycle acting on southerly flow, not from the equator-to-pole temperature contrast.
-
A route 4,000 km long is flown at an airspeed of 250 m/s. About how much longer is the westbound flight than the eastbound one in a 25 m/s westerly?
Answer
About 2Du/V² = 2 × 4,000,000 × 25 / 62,500 = 3,200 seconds, a little over 53 minutes.
Video


Methods
Soundings are the University of Wyoming's TEXT:LIST tables: six Japanese stations at 00 UTC
February 5, 2004 (Kagoshima 47827, Fukuoka 47807, Yonago 47744, Wajima 47600, Akita 47582,
Sapporo 47412), Upton, New York (72501) at 00 UTC February 19, 2019 and Sterling, Virginia
(72403) at 12 UTC February 3, 2007. Geostrophic and thermal winds use
g = 9.80665 m s⁻², f = 2Ω sin φ at the midpoint latitude and the north-south
distance between Kagoshima and Sapporo on a sphere of radius 6,371 km; layer mean temperatures
come from the thicknesses by the hypsometric equation with R = 287.05 J kg⁻¹ K⁻¹, and the
observed westerly component is the reported wind resolved to the east, averaged over the six
stations. The climatology is the NCEP/NCAR Reanalysis 1 monthly long-term mean for 1991 to 2020
(2.5° grid, 17 pressure levels) from NOAA's Physical Sciences Laboratory: zonal means of the
zonal wind and of the tropopause pressure, and for the seasonal figure the zonal wind at 250
hPa averaged over each longitude sector before the maximum over northern latitudes is taken.
The map and the divergence use the 6-hourly reanalysis at 00 UTC February 19, 2019;
divergence is computed on the sphere with centered differences, and the four boxes are
45° to 50° N, 97.5° to 85° W (left entrance), 30° to 35° N, 102.5° to 95° W (right entrance),
42.5° to 47.5° N, 62.5° to 52.5° W (left exit) and 37.5° to 42.5° N, 47.5° to 40° W (right
exit). Fields are refined bilinearly for drawing on a Lambert conformal projection; coastlines
and borders are Natural Earth 1:50m. The low-level jet composite uses every Norman, Oklahoma
(KOUN) sounding of June to August 2024 in the Iowa Environmental Mesonet RAOB archive that
reached 3 km, interpolated to 100 m steps above the lowest reported level. Flight times are
the AirTime field of the Bureau of Transportation Statistics Reporting Carrier On-Time
Performance data for 2024, every nonstop between JFK and LAX that was neither cancelled nor
diverted; the daily comparison uses days with at least five flights each way and the
reanalysis daily mean 250 hPa zonal wind averaged, weighted by the cosine of latitude, over
35° to 42.5° N and 122.5° to 72.5° W. The code and data are in the site's repository, in
scripts/learn/the-jet-stream.mjs,
scripts/learn/the-jet-stream-extract.py and
scripts/learn/the-jet-stream-data/.
Related
The tropopause the jet runs under is in Layers of the atmosphere; thickness and constant-pressure charts are in Air pressure. The balloon soundings behind the profiles are read as in How to read a skew-T, and the shear the jet supplies to storms is in How tornadoes form. The radar map on the home page animates the wind at 250 hPa. Unfamiliar terms are in the glossary.
Sources
Quotations are verbatim from the source named. Figures and numbers marked "computed here" are described under Methods.
- American Meteorological Society, Glossary of Meteorology, entries jet stream, jet stream core, subtropical jet stream, polar front, westerlies, isotach, reanalysis, geostrophic wind, Coriolis parameter, thermal wind, thermal wind equation, baroclinic instability, tropopause, divergence, low-level jet and clear-air turbulence.
- E. Reiter, Tropospheric Circulation and Jet Streams, chapter 4, Department of Atmospheric Science, Colorado State University (repository copy), pp. 85 to 89, including the WMO definition in its first footnote.
- NOAA JetStream, The Jet Stream.
- David Quintero Plaza, Agencia Estatal de Meteorología (AEMET), The jet stream, Wasaburo Oishi and Esperanto, Calendario Meteorológico 2025, pp. 244 to 251. Its history draws on J. M. Lewis, "Ooishi's Observation," Bulletin of the American Meteorological Society 84, 2003, and T. Woollings, Jet Stream, Oxford University Press, 2019.
- Rebecca Maksel, Why Was the Discovery of the Jet Stream Mostly Ignored?, Air & Space, April 2018.
- Smithsonian National Air and Space Museum, Lockheed Vega "Winnie Mae", collection record.
- NOAA Physical Sciences Laboratory, NCEP/NCAR Reanalysis 1: monthly long-term means 1991 to 2020 (zonal wind, tropopause pressure), 6-hourly and daily 250 hPa and 200 hPa fields.
- University of Wyoming, Department of Atmospheric Science, upper-air soundings: Kagoshima, Fukuoka, Yonago, Wajima, Akita and Sapporo, 00 UTC February 5, 2004; Upton, NY, 00 UTC February 19, 2019; Sterling, VA, 12 UTC February 3, 2007.
- Guinness World Records, Fastest jet stream on Earth.
- Brian Donegan, The Weather Channel, Jet Stream Winds from Southwest to Northeast U.S. Among the Highest on Record, weather.com, 2019.
- Guinness World Records, Fastest subsonic transatlantic commercial flight.
- Federal Aviation Administration, Advisory Circular 00-30C, Clear Air Turbulence Avoidance, March 22, 2016.
- Stanley F. Rose, Peter V. Hobbs, John D. Locatelli and Mark T. Stoelinga, A 10-Yr Climatology Relating the Locations of Reported Tornadoes to the Quadrants of Upper-Level Jet Streaks, Weather and Forecasting 19, 2004, pp. 301 to 309 (copy hosted by NWS Louisville).
- University of Oklahoma, METR 4433 Mesoscale Meteorology, 3.5 Nocturnal Low-Level Jet, course notes, spring 2015.
- Iowa Environmental Mesonet, Iowa State University, RAOB soundings archive: Norman, Oklahoma (KOUN), June to August 2024.
- U.S. Bureau of Transportation Statistics, Reporting Carrier On-Time Performance (1987 to present), January to December 2024.
- Natural Earth, 1:50m coastlines, country boundaries and state and province lines, public domain.
- MODIS Land Rapid Response Team, NASA Goddard Space Flight Center, Clouds over Africa, Aqua MODIS, January 9, 2025, public domain, with NASA's description, via Wikimedia Commons.
- NOAA SciJinks, What Is the Jet Stream?, YouTube.
- Met Office, Learn About Weather, How jet streams affect our weather: an in-depth guide, YouTube.
- NOAA Boulder, Do You NOAA: Jet Stream and Polar Vortex, YouTube.
.jpg)
Corrections: contact@weatherovertime.com.
Unit 3: Wind and dynamics
- What makes the wind blow
Pressure gradient, Coriolis and friction, and why wind crosses the isobars near the ground.
- The jet stream
Where the jet stream comes from, how it moves, and what jet streaks do.
- Troughs, ridges and shortwaves
The waves in the upper-level flow and the weather under each part of them.
- Vorticity
Spin in the atmosphere, from the jet stream down to the mesocyclone.
- Why air rises: lift on the large scale
Divergence aloft, warm air advection and the quasi-geostrophic picture of ascent.