How tornadoes form
A tornado is the end of a chain that starts with the wind profile of an ordinary spring afternoon and ends with a column of air spinning faster than anything else in the atmosphere at ground level. Each link is now understood well enough to draw, and the last link is understood poorly enough that three out of four rotating storms never close it. This article follows the chain from the sounding to the vortex, with the definitions from the glossary, the numbers from the papers, and the setups before nine real tornadoes, from the ones every forecaster saw coming to the ones nobody did.
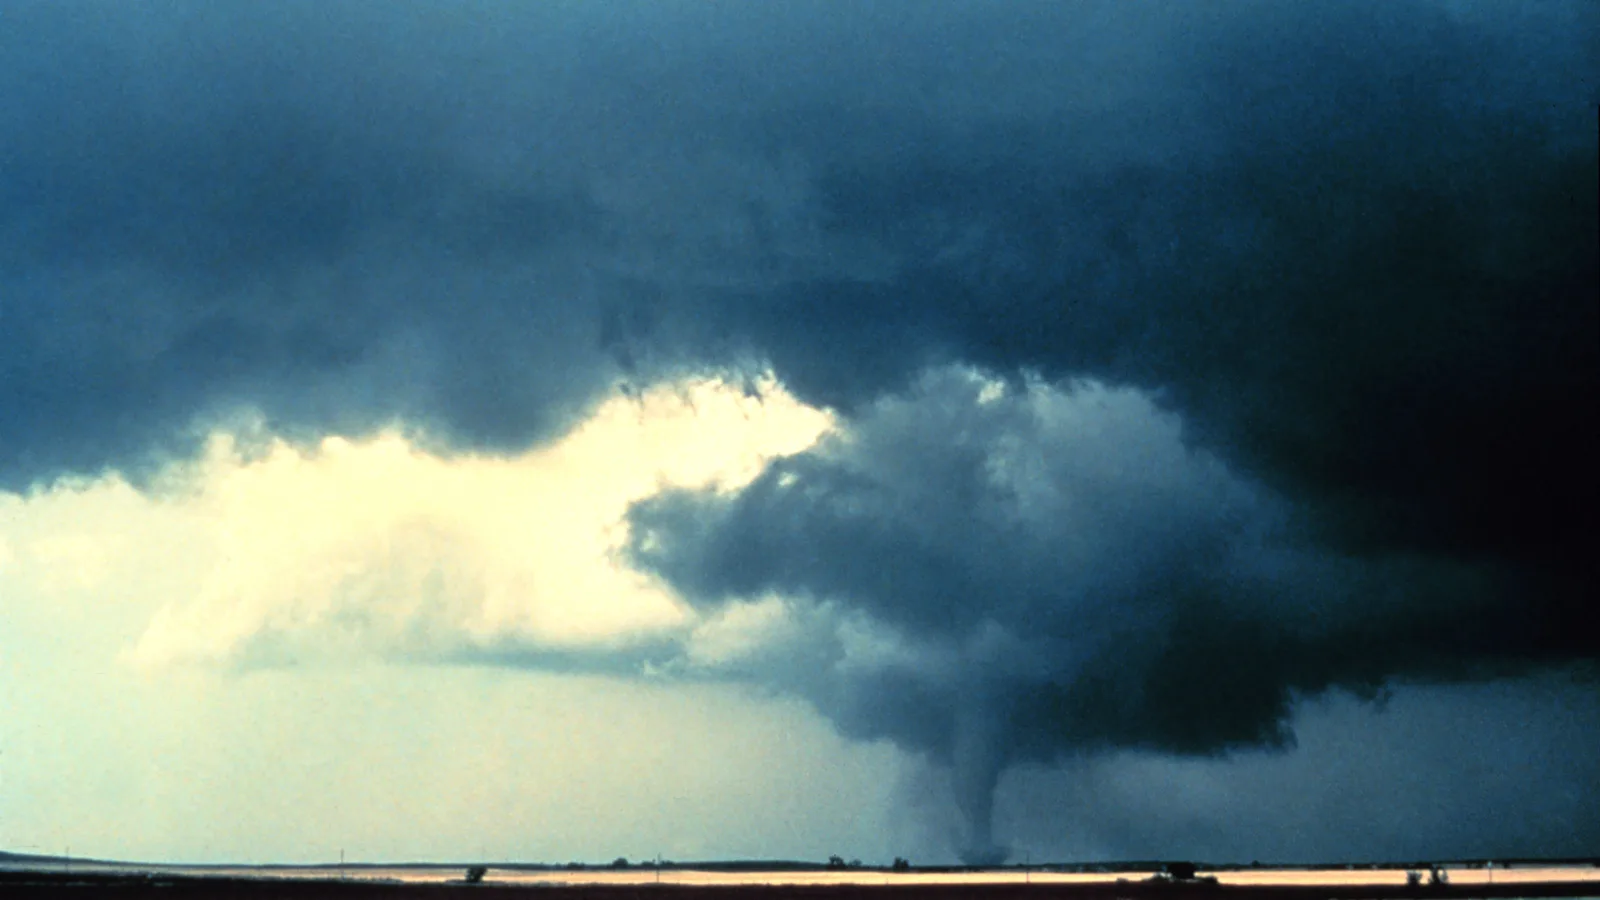
- Shear makes the storm rotate. Wind that strengthens and turns with height gives the low-level air a rolling motion. The updraft tilts it upright: a mesocyclone, 2 to 10 km wide, several kilometers up.
- A downdraft brings the spin to the ground. Tilting by an updraft alone leaves the surface calm. Air sinking through rain-cooled air on the storm's rear flank delivers rotation to the ground beside the updraft.
- Stretching makes the tornado. The updraft's low pressure draws that spinning air inward and up. The column narrows and spins up. This step fails in most supercells: only 26 percent of radar-detected mesocyclones in one survey were tornadic.
- What discriminates is low, not high. Tornadic and nontornadic supercells have about the same CAPE. They differ in shear and helicity in the lowest kilometer and in the height of the cloud base.
- The setups vary more than the textbook says. Moore 2013 and Mayfield 2021 were forecast days ahead. Menasha 2026 had a 2 percent tornado outlook and a severe thunderstorm watch. Jarrell 1997 had almost no shear at all.
What a tornado is
The American Meteorological Society's glossary defines a tornado as "a rapidly rotating column of air extending vertically from the surface to the base of a cumuliform cloud, often with near-surface circulating debris/dust when over land or spray when over water." The funnel is optional: "although its presence is not required, a funnel cloud is often visible." The typical scale is "a diameter of 2 km or less, with maximum wind velocity differences across the circulation exceeding 40 m s−1 within 200 m of the surface," and a lifetime "on the order of 100 to 1000 s." Some "may be comprised of multiple subvortices with spatial scales as small as tens of meters, rotating around a central axis."[1]
Two things in that definition matter for what follows. The rotation has to reach the surface; a rotating cloud base without surface winds is a funnel cloud, not a tornado. And the column is small, under 2 km and usually much less, inside a storm 20 to 40 km across. The question of how tornadoes form is the question of how a storm concentrates its rotation into that column and gets it to the ground.
The government's own summary is candid. The National Severe Storms Laboratory: "The truth is that we don't fully understand" how tornadoes form; "tornado formation is believed to be dictated mainly by things which happen on the storm scale, in and around the mesocyclone"; and "we still have lots of work to do."[2] The Storm Prediction Center's FAQ warns against the version most people know: "The classic answer, 'warm moist Gulf air meets cold Canadian air and dry air from the Rockies,' is a gross oversimplification."[3] Air masses meeting is where thunderstorms come from. Tornadoes need more, and the rest of this article is about what.
The stakes are in the rating distribution. In the Storm Prediction Center's database for 1996 to 2025, 56 percent of rated tornadoes were EF0 and produced 0.3 percent of the deaths. EF3 and stronger were under 3 percent of tornadoes and 82 percent of the deaths.[41] The process this article describes is the process that makes the strong ones.
- Share of tornadoes
- Share of deaths
Table: tornadoes, deaths, and median path by rating, 1996 to 2025
| Rating | Tornadoes | Share, % | Deaths | Share of deaths, % | Median path length, mi | Median width, yd |
|---|---|---|---|---|---|---|
| EF0 | 20,531 | 56.3 | 7 | 0.3 | 0.5 | 50 |
| EF1 | 11,825 | 32.4 | 101 | 4.6 | 2.7 | 100 |
| EF2 | 3,123 | 8.6 | 288 | 13.1 | 6.2 | 250 |
| EF3 | 830 | 2.3 | 729 | 33.2 | 12.88 | 500 |
| EF4 | 157 | 0.4 | 634 | 28.9 | 21 | 880 |
| EF5 | 15 | 0 | 435 | 19.8 | 30.3 | 1,600 |
The ingredients, read from a sounding
Forecasters read the environment from a sounding: a balloon's profile of temperature, dew point and wind with height. The chart below is the 1 pm sounding from Norman, Oklahoma on May 20, 2013, launched two hours before the Moore tornado touched down 25 miles to the north.[42] Four quantities on it decide whether the afternoon can produce a supercell and whether the supercell can produce a tornado.
Table: the sounding at mandatory levels
| Pressure, hPa | Height above ground, m | Temperature, °C | Dew point, °C |
|---|---|---|---|
| 966 | 0 | 27.4 | 22.4 |
| 850 | 1,116 | 16.6 | 14.6 |
| 700 | 2,758 | 9.6 | -6.4 |
| 500 | 5,425 | -11.7 | -27.7 |
| 300 | 9,135 | -39.9 | -58.9 |
| 200 | 11,795 | -54.7 | -71.7 |
Instability
Convective available potential energy, CAPE, is the shaded area: the work the atmosphere can do on a rising parcel that is warmer than its surroundings. It is the fuel of the updraft. Mixed-layer CAPE, MLCAPE, uses the average of the lowest 100 hPa as the parcel rather than the surface alone, and is the version the Storm Prediction Center's parameters use. A value above about 1,000 J/kg supports organized storms; 3,000 is large; the Plains can exceed 5,000. The counterpart is convective inhibition, CIN, the negative area near the ground where the parcel is cooler than its surroundings and must be forced upward. Its source is usually a warm, dry layer above the boundary layer, the cap, which holds storms off until heating or lift breaks it. The cap is why so many severe days produce nothing until late afternoon, and why the Enderlin and El Reno outlooks below both spent paragraphs on it.
Moisture and the cloud base
The dew point sets the height of the cloud base, the lifting condensation level or LCL. A moist boundary layer gives a low base, which matters for tornadoes in a way it does not for hail: air evaporating rain beneath a low base is cooled less, and the downdraft that has to deliver rotation to the ground arrives warmer. The proximity-sounding climatologies found the cloud base "generally lower for supercells with significant tornadoes than those without," and the effect is now in the operational parameters as an explicit term.[16][19]
Wind shear
Vertical wind shear is the change of the wind vector with height. The bulk shear over the lowest 6 km, above about 20 m/s or 40 knots, separates supercells from ordinary storms. The shear in the lowest kilometer, and the way the wind turns with height there, separates the supercells that produce tornadoes from the ones that do not. The measure forecasters use is storm-relative helicity, SRH, defined below; in the review by Robert Davies-Jones, "large 0-1 km helicity is especially conducive to tornadoes because the base of the mesocyclone aloft is not far off the ground."[5] The hodograph is the chart for this: the tip of the wind vector traced from the surface upward. A long, clockwise-curving trace in the lowest kilometer is the tornado signature in the wind field; the gallery of nine hodographs in the examples section shows what that looks like and what its absence looks like.
Lift
Something has to start the updraft: a dryline, a cold front, an outflow boundary from earlier storms, a warm front, or the rising motion ahead of an upper-level trough. The boundary matters twice. It starts the storm, and the air along it often carries extra low-level rotation and moisture that the storm then ingests. Of the nine examples below, Moore formed where a stalled front met the dryline, Greenfield where a cold front met a retreating outflow boundary, and Jarrell on a gust front with almost no shear at all.
What discriminates
The largest test of these quantities against outcomes is the Storm Prediction Center's study of 22,901 severe events from 2003 to 2011, 10,753 of them tornadoes, each matched to the analysis grid point nearest it. For discrete right-moving supercells, the median MLCAPE was almost the same for storms that produced EF2 or stronger tornadoes and for storms that produced none: 1,519 against 1,459 J/kg. Everything that separated them was low. The median cloud base was 875 m for the significant-tornado storms and 1,364 m for the nontornadic ones. Median effective storm-relative helicity was 362 against 110 m²/s²; effective bulk shear 58 against 44 knots. "A large majority of sigtor (nontor) cases having both 0-1-km SRH and ESRH greater (less) than 200 m2 s-2."[20]
The significant tornado parameter, STP, multiplies these together. The effective-layer form in operational use since 2005 is MLCAPE over 1,500 J/kg, times effective SRH over 150 m²/s², times effective bulk shear over 20 m/s, times (2,000 minus the cloud base height in meters) over 1,000, times (200 plus MLCIN) over 150, with the shear term capped at 1.5 and zeroed below 12.5 m/s, the cloud-base term set to 1 below 1,000 m and 0 above 2,000 m, and the inhibition term set to 1 above −50 J/kg and 0 below −200.[20] In the same study "a rough effective-layer STP threshold of ≥ 1 discriminates between the sigtor and nontor events," and the EF3 and stronger tornadoes favored "the upper end of the STP distribution (i.e., approximately ≥ 4)." Ninety-two percent of the EF4 and EF5 events had STP of at least 1 at the nearest grid point, against 20 percent of the nontornadic supercells.[20] The Menasha example below is a day on which that number went from 0 at breakfast to between 4 and 6 at noon.
Newer work pushes the discriminating layer even lower. A 2023 study of supercell inflow summarizes the model-based climatologies: "SRH very near the ground (e.g., 0-500 m AGL; SRH500) is the single most predictive parameter in discriminating significantly tornadic supercells from their nontornadic counterparts," and in its simulations the air that feeds the low-level mesocyclone comes "from very close to the ground, often in the lowest 200-400 m of the atmosphere."[14]
From shear to a rotating updraft
A supercell, in the glossary's words, is "an often dangerous convective storm that consists primarily of a single, quasi-steady rotating updraft, which persists for a period of time much longer than it takes an air parcel to rise from the base of the updraft to its summit (often much longer than 10-20 min)." It "usually forms in an environment with strong vertical wind shear" and "often propagate[s] in a direction and with a speed other than indicated by the mean wind."[1] The rotating updraft is the mesocyclone: "a cyclonically rotating vortex, around 2-10 km in diameter, in a convective storm," with vorticity "often on the order of 10-2 s-1 or greater."[1] Where the rotation comes from was settled in the early 1980s, and the mechanism is simple enough to draw.
Air moving faster above slower air has vorticity about a horizontal axis, the way a pencil between two hands moving at different speeds rolls. Davies-Jones showed in 1984 that "a roughly circular storm acquires net cyclonic (anticyclonic) rotation within its updraft (downdraft) when the storm-relative winds veer with height, or equivalently when the environmental flow possesses streamwise vorticity in a reference frame moving with the storm."[6] Streamwise means the horizontal vorticity vector points along the direction the air is flowing into the storm. Lifted by the updraft, that vorticity is tilted vertical on the way in, so the rising air and the rotating air are the same air. In the opposite case, a straight hodograph with the wind strengthening but not turning, the vorticity is crosswise and "the right and left sides (looking downshear) of the updraft rotate cyclonically and anticyclonically, respectively, with no overall rotation."[5]
Storm-relative helicity is the measure of streamwise vorticity available to the storm. It "is the integral over the inflow's vertical range (nominally 0 to 3 km) of the scalar product of the storm-relative inflow velocity and the horizontal vorticity," which on the hodograph "is minus twice the area swept out counterclockwise by the storm-relative wind over the specified height range."[5] That is why the hodograph's shape matters more than the wind speed: a long, curved trace sweeps a large area relative to the storm's motion.
The mesocyclone that results is large and slow by tornado standards: "a typical maximum tangential wind of 21 m s-1 at a radial distance from the circulation center of 1.5 to 4.5 km."[5] Its importance is what it does to the pressure. Rotation lowers pressure at its center, and because the rotation is strongest a few kilometers up, the pressure is lowest there, which pulls air upward from below. This dynamic lifting is independent of buoyancy, and it is why a supercell's updraft can lift air that ordinary buoyancy could not, including, as the next sections show, the rain-cooled air that becomes the tornado.
The same pressure effect explains why supercells move to the right of the wind and why storms split. Richard Rotunno and Joseph Klemp found in simulations that "the thunderstorm propagates rightward primarily because of the favorable dynamic vertical pressure gradient that, owing to storm rotation, is always present on the right flank of the updraft," and that this "occurs even in the absence of a cold outflow and gust front near the surface."[7] In straight shear "initial storms split into right- and left-moving supercells," and in shear that turns clockwise with height the right-mover is enhanced and the left-mover suppressed.[5] Morris Weisman and Klemp's 1982 simulations, varying buoyancy and shear across a range of environments, produced "a spectrum of storm types including short-lived single cells, certain types of multicells and rotating supercells," with the supercells at the high-shear end.[8]
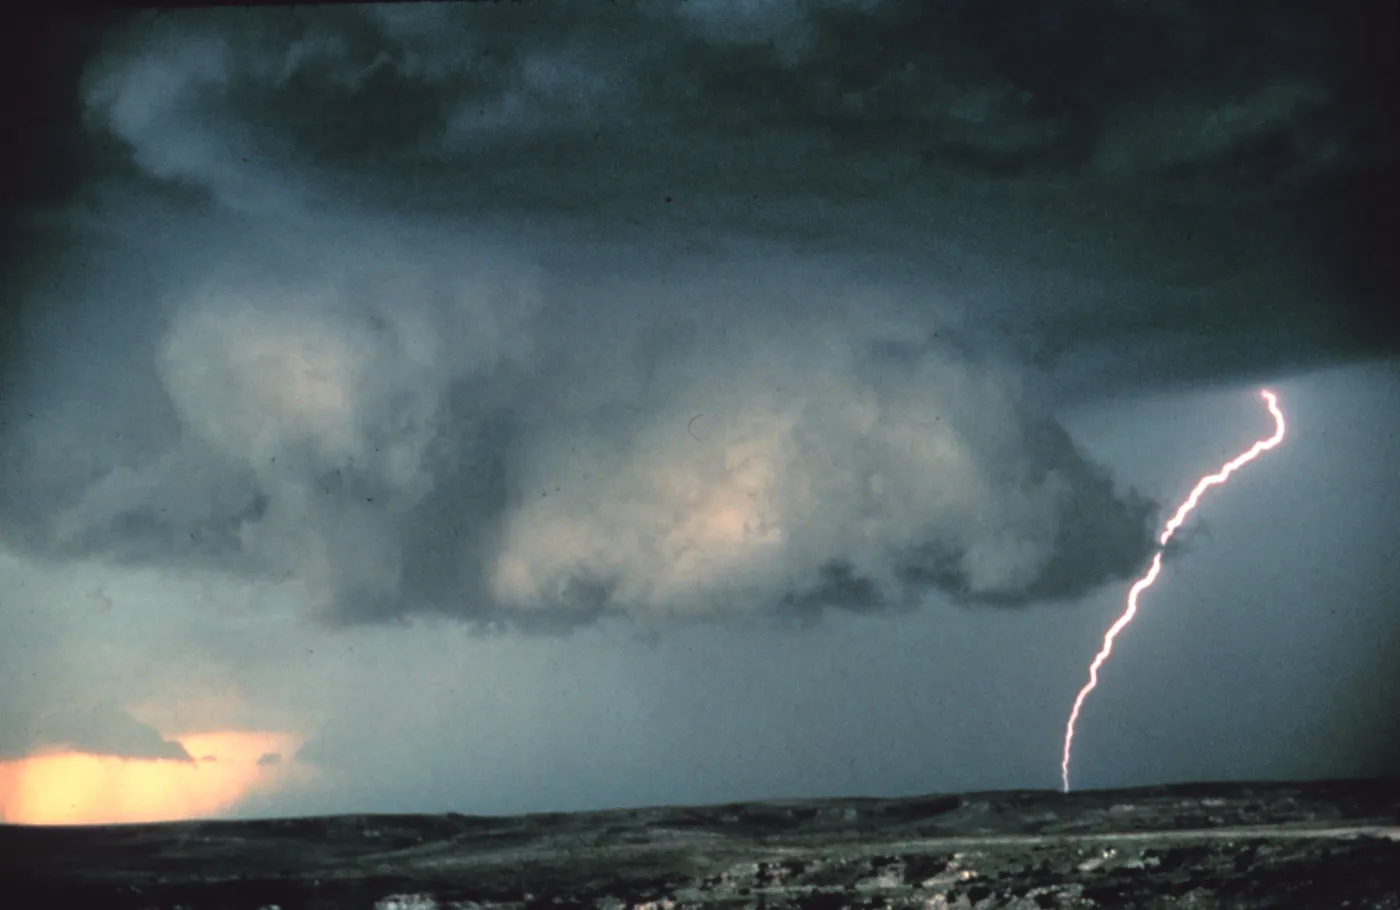
Anatomy of a supercell
Seen from above, on radar, a mature supercell has a shape that the rest of the process depends on. The diagram below is the classic configuration, drawn as the reflectivity field shows it.
The forward flank downdraft is the storm's main precipitation: rain and hail falling from the updraft's summit, carried downwind, evaporating and cooling the air beneath. The rear flank downdraft, RFD, is the descent of drier air on the back side of the updraft, which wraps around the mesocyclone and shows on the ground as the clear slot in the hero photo. The hook echo is precipitation drawn around the mesocyclone by the rotation. The inflow, warm and moist, enters from the right front under the updraft base, where the wall cloud hangs. The Storm Prediction Center notes that this clean picture is a Plains picture: "most supercells, especially in the eastern U.S., instead have heavy-precipitation (HP) structure, where rain and/or hail obscures the view of the wall cloud."[3] Plainfield, in the examples, was one of those.
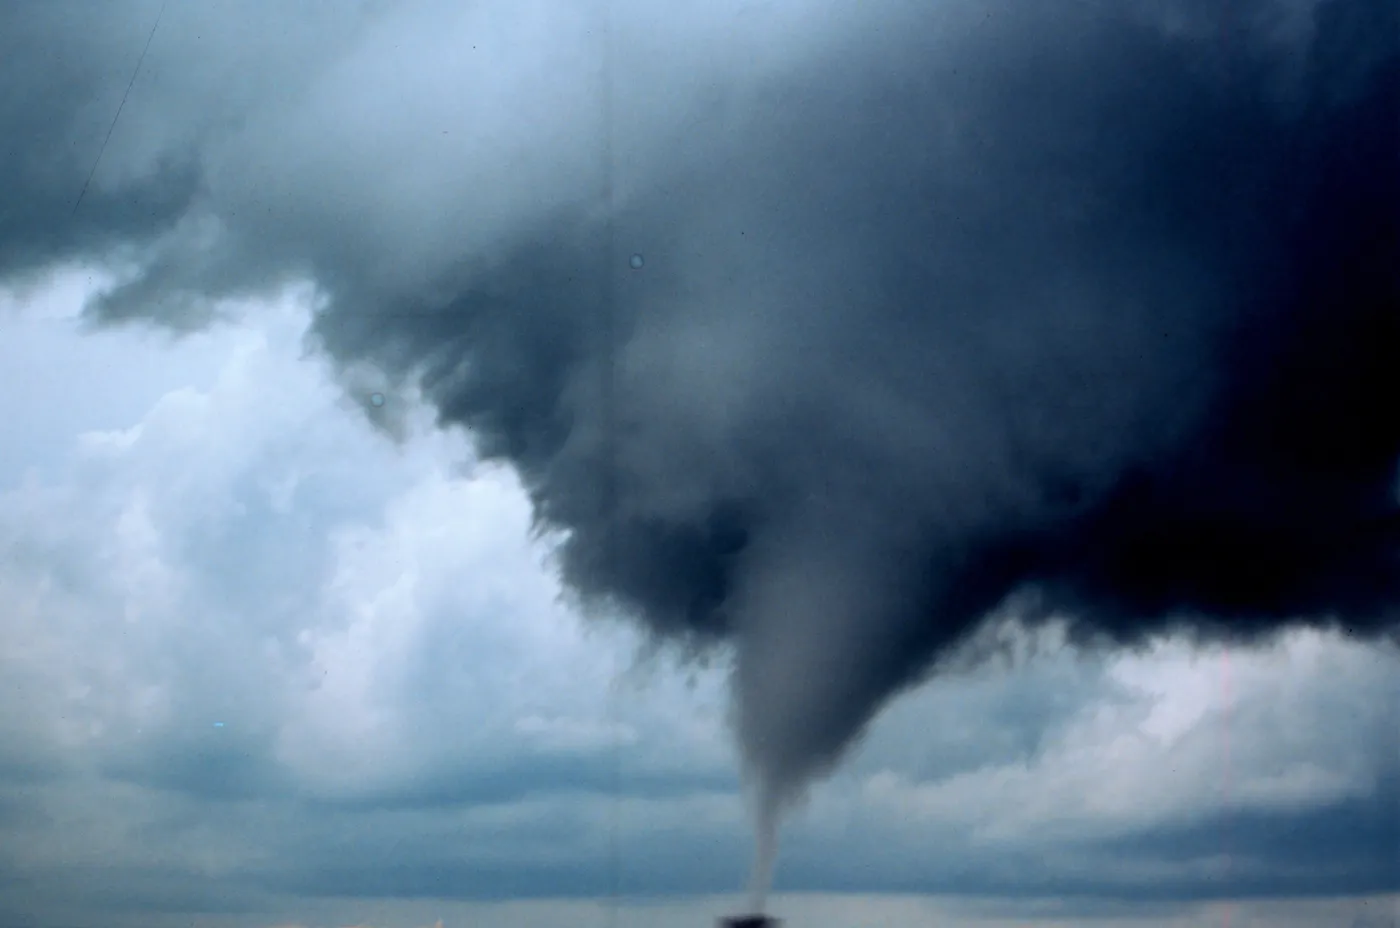
Why the spin needs a downdraft
Here is the step that separates a rotating storm from a tornadic one, and it is the step the popular explanation skips. Tilting by the updraft produces rotation in rising air, which means the rotation appears hundreds of meters up and is carried higher. Davies-Jones: "Tilting by an updraft of horizontal vorticity fails to produce rotation next to the ground because the vertical vorticity is generated as the air is rising to hundreds of meters above the ground." Since 1971, "Doppler radar observations have shown that mesocyclones form aloft first and then near the ground prior to tornadogenesis." The conclusion: "tornadogenesis must await the development of downdrafts."[5]
The review rules out the alternatives one by one. Concentrating Earth's rotation alone, as a hurricane does, would take "an estimated formation time for a strong tornado of 83 min," too long, while a supercell's low-level horizontal vorticity "can be 50 times" the planetary value. Abrupt turning of the flow at a gust front was tested in a simulation and "does not happen." A vortex extending itself downward like a pipe "works only when the air near the ground already has considerable angular momentum." And the observations agree: "the cyclonic tornado does not form in the middle of the updraft as might be expected based on the theory, but on one side with a downdraft nearby."[5]
Where the near-ground spin comes from
In the models, "rotation near the ground develops through tilting of horizontal vorticity, which is generated baroclinically in subsiding air that has spent 15 min or longer in a horizontal buoyancy gradient." Baroclinic means generated by a horizontal difference in density: along the edge of the rain-cooled air, cold beside warm, the air acquires a rolling motion in the same way shear gives it one. Air descending through that gradient in the downdraft picks up horizontal vorticity, and "the vorticity in this air changes from anticyclonic to cyclonic during its descent because the vorticity vector is inclined upward relative to the velocity vector." Its cyclonic vorticity "is then greatly amplified by vertical stretching as it passes into the updraft."[5] The back-of-envelope arithmetic in the review is striking: a temperature difference of "just 2 K" across a circuit a kilometer deep, acting for about 17 minutes, is enough circulation for a strong tornado.[5]
The VORTEX2 field project measured this happening. In the Goshen County, Wyoming supercell of June 5, 2009, "the circulation of material circuits that converge upon the low-level mesocyclone is principally acquired along the southern periphery of the forward-flank precipitation region, which is a corridor characterized by a horizontal buoyancy gradient; thus, much of the circulation appears to have been baroclinically generated."[11] Then, "several minutes prior to tornadogenesis, the rear-flank downdraft intensifies, and a secondary rear-flank downdraft forms and cyclonically wraps around the developing tornado. Kinematic and thermodynamic analyses suggest that horizontal vorticity created in the forward flank and hook echo is tilted and then stretched near the developing tornado." Also: "Tornadogenesis does not proceed steadily."[12]
A 2017 simulation at 30 m resolution added a feature the field data had not resolved: "the consolidation of numerous vortices and vorticity patches along the storm's forward-flank downdraft boundary and the intensification of a feature we call a streamwise vorticity current (SVC), a current of horizontal vorticity that is tilted upward into the storm's low-level mesocyclone." The current "appears to help drive the storm's vigorous low-level updraft," and when it weakens the tornado decays.[13] A 2022 study found the two vorticity mechanisms hand off: "pretornadic vertical vorticity maxima are generated via the downdraft mechanism, while the dynamics of a fully developed vortex are dominated by the in-and-up mechanism," in which horizontal vorticity is tilted upward "practically at the surface by a strong updraft gradient."[15]
The temperature of the downdraft
The early simulations produced their near-ground rotation with cold outflow, and the first surprise of the field programs was that the strongest tornadoes did not have it. Paul Markowski's mobile mesonet measurements at 3 m in the rear flank downdrafts of supercells found that "tornadogenesis is more likely and tornado intensity and longevity increase as the surface buoyancy, potential buoyancy (as measured by the convective available potential energy), and equivalent potential temperature in the RFD increase, and as the convective inhibition associated with RFD parcels at the surface decreases." Moreover, "baroclinity at the surface within the hook echo is not a necessary condition for tornadogenesis," and "environments characterized by high boundary layer relative humidity (and low cloud base) may be more conducive to RFDs associated with relatively high buoyancy."[9] Davies-Jones summarizes: strong and violent tornadoes "were located only in modest temperature and entropy gradients, while strong temperature gradients sustained only weak tornadoes."[5] NSSL's public page says the same in plainer words: "very little temperature variation was observed near some of the most destructive tornadoes in history."[2]
The reconciliation is that the downdraft has to be cool enough to generate rotation and warm enough to be lifted afterward. Markowski and Yvette Richardson built idealized simulations with a heat source for the updraft and a heat sink for the rain to test the balance. "An intense cyclonic vortex forms in the simulations in which the environmental low-level wind shear is strong and the heat sink is of intermediate strength ... Intermediate heat sinks result in the development (baroclinically) of substantial near-surface circulation, yet the cold pools are not excessively strong. Moreover, the strong environmental low-level shear lowers the base of the midlevel mesocyclone, which promotes strong dynamic lifting of near-surface air that previously resided in the heat sink." And: "An intense cyclonic vortex fails to form in simulations in which the heat sink is excessively strong or weak or if the low-level environmental shear is weak."[10] In Goshen County the measured deficit was small: "a few kilometers upstream (north) of the location of maximum vertical vorticity, θv is no more than 3 K colder than the warmest θv readings in the inflow of the storm," and trajectories out of that outflow "rise rapidly, implying that the upward-directed perturbation pressure gradient force exceeds the negative buoyancy."[11]
Stretching
The last stage is contraction. "In convergent flow beneath a strong updraft, the low-level vortex contracts horizontally and spins up. This hypothesis is consistent with analyses that reveal strong low-altitude convergence prior to the tornado and a large vertical stretching term with a maximum at the tornado."[5] Angular momentum is conserved: halve the radius and the tangential wind doubles. The energy for this is the updraft's low pressure aloft pulling the surface air inward, and the surface itself helps. In the simulations "the contraction of this cyclone into a tornado, happens only in simulations with surface friction," because friction lets air near the ground flow inward across the pressure gradient where air above stays in balance. The consequences are large: friction "can cause maximum winds in quasi-steady tornadoes to increase to 3-4 times the speed limit in the vertical component, more than twice it in the tangential velocity," a speed limit "based on a stagnant-core vortex and a typical CAPE of 2500 J kg-1 in tornado environments" of "around 70 m s-1."[5] Without the ground, a tornado could not be as strong as tornadoes are.
Why most supercells fail
The rotating storm is common; the tornado is not. When Jeffrey Trapp and colleagues checked 5,322 mesocyclones flagged by the WSR-88D radar network's detection algorithm against the tornado record, "only 26% were associated with tornadoes. In terms of height or altitude of mesocyclone base, 15% of midaltitude mesocyclone detections were tornadic, and more than 40% of low-altitude mesocyclone detections (e.g., those with bases ≤ 1000 m above radar level) were tornadic."[17] A low-level mesocyclone is not enough either: three VORTEX storms "generated a moderate-to-strong mesocyclone within the lowest several hundred meters above the ground and qualitatively appeared capable of tornadogenesis, yet did not produce a tornado."[18]
The clearest account of failure comes from simulations run in the two composite environments of VORTEX2, one built from soundings near tornadic supercells and one from soundings near nontornadic ones. "Both environments produce strong supercells with robust midlevel mesocyclones and hook echoes." The nontornadic supercell "readily produces subtornadic surface vortices," but "these vortices fail to be stretched by the low-level updraft. This is due to a disorganized low-level mesocyclone caused by predominately crosswise vorticity in the lowest few hundred meters above ground level within the nontornadic environment. In contrast, the tornadic supercell ingests predominately streamwise horizontal vorticity, which promotes a strong low-level mesocyclone with enhanced dynamic lifting and stretching of surface vertical vorticity."[14] The surface spin was there in both. What differed was whether the updraft above it was organized enough to pull it up. Blending the two wind profiles found a threshold: "simulated supercells become tornadic when the low-level wind profile incorporates at least 40% of the structure from the tornadic VORTEX2 composite environment."[14]
Even so, the outcome is not fully determined by the environment. In an ensemble of 30 simulations with small random perturbations, "each of the 15 members in the tornadic VORTEX2 ensemble produces a long-track, intense tornado," but "40% of the nontornadic VORTEX2 ensemble members become weakly tornadic. This implies that chaotic within-storm details can still play a role."[14] That is the honest answer to why a tornado warning cannot be certain: two identical-looking storms in the same air can end differently.
The failure modes in the field match. Outflow that is too cold and stable cannot be lifted: "a tornado would not form if the air at the ground were so dense and stable that the overlying rotating updraft cannot pull it upwards." Or the outflow surges: "the storm-relative convergent inflow may be too weak to prevent cold-air outflow from surging ahead of the updraft."[5] In either case the rotation is displaced from the lift and the process stalls, sometimes to restart minutes later with the next downdraft surge.
Inside the vortex
Once a tornado exists, its structure is governed by a single number that was worked out in the laboratory before it was seen in the field. Neil Ward's 1972 chamber at NSSL produced vortices by spinning air into a column of rising flow, and found that "only when the diameter of the updraft column exceeds the depth of the inflow layer" could the model produce multiple vortices; "when the ratio is 4, and the angle of inflow θ is very small, 2-3°, a single vortex forms; as θ is increased, the diameter of the core increases proportionately ... when the latter reaches about 30°, a vortex pair develops."[21] The Purdue group formalized the control parameter as the swirl ratio, the ratio of the circulation supplied to the vortex to the volume of air flowing up through it, and mapped the regimes.
Their abstract lists the sequence: "1) a single laminar vortex; 2) a single vortex with breakdown bubble separating the upper turbulent region from the lower laminar region; 3) a fully developed turbulent core, where the breakdown bubble penetrates to the bottom of the experimental chamber; 4) vortex transition to two intertwined helical vortices; and 5) examples of higher order multiple-vortex configurations." The two-cell transition is sharp: "once a critical point was reached, the downflow developed rapidly and immediately penetrated to the lower surface. After this had occurred, the core consisted of an outer, slightly conical shear zone of spiraling upflow surrounding an inner subcore of downward flow." Above a swirl ratio of about 0.5 "the vortex core contains an intense shear zone surrounding a relatively quiescent subcore. It is speculated that an inertial instability in this shear zone is the mechanism which gives rise to the development of subsidiary or 'suction' vortices."[22] A wide, smooth-sided wedge tornado with a calm-looking center and a narrow, violently rotating rope are the two ends of this one scale.
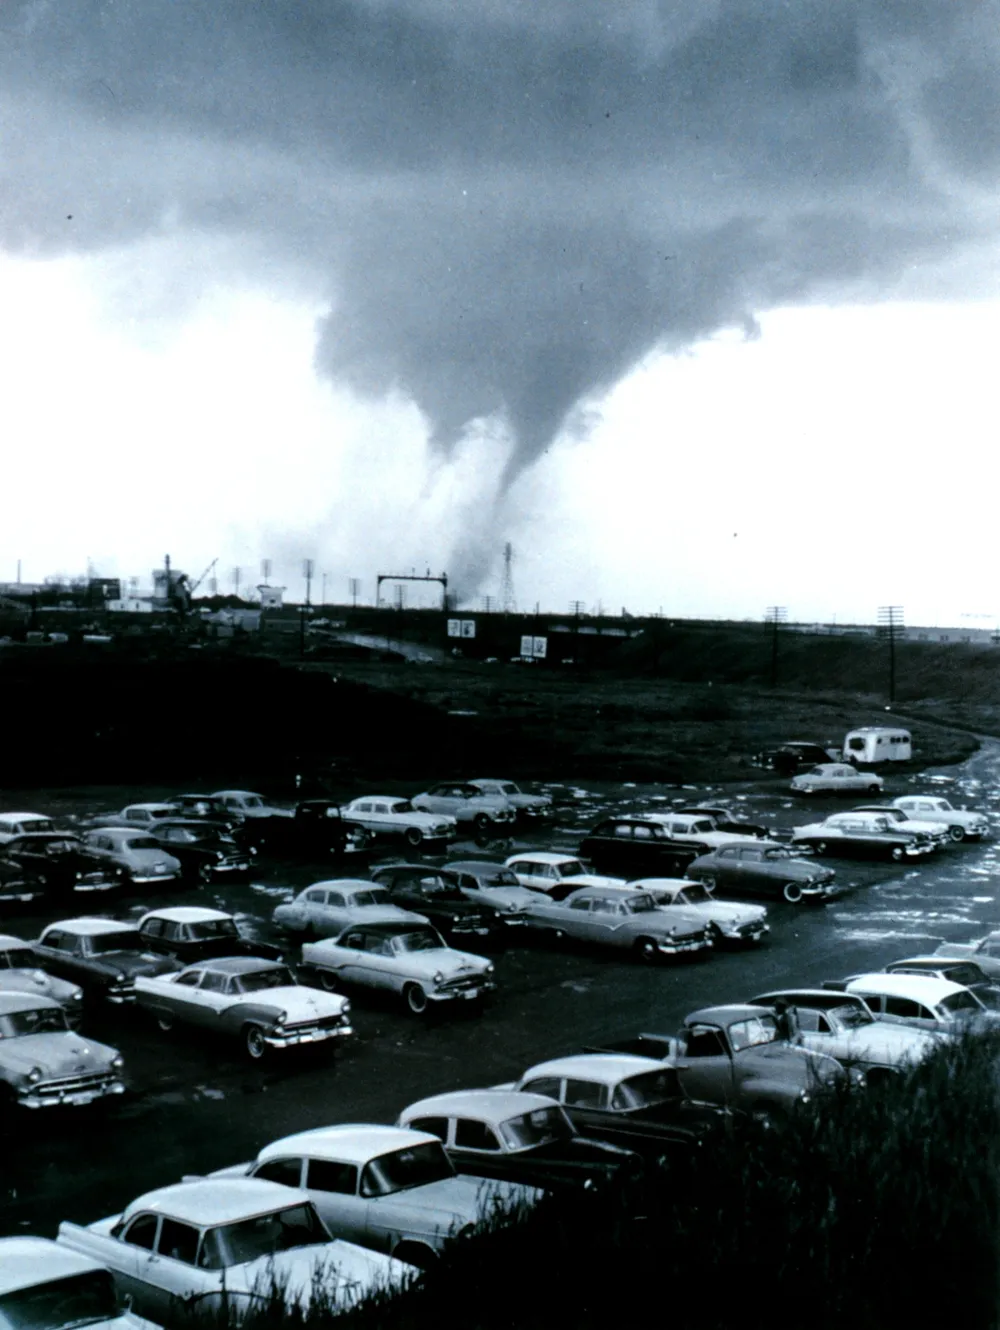
The corner flow
The strongest winds in a tornado are near the ground, which is the opposite of every other wind system. The reason is the corner flow, "that region where the central vortex meets the surface." Friction slows the air in the lowest tens of meters, so it loses its balance against the pressure gradient and rushes inward, overshoots, and turns up. In large-eddy simulations by David Lewellen and colleagues, "it is the radial inertial overshoot of this fluid in the corner flow that provides the chief source of the intensification of swirl velocity and pressure deficit in the mean tornado vortex near the surface. Mean swirl velocities close to the surface reach more than 2.5 times the maximum mean swirl velocities aloft under conditions of peak intensification." The sensitivity of this to the inflow layer "suggests that differences in the near-surface inflow layer may be a critical factor in determining whether an existing supercell low-level mesocyclone spawns a tornado or not."[23]
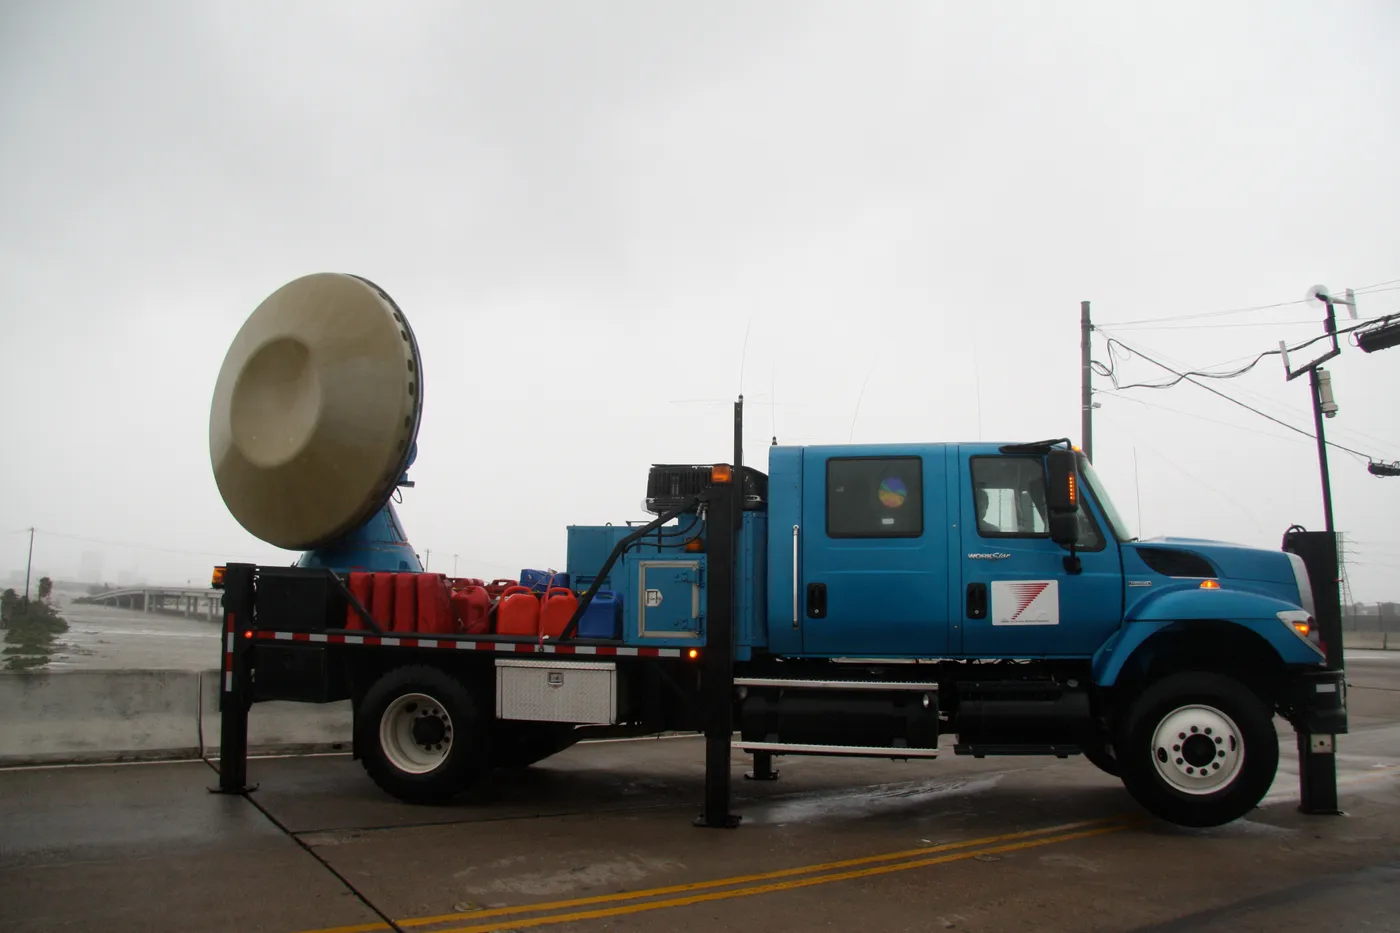
It has been measured once at that scale. A rapid-scan Doppler on Wheels parked 130 m from an EF2 tornado near Russell, Kansas, on May 25, 2012, scanned it at 4 to 17 m above the ground every 7 seconds. "The peak wind intensity is very near the surface at ~5 m AGL, about 15% higher than at 10 m AGL and 25% higher than at ~40 m AGL"; "much of the inflow (from −1 to −7 m s−1) is at or below 10-14 m AGL, much shallower than reported previously"; and the analyses "revealed a two-celled tornado vortex structure, with a downdraft inside the RMW."[27] The authors' conclusion applies to every radar wind speed ever quoted for a tornado: radar observations "at ~50 m AGL are likely underestimations of the Vg typically occurring at 5-10 m AGL."
What has been measured
The highest wind ever measured in a tornado came from a Doppler on Wheels 1.9 km from the Bridge Creek, Oklahoma tornado of May 3, 1999: "peak Doppler wind speeds of 135 m s-1 occurred at 32 m AGL" in "a roughly 350-m diameter circulation."[25] That is 302 mph, and the paper is careful about what it is: "care must be taken when comparing these Doppler measurements at 32 m AGL to time-averaged anemometer measurements at 3 or 10 m or inferences from damage occurring at 3-5 m AGL." Radar "beam spreading by 16 m km-1 and blockage by foliage, buildings, and terrain usually preclude measurements by radar below 30 m AGL."[25] The El Reno tornado of May 31, 2013 produced a comparable figure by a different route: a subvortex inside the 2.6-mile circulation was tracked "at speeds of up to 79 m s-1 (the fastest ever documented)" and contained Doppler velocities above 115 m/s; adding its unobserved motion gives "peak Vg in this vortex ranges from 130 to 150 m s-1," but "the duration of Vg > 130 m s-1 over a stationary object or observer is <~0.6 s" and "the 3-s average Vg caused by this subvortex would be <100 m s-1."[26] The wind record of both tornadoes is taken apart on their profile pages.
Pressure has been measured on the ground. A probe placed in the path of the Manchester, South Dakota tornado of June 24, 2003 recorded a fall "from the initial pressure of 950 mb" to "a minimum value of 850 mb," "a 100 mb drop," in a symmetrical V about a minute wide as the tornado crossed at 9.3 m/s. Fitting a vortex model to the trace gave a core radius of 45 m and a peak wind of 92 to 98 m/s, and "the tornado had global characteristics similar to a single-cell vortex."[28] Across nine tornadoes sampled with such probes between 2002 and 2008, "peak near-ground pressure deficits ranged from 5 to 100 hPa, with maximum instantaneous 3-m wind speeds of 40-50 m s-1 in the three cases where mobile mesonet data were available."[29]
Size and duration
Harold Brooks fit the path lengths and widths of over 40,000 tornadoes from 1950 to 2001 and found that "the mean length roughly doubles with each value of the F scale from F1 to F4": 1.4 km at F0, 4.7 at F1, 10.7 at F2, 22.5 at F3, 43.6 at F4 and 54.6 at F5, with mean widths from 28 m at F0 to 556 m at F5. "Less than 5% of tornadoes with path lengths of 25 km are rated F0," and "less than 10% of tornadoes with widths of 500 m are rated F0 or F1."[30] The medians in the table under the first chart, computed from the 1996 to 2025 record, tell the same story with the more recent data. The Storm Prediction Center's summary for duration is that "most tornadoes last less than 10 minutes."[3] The Enderlin EF5 below lasted 16 minutes; Mayfield's EF4 lasted nearly three hours.
Tornadoes without a supercell
The glossary calls a landspout "a tornado ... occurring with a parent cloud in its growth stage and with its vorticity originating in the boundary layer. The parent cloud does not contain a preexisting midlevel mesocyclone."[1] The mechanism was worked out from 27 such vortices near Denver in 1987 by Roger Wakimoto and James Wilson: "They appeared to form as shear instabilities along radar detected convergence lines. The circulations initiated at low levels generally in the absence of precipitation echo. Subsequently as these vortices propagated along the convergence line they appeared to strengthen to tornadic intensity when they became colocated with the updraft of a rapidly developing storm. It is hypothesized that vortex stretching is responsible for intensifying the initial rotation." They "were weaker than those accompanied by strong midlevel mesocyclones," but "estimates of their strength suggest damage capability as high as F2."[31] This is the supercell process with the first two stages removed: the spin is already at the ground, on a boundary, and a growing cumulus stretches it.
Lines of storms produce tornadoes too. Classifying every United States tornado from 1998 to 2000 by its parent storm on radar, Trapp and colleagues found that "of the 3828 tornadoes in the database, 79% were produced by cells, 18% were produced by QLCSs, and the remaining 3% were produced by other storm types, primarily rainbands of landfallen tropical cyclones." The line tornadoes "displayed a comparatively higher and statistically significant tendency to occur during the late night/early morning hours," and "QLCSs produced many more F1 yet many fewer F2-F3 tornadoes than cells did."[32] In simulations of such lines the vortices form differently from a supercell's: "mesovortexgenesis is initiated at low levels by the tilting, in downdrafts, of initially crosswise horizontal baroclinic vorticity," and "many of the mesovortices form first within the lowest several hundred meters above the ground and thereafter grow upward," with the Coriolis force playing "a direct role."[33] Line tornadoes also need less fuel: "45% of the QLCS tornado events were associated with MLCAPE < 500 J kg-1, compared to only 15% of discrete RM tornado events."[20]
Waterspouts, "usually of non-supercell origin" in the Storm Prediction Center's words,[3] were documented from aircraft in the Florida Keys in 1969: 95 in one season, with a life cycle of five stages beginning with "the dark spot ... which represents a complete vortex column from cloud base to sea surface," and ending "when waterspout dissipation (often abrupt) is initiated by cool downdrafts from a nearby developing rain shower." Dark spots "were never observed without a parent cumulus cloud above," and "multiple dark spots form along a quasi-vertical vortex sheet and are therefore caused by a shearing instability," the landspout mechanism over water.[34]
How a tornado ends
The same outflow that made the tornado kills it. A study of four VORTEX2 supercells found that "the longest-lived tornado is maintained underneath the midlevel updraft within a zone of low-level horizontal convergence along a rear-flank gust front for a considerable time, and dissipates when horizontally displaced from the midlevel updraft," and "in three cases, we hypothesize that tornado decay occurred when each tornado became embedded within strong rear-flank downdraft." Their general conclusion: "tornado intensity and duration appear to be governed more by the ability of a storm to transport angular momentum inward toward the axis of rotation rather than by the strength of the mesocyclone."[35] At the surface the sign is a change of wind direction: in the Russell tornado "surface outflow precedes tornado dissipation."[27]
Many supercells do it again. In a four-hour simulation "the storm's mesocyclone undergoes two distinct occlusions": "the developing RFD wraps cyclonically around the mesocyclone, causing the gust front to surge outward. Simultaneously, the occluding mesocyclone rapidly intensifies near the surface," then "the old near-ground mesocyclone becomes completely embedded near the surface in divergent outflow beneath the decaying updraft and is advected away by the mean flow," while a new one forms on the gust front downstream. "The occlusion process exhibits a period of approximately 60 min."[36] Airborne radar over the McLean, Texas supercell of June 8, 1995 documented three large tornadoes in sequence and found "the cyclic tornadogenesis process was associated with a mismatch between the horizontal motion of successive tornadoes and the horizontal velocity of the main storm-scale updraft and downdraft." Whether a storm cycles or sustains one long tornado depended on the outflow: "the strength of outflow from the rear of the storm appeared to influence both the strength of individual tornadoes and whether tornadoes were cyclic or long lived."[37] The tornado families of May 3, 1999 and December 10, 2021, both in the examples, are this process on the ground.
Seeing it on radar
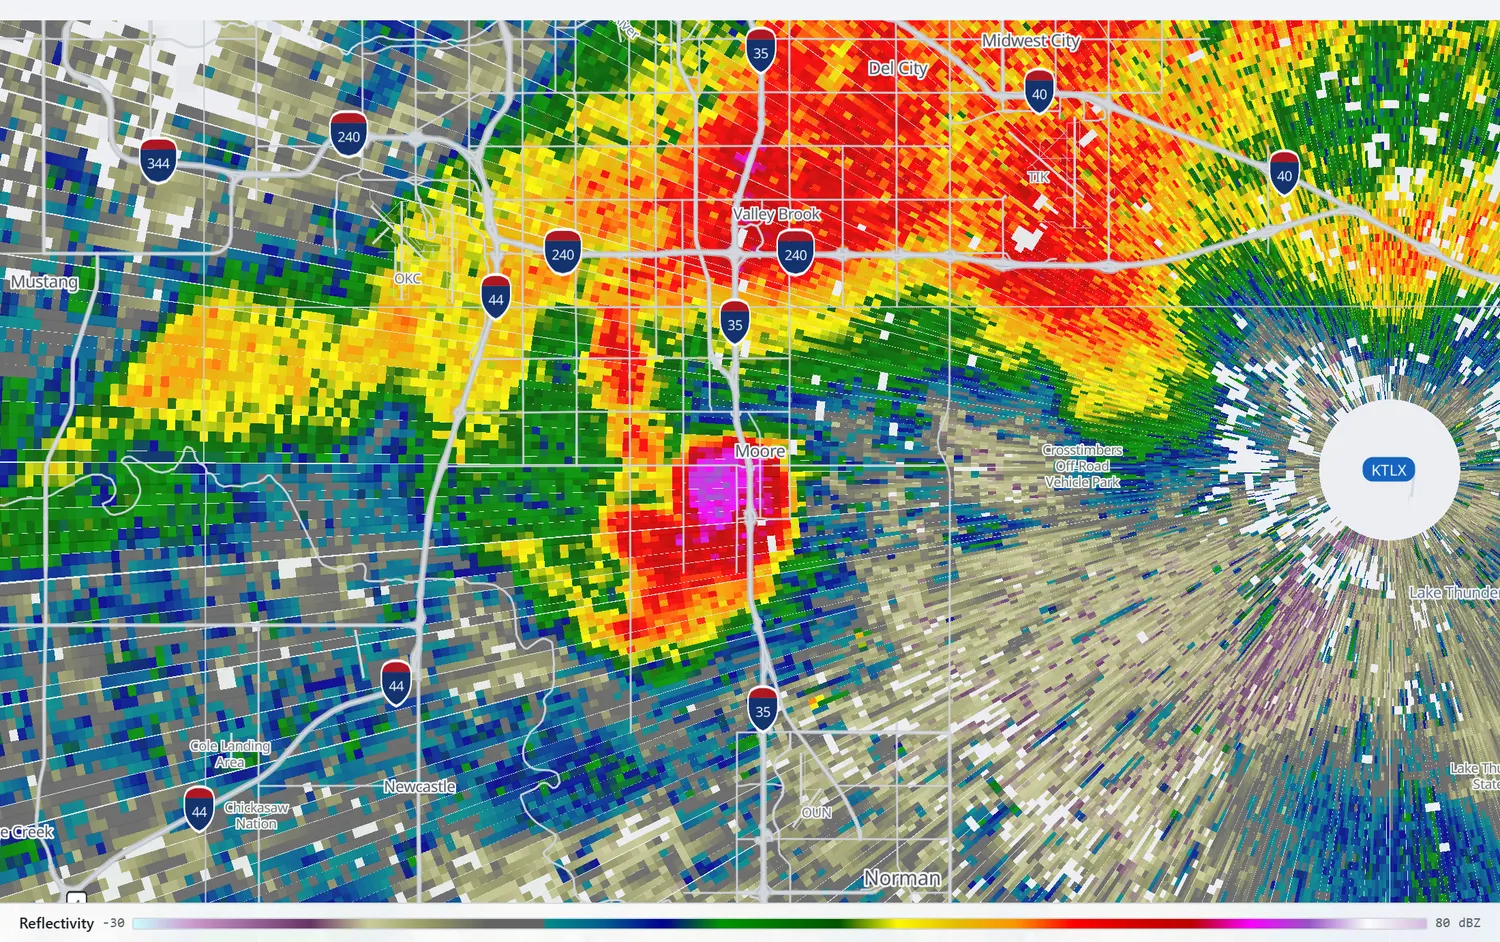
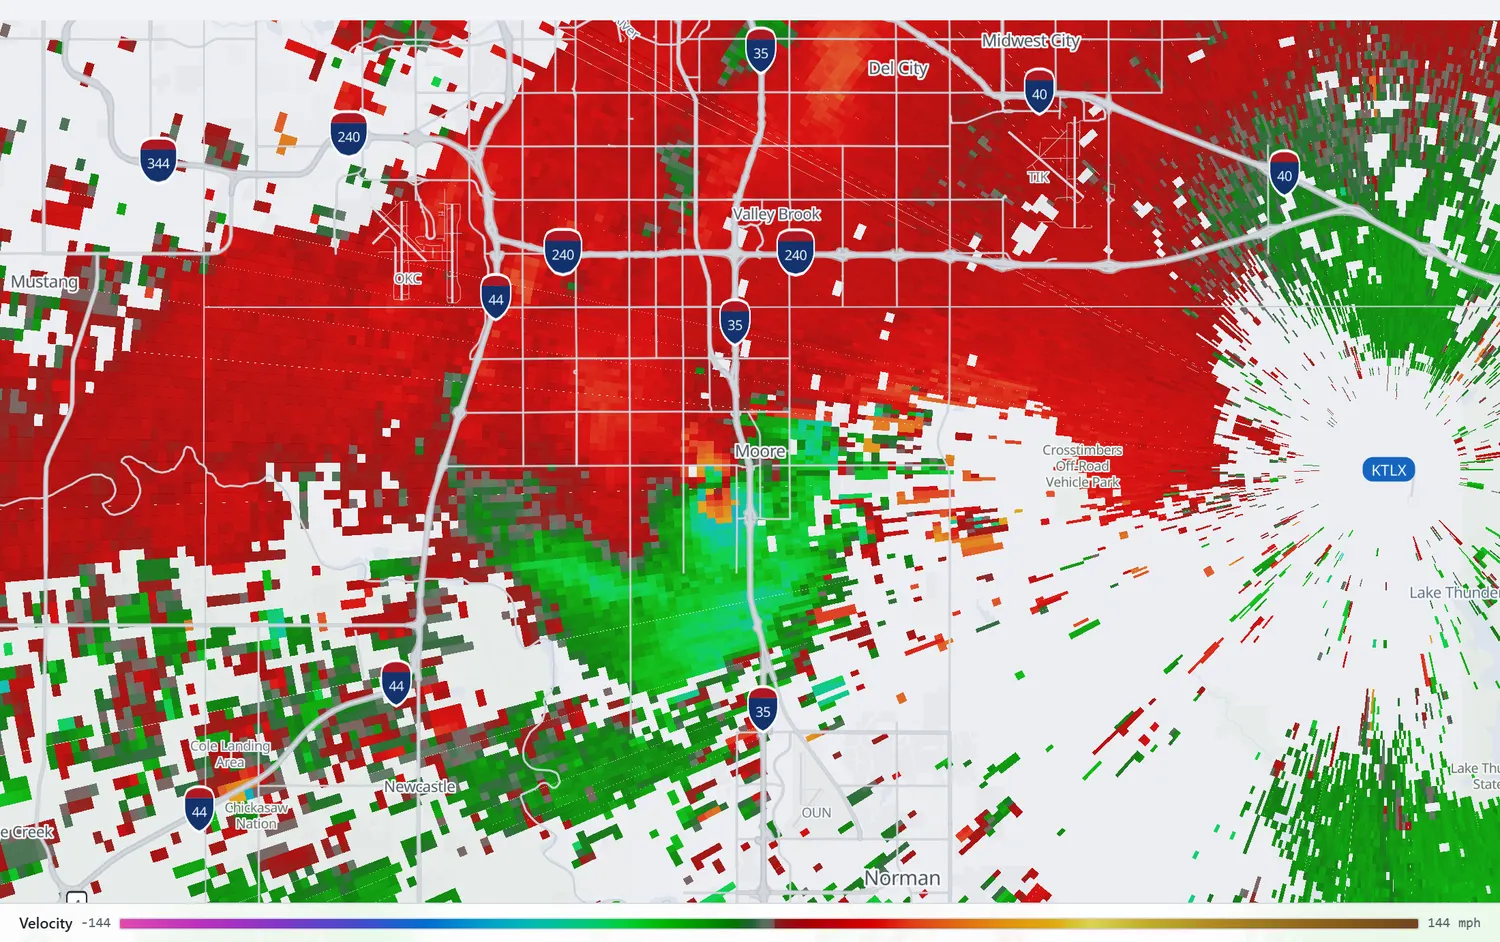
Every stage above has a radar signature, and the order they appear in is the order of the process. The mesocyclone shows as a couplet of inbound and outbound velocities a few kilometers apart. The tornadic vortex signature, defined at NSSL from the Union City, Oklahoma tornado of May 24, 1973, is "mean Doppler velocity extrema (of opposite sign) that occur about one beamwidth apart, regardless of vortex size or strength." It "originates at storm mid-levels within a parent mesocyclone, descends to the ground with the tornado (extending vertically at least 10 km), and finally dissipates at all heights when the tornado dissipates." In the 1973 case "it took at least 25 min for the signature to work its way down to the ground," which is the warning opportunity: "since the TVS first appears aloft tens of minutes before tornado touchdown, the signature has decided potential for real-time warning."[38]
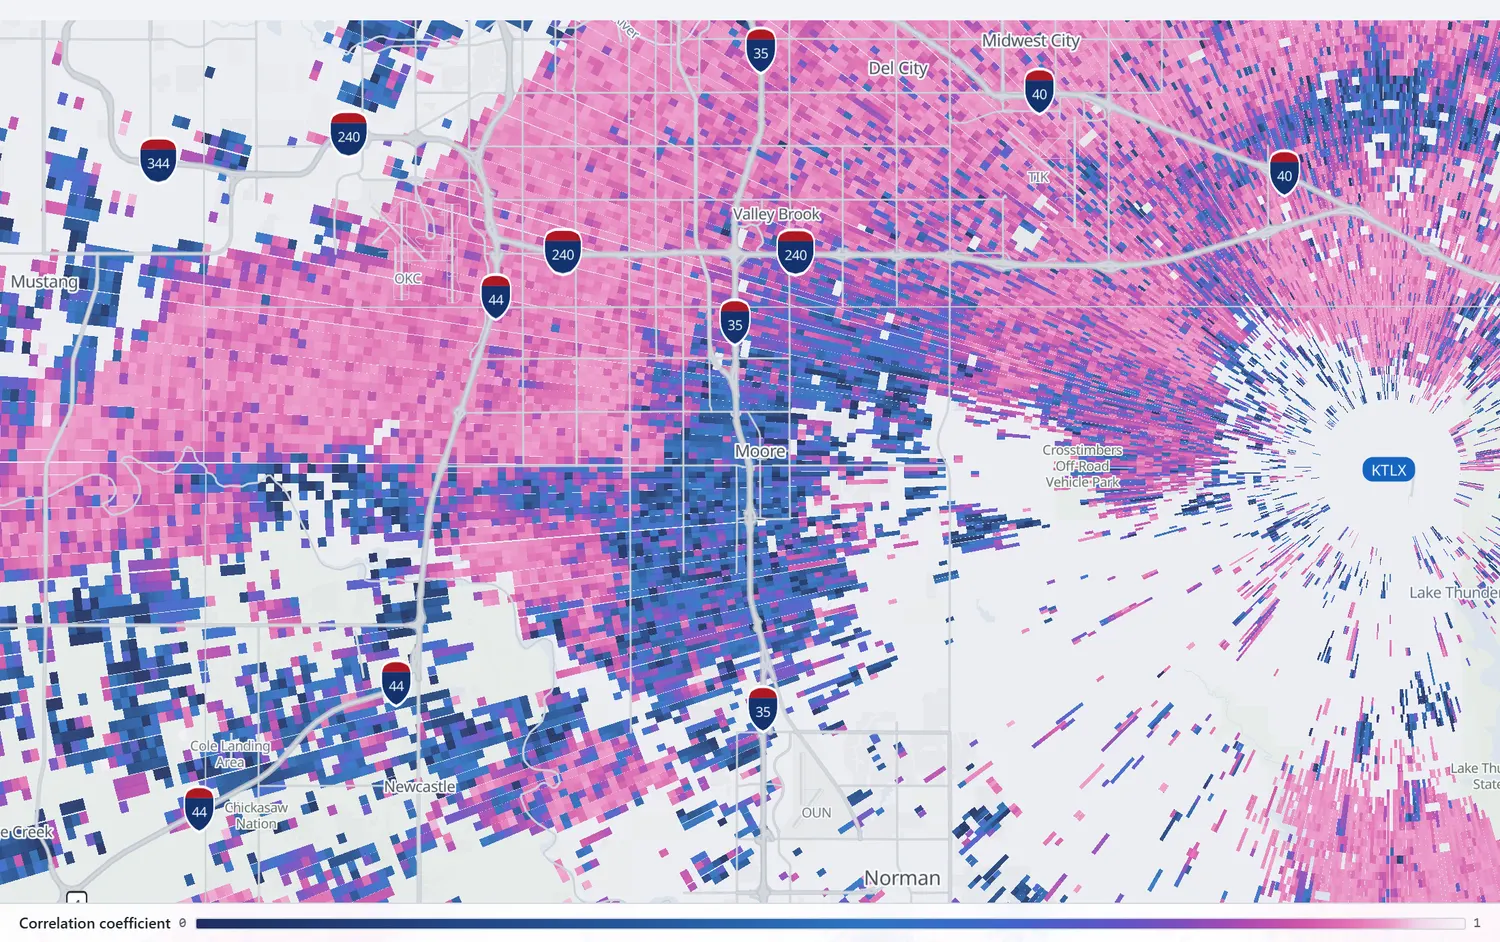
Dual-polarization radar, now standard across the national network, sees the tornado itself once it is lofting debris. The tornadic debris signature is "anomalously low cross-correlation coefficient ρhv and differential reflectivity ZDR," because "debris particles have large sizes, very irregular nonspherical shapes, a high refractive index, and a low degree of common alignment." The criteria: "1) the presence of a hook echo, 2) ρhv < 0.8, 3) a pronounced vortex signature in the Doppler velocity field, 4) ZDR < 0.5 dB, and 5) Z > 45 dBZ."[39] Other polarimetric features mark the process upstream. The ZDR arc, "a shallow region of very high ZDR ... on the southern edge of the FFD," is produced by size sorting of raindrops in the veering low-level wind, and "the strength of the ZDR arc signature (i.e., the degree of size sorting) is positively related to low-level storm-relative environmental helicity." The same paper's caution is worth keeping: "most of the obvious and prominent polarimetric signatures (except the TDS) do not provide a clear distinction between tornadic and nontornadic supercells."[40]
The three panels below are the Moore tornado of May 20, 2013 on the Oklahoma City radar at 3:20 pm, rendered from the Level II archive by this site: the hook, the couplet and the debris signature at one moment.
What radar cannot do is see the tornado's own winds at any distance. The lowest routine scan of a WSR-88D is tilted 0.5 degrees above the horizon, the Earth curves away beneath it, and the beam is about a degree wide. NOAA's own illustration uses the Jarrell storm: sampled at 20 miles, "the beam height was approximately 1,300' above the ground and the beam width was about 2,000'"; from Fort Worth at 98 miles "the beam height was approximately 11,600' above the ground and the beam width was nearly 2 miles."[44] The chart below is the standard geometry, computed here. A tornado lives in the lowest kilometer, and its core is a few hundred meters wide. Beyond about 60 km the beam's center is above it and its width exceeds it; the radar sees the mesocyclone and, with luck, the debris, but never the wind that did the damage. That is why the wind records above come from trucks.
Table: beam center height and beam width by range
| Range, km | 0.5° beam center, m above radar | Beam width, m | 1.5° beam center, m |
|---|---|---|---|
| 25 | 255 | 415 | 691 |
| 50 | 583 | 829 | 1,456 |
| 75 | 986 | 1,244 | 2,294 |
| 100 | 1,461 | 1,658 | 3,206 |
| 125 | 2,010 | 2,073 | 4,191 |
| 150 | 2,633 | 2,487 | 5,249 |
| 175 | 3,329 | 2,902 | 6,381 |
| 200 | 4,099 | 3,316 | 7,586 |
| 230 | 5,119 | 3,814 | 9,130 |
When tornadoes form
The diurnal cycle in the record is the diurnal cycle of the ingredients. Heating builds CAPE through the afternoon and erodes the cap; the low-level jet strengthens after sunset and raises the low-level shear while the surface cools. The result is a peak between 5 and 6 pm Central Standard Time, with 53 percent of tornadoes rated F1 or stronger between 3 pm and 9 pm and 23 percent between 9 pm and 6 am. NSSL's summary is "most tornadoes occur between 4-9 p.m."[2][41] The night share is not small, and two of the nine examples below, Enderlin and Mayfield, are in it.
Table: tornado starts by hour, 1996 to 2025
| Hour, CST | F1 and stronger | F3 and stronger |
|---|---|---|
| 0:00 | 382 | 22 |
| 1:00 | 329 | 18 |
| 2:00 | 288 | 19 |
| 3:00 | 271 | 21 |
| 4:00 | 286 | 11 |
| 5:00 | 267 | 9 |
| 6:00 | 243 | 9 |
| 7:00 | 232 | 4 |
| 8:00 | 210 | 4 |
| 9:00 | 238 | 8 |
| 10:00 | 284 | 13 |
| 11:00 | 365 | 19 |
| 12:00 | 515 | 24 |
| 13:00 | 785 | 51 |
| 14:00 | 1,061 | 78 |
| 15:00 | 1,326 | 87 |
| 16:00 | 1,562 | 95 |
| 17:00 | 1,690 | 116 |
| 18:00 | 1,539 | 105 |
| 19:00 | 1,320 | 97 |
| 20:00 | 970 | 78 |
| 21:00 | 697 | 57 |
| 22:00 | 589 | 32 |
| 23:00 | 501 | 25 |
Where the ingredients overlap most often is the subject of the companion article on Tornado Alley, which maps 76 years of the same database. In brief: the Plains have the most reliable spring season, the lower Mississippi valley has the most significant tornadoes per unit area, and the balance has shifted east.
Nine setups, textbook and not
The theory above is what a forecaster has in mind when reading a sounding at breakfast. What follows is what the readings looked like before nine tornadoes: the Storm Prediction Center's outlook as issued, the nearest balloon sounding, and what the storm did. The hodographs are drawn from the soundings, and the parameters are computed here by one method, so they are comparable with each other but not exactly with the operational numbers, which use hourly model analyses at the storm's own location. Five of the nine were called well in advance. Four were not, and those are the instructive ones.
Table: parameters computed from each sounding
| Tornado | Rating | Sounding | MLCAPE, J/kg | ML cloud base, m | SRH 0 to 1 km, m²/s² | SRH 0 to 3 km | Shear 0 to 1 km, m/s | Shear 0 to 6 km, m/s | 700 to 500 hPa lapse rate, °C/km |
|---|---|---|---|---|---|---|---|---|---|
| Moore, OK, May 20, 2013 | EF5 | Norman, 1 pm CDT | 3,117 | 887 | 136 | 167 | 10.1 | 26.5 | 8 |
| El Reno, OK, May 31, 2013 | EF3 | Norman, 7 pm CDT | 3,304 | 873 | 286 | 404 | 12.8 | 28.6 | 7.3 |
| Bridge Creek, OK, May 3, 1999 | F5 | Norman, 7 pm CDT | 2,285 | 755 | 231 | 317 | 12.9 | 21.4 | 8.3 |
| Greenfield, IA, May 21, 2024 | EF4 | Topeka, 1 pm CDT | 3,027 | 1,035 | 87 | 19 | 7.9 | 33.6 | 8.5 |
| Mayfield, KY, Dec 10, 2021 | EF4 | Little Rock, 6 pm CST | 1,796 | 756 | 411 | 428 | 20 | 40.8 | 7.7 |
| Enderlin, ND, June 20, 2025 | EF5 | Aberdeen, 7 pm CDT | 4,224 | 1,870 | 209 | 372 | 12 | 27.3 | 8.9 |
| Menasha, WI, July 27, 2026 | EF3 | Green Bay, 7 am CDT | 3,488 | 758 | 112 | 348 | 6.9 | 25.9 | 6.9 |
| Plainfield, IL, Aug 28, 1990 | F5 | Peoria, 7 pm CDT | 4,333 | 716 | 80 | 125 | 9 | 19 | 6.7 |
| Jarrell, TX, May 27, 1997 | F5 | Fort Worth, 7 pm CDT | 1,639 | 959 | 38 | 178 | 3.5 | 21.5 | 7.8 |
- 0 to 1 km
- 1 to 3 km
- 3 to 10 km
- Storm motion, right-moving supercell
Moore, Oklahoma, May 20, 2013: the textbook Plains day
The setup. A slow-moving front from southeast Kansas to southwest Oklahoma intersected a dryline in western Oklahoma, under a 65-knot mid-level jet arriving from New Mexico. The 1 pm Norman sounding above had MLCAPE of 3,117 J/kg, no inhibition left, a cloud base at 887 m and 26.5 m/s of deep shear, with 0 to 1 km helicity of 136 m²/s².[42]
The forecast. A Moderate risk. The 11:30 am outlook: "Initial tstms will become supercellular quickly with very large hail likely as hodographs/instability will be quite favorable ... along with a few tornadoes. The greatest risk for a couple of strong tornadoes should exist from s-cntrl into e-cntrl OK." It also hedged, in a way that reads differently afterward: "with predominant swly component to low-level flow and moderate 0-1 km shear ... overall tornado intensity/longevity may be tempered, especially with convection expected to grow upscale so quickly."[46]
What happened. A supercell that formed southwest of Oklahoma City produced an EF5 from 2:56 to 3:35 pm, 14 miles long and up to 1.1 miles wide, through Moore, killing 24.[47] The lesson is in the hedge. The environment was not extreme in low-level shear; it was extreme in instability and adequate in everything else, and the first discrete storm in that air, before the line formed, was enough. "A few tornadoes" in an outlook has never meant weak ones.
Bridge Creek and Moore, Oklahoma, May 3, 1999: a morning that looked ordinary
The setup. The 7 am Norman sounding had MLCAPE of about 1,300 J/kg and 0 to 6 km shear of only 17 m/s, though the 0 to 1 km helicity was already 190 m²/s². By 7 pm, with the tornado on the ground, the same site showed MLCAPE of 2,285 J/kg, helicity of 231 in the lowest kilometer and 317 in the lowest three, and 21 m/s of deep shear.[42]
The forecast, in steps. The overnight and 7:46 am outlooks carried a Slight risk with "isolated tornadoes." At 11:15 am the center went to Moderate: "clearing skies evident on visible images will further contribute to strong destabilization over region with late afternoon MUCAPEs forecasted from 3500 to 4500 J/kg," and "50 kt mid level swly flow spreading over low level jet axis will provide sufficient shear for a few strong or violent tornadic supercells given the abundant low level moisture and the high instability." At 3:49 pm, with storms already forming, it went to High.[46]
What happened. The ninth tornado from one supercell was an F5 on the ground from 6:23 to 7:48 pm over 38 miles, in which a Doppler on Wheels measured the 135 m/s wind quoted above and 36 people died.[48] The lesson: the morning sounding is a starting point. What changed between 7 am and 4 pm was clearing, heating, the low-level jet and the approach of a short wave, and each step of the forecast tracked one of them. This tornado's profile follows the warnings.
Greenfield, Iowa, May 21, 2024: shear that arrived on schedule
The setup. Morning storms had left an outflow boundary across Iowa; a cold front was approaching it from the west with a surface low deepening along it. The 1 pm Topeka sounding, 130 miles south-southwest and three hours ahead, had MLCAPE of 3,027 J/kg and 33.6 m/s of deep shear but only 87 m²/s² of 0 to 1 km helicity, because the low-level winds had not yet responded to the low.[42]
The forecast. A Moderate risk with a 15 percent hatched tornado probability, and a Particularly Dangerous Situation tornado watch at 1:10 pm.[49] The 11:40 am outlook explained the timing: "a noteworthy strengthening of mid-level winds 3-7 km AGL ... will rapidly occur through the afternoon/evening," storms would form "as the cold front impinges on a retreating outflow boundary from the morning storms," and "several tornadoes, including some strong with EF2+ potential, are expected ... This includes the possibility of long-track supercells/tornadoes."[46]
What happened. An EF4 from 2:57 to 3:43 pm over 42 miles into Greenfield, five dead, with a Doppler on Wheels measuring winds above 260 mph near the town.[49] By 7 pm the Springfield, Missouri sounding in the same warm sector showed 0 to 1 km helicity of 331 m²/s². The lesson: a hodograph is a snapshot, and the outlook is about where it is going. The boundary was the other half; the storms formed on it, and it supplied the low-level rotation the balloon upstream did not yet see.
Mayfield, Kentucky, December 10, 2021: shear with modest fuel, at night, in December
The setup. Dew points of 65 to 70 °F in December, a strengthening low-level jet, and a hodograph that is the longest in the gallery. The 6 pm Little Rock sounding had MLCAPE of 1,796 J/kg, 0 to 1 km helicity of 411 m²/s², 20 m/s of shear in the lowest kilometer and 40.8 m/s over 6 km.[42]
The forecast. A Moderate risk. The 10:18 am outlook: "Deep-layer southwesterly winds will be strong with long hodographs and some low-level, clockwise curvature in the warm sector (effective bulk shear in excess of 70 kt and effective SRH in excess of 300 m2/s2). MLCAPE of 1000-2000 J/kg, combined with the strong vertical shear, will favor supercells capable of producing a few strong tornadoes."[46]
What happened. An EF4 on the ground for 165.6 miles from 8:54 to 11:48 pm, reaching Mayfield at 9:26 pm, 57 dead: the second and longer of the two EF4 tornadoes that made up the path first reported as one 250-mile track.[50] The lesson is the one the Storm Prediction Center's climatology already gave: instability was ordinary and the low-level shear was extreme, and that combination produced the longest-tracked tornado in decades. The cool-season Southeast pattern is the subject of the Dixie Alley section of the companion article.
El Reno, Oklahoma, May 31, 2013: everything, and a warning about mode
The setup. Eleven days after Moore, dew points near 70 °F, "widespread very steep mid level lapse rates" and a cap that "should restrain deep convection through much of the day allowing strong heating." The 7 pm Norman sounding, during the tornado, had MLCAPE of 3,304 J/kg, 0 to 1 km helicity of 286 m²/s² and 0 to 3 km helicity of 404.[42]
The forecast. A Moderate risk: "shear vectors perpendicular to the N-S dryline over central OK will favor discrete storm structures ... it appears the threat of a few strong/violent tornadoes are in place," with "portions of central/eastern OK" to "be considered for an upgrade to high risk at 20Z."[46]
What happened. The widest tornado on record, 2.6 miles by radar, from 6:03 to 6:43 pm, rated EF3 on the damage it found in open country while mobile radars measured winds comparable to Bridge Creek's; eight people died, all in vehicles.[51] The lesson is about what the outlook cannot tell you: the environment supported violent tornadoes, the outlook said so, and the tornado that came was unlike any other in its size and its erratic motion. The profile covers the rating.
Enderlin, North Dakota, June 20, 2025: an EF5 in an Enhanced risk, at night
The setup. A deepening upper trough over the northern Rockies, dew points in the low 70s °F in the Red River valley, and a warm layer aloft. The 7 pm Aberdeen sounding, 150 miles southwest, had MLCAPE of 4,224 J/kg under a 700 to 500 hPa lapse rate of 8.9 °C/km, the steepest in the gallery, but a cloud base of 1,870 m and 0 to 1 km helicity of 209 m²/s².[42]
The forecast. An Enhanced risk with a 10 percent tornado probability. The 11:25 am outlook: "An upgrade to MDT risk was considered, but will maintain ENH due to diversity of solutions in various model guidance and uncertainty of corridor of greatest threat." For eastern North Dakota: "late initiation of storms, warm temperatures in the 850-700mb layer, and rapid storm interactions lend uncertainty regarding the evolution of this activity."[46] The picture sharpened after dark. Tornado Watch 448 was issued at 7:50 pm. A mesoscale discussion at 8:15 pm expected storms to become surface-based "within an hour" and noted "the potential for a strong tornado." Another at 9:08 pm described "a pair of long-lived supercells" moving into MLCAPE near 4,000 J/kg with a strengthening low-level jet, and said "strong (EF-2 to EF-3) tornadoes" were possible before the storms merged with an approaching line around 11 pm.[52]
What happened. A tornado warning at 10:42 pm on radar-indicated rotation; touchdown at 11:04 pm; a Particularly Dangerous Situation statement at 11:11 pm for a confirmed large tornado; and 16 minutes on the ground that threw a freight train and, fifteen weeks later, earned the first EF5 rating in the United States since Moore. Three people died.[53] The lesson: the forecast's uncertainty was real and was stated, the low-level jet after sunset supplied the shear the afternoon sounding lacked, and the mesoscale discussion got the timing and the storms right while missing the intensity by two categories. Night tornadoes in high-CAPE, high-cloud-base air are the case the checklist below is worst at. The profile has the rating in full.
Menasha, Wisconsin, July 27, 2026: a 2 percent day
The setup. Clusters of storms moving southeast across Wisconsin all morning, ahead of an air mass the National Weather Service in Green Bay called "extremely warm and unstable." The 7 am Green Bay sounding had MLCAPE of 3,488 J/kg above a surface inversion, 0 to 6 km shear of 25.9 m/s, 0 to 3 km helicity of 348 m²/s² but only 112 in the lowest kilometer, and a significant tornado parameter of zero, because the inhibition term zeroed it.[42][54] Upstream at Minneapolis, the same launch had a surface dew point of 27 °C and MLCAPE above 5,500 J/kg.
The forecast. An Enhanced risk with a 2 percent tornado probability at both the 8 am and 11:30 am issuances. The morning outlook: "some tornado risk could exist, but the most prominent concern would be for damaging wind potential." A Severe Thunderstorm Watch, number 519, from 8:40 am to 3 pm, for "scattered damaging wind gusts to 70 mph" and hail to 1.5 inches. No mesoscale discussion covered the Fox Valley before the tornado.[46][55]
What happened. A supercell in one of the clusters produced an EF3 at 11:56 am two miles west-northwest of Appleton that ran south through Fox Crossing and Menasha with winds estimated at 140 mph, dissipating over Lake Winnebago at 12:22 pm. The first tornado warning, on "radar indicated rotation," was issued at 11:59 am, three minutes after touchdown; at 12:17 pm a second warning called it "a confirmed and extremely dangerous tornado" over northern Lake Winnebago. The mesoscale discussion at 12:16 pm noted "strong rotation and TDS from KGRB radar" and put the effective-layer significant tornado parameter downstream at "approaching 4 to 6," with effective shear over 50 knots and steep lapse rates.[54][55][56]
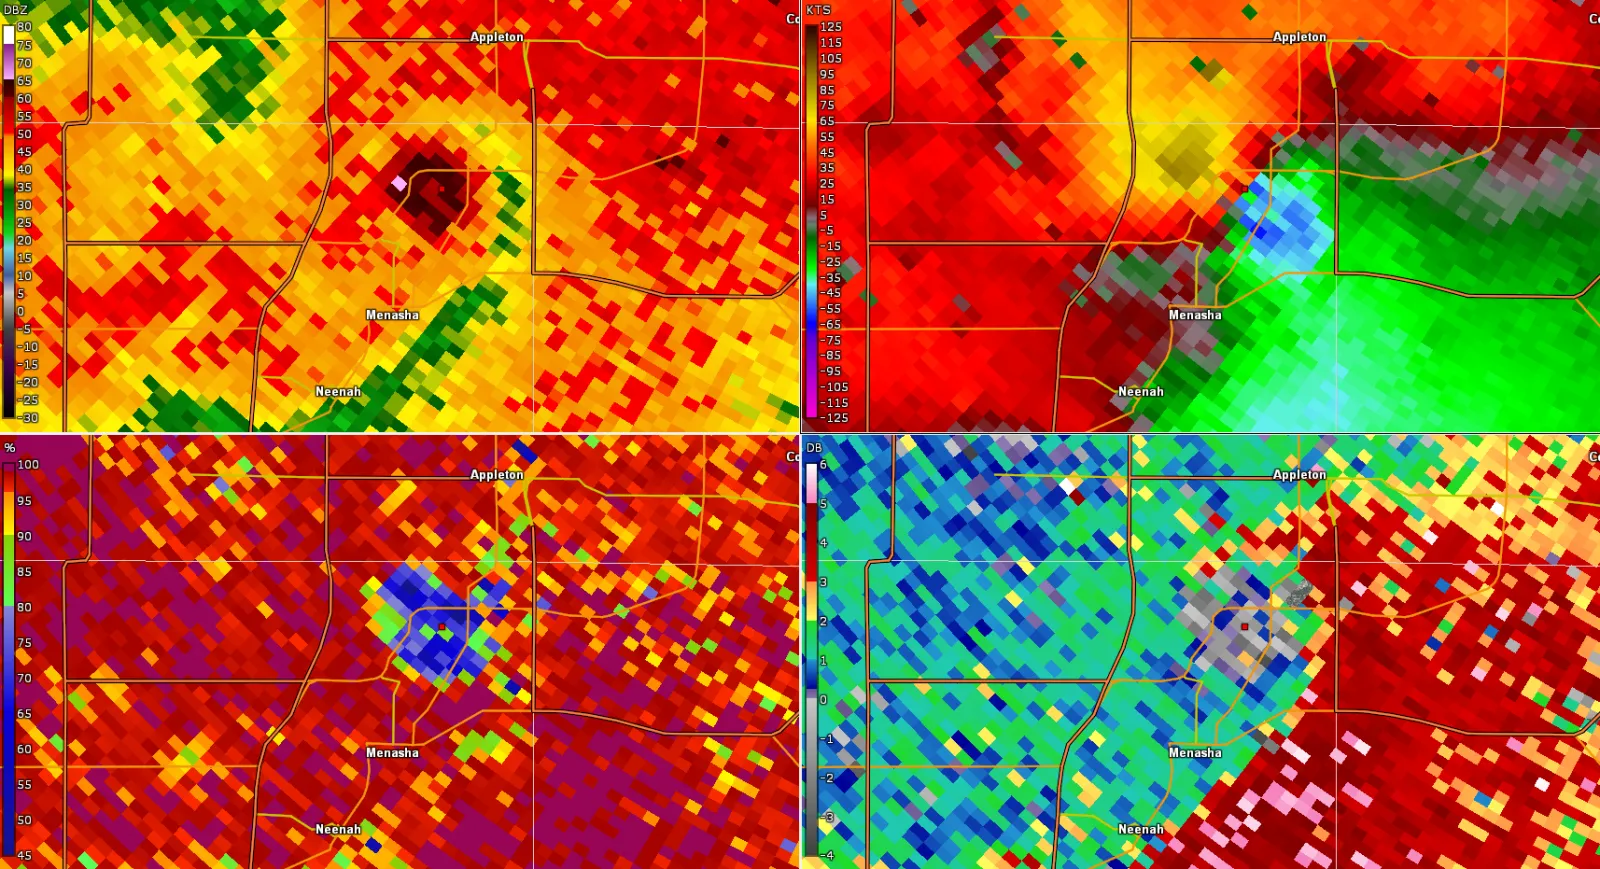
Replay the Appleton to Menasha passage on KGRB, all three products side by side, opening at 12:02 pm.
Open in the archiveThe lesson is the sharpest in the set. Every ingredient was present by noon: extreme instability, supercell shear, steep lapse rates and, once the surface warmed, low-level helicity the morning sounding could not show. The 7 am parameter said zero; the noon parameter said 4 to 6. A Severe Thunderstorm Watch and a 2 percent outlook are not a statement that tornadoes cannot happen; they are a statement that the forecaster judged wind the bigger risk, and on that morning the judgment was defensible and the tornado came anyway. Late-morning tornadoes from clusters of storms, in air that is far more unstable than it is sheared, are the pattern to respect.
Plainfield, Illinois, August 28, 1990: instability without shear, in August
The setup. The National Weather Service in Chicago describes CAPE of 4,000 to "an incredible 7,000 J/kg" and "no low-level shear until surface winds backed." The 7 pm Peoria sounding had a surface dew point of 28 °C, MLCAPE of 4,333 J/kg, 0 to 6 km shear of 19 m/s and 0 to 1 km helicity of 80 m²/s².[42][57]
The forecast. No tornado watch was in effect. Severe thunderstorm warnings were issued through the afternoon; the first tornado warning for Will County came at 3:51 pm, after the tornado had ended.[57]
What happened. An F5 from 3:15 to 3:45 pm over 16 miles through Plainfield and Crest Hill, 29 dead, from a heavy-precipitation supercell whose hook Fujita found "unclear 3:25-3:40 in part because of ground clutter" on the pre-Doppler radar of the day. It remains the only F5 or EF5 recorded in the United States in August.[57] The lesson: the discriminators in the climatology are statistical. Extreme instability with weak deep shear is a poor tornado environment on average and produced a violent tornado once, in a rain-wrapped storm nobody could see into. The profile reconstructs the day.
Jarrell, Texas, May 27, 1997: the exception the theory needs
The setup. CAPE above 6,500 J/kg and almost no shear. The 7 pm Fort Worth sounding had 0 to 1 km helicity of 38 m²/s², 3.5 m/s of shear in the lowest kilometer and 21.5 m/s over 6 km; at 7 am it had been 25, 5 and 17.[42] The storm-scale analysis by Adam Houston and Robert Wilhelmson gives 0 to 6 km shear of 8.5 to 18.6 m/s along the storm's path, "every helicity measure below the 10th percentile" of tornado environments, and calls the environment "unfavorable for significant tornadoes."[58]
What happened. Storms formed by back-building along the intersection of a cold front, the dryline and a gust front, propagating south-southwest against the mean wind at 5 to 10 mph. Jarrell's tornado formed "where Prairie Dell died at the gust front cusp," with an antecedent mesocyclone "less than 4 km wide at 1.5-3 km," and was on the ground from 3:25 to 3:53 pm. It killed 27 of about 132 residents of one subdivision and scoured asphalt from the roads. The warning came at 3:30 pm, at least ten minutes ahead.[58] The lesson: with the environmental shear nearly absent, the rotation came from the storm's own boundaries, the third stage of the process running on baroclinic vorticity almost alone, and the tornado's slow motion did the rest. The profile sets out what is known and what is not.
What to look for
Distilled from the climatologies and the nine cases, for a reader trying to judge tornado potential from a forecast or a sounding.
- Start low. CAPE does not discriminate; the lowest kilometer does. Look for 0 to 1 km helicity above about 200 m²/s², effective bulk shear near 60 knots, and a cloud base below about 1,000 m. Values of the significant tornado parameter above 1 are the discriminating range; above 4 is where EF3 and stronger cluster.
- Read the trend, not the snapshot. Bridge Creek's 7 am sounding looked ordinary; Greenfield's helicity tripled between 1 pm and 7 pm; Menasha's parameter went from 0 to 4 to 6 in five hours. The low-level jet after sunset is the reason Enderlin and Mayfield happened at night.
- Find the boundary. Moore formed at a front-dryline intersection, Greenfield on a retreating outflow boundary, Jarrell on a gust front. Boundaries start the storm and carry the low-level rotation the balloon may not sample.
- Judge the mode. Discrete supercells ahead of a line are the tornado producers; the outlook's language about upscale growth, storm interactions and the cap is about whether they will exist. Moore's outlook hedged on exactly this and the first discrete storm was an EF5.
- Respect instability extremes. Plainfield, Jarrell and Menasha each had CAPE above 3,500 J/kg with unremarkable low-level shear. The climatology says such days rarely produce significant tornadoes, and it is right, but the exceptions are violent.
- Then watch the radar. The tornadic vortex signature appears aloft first and descends over tens of minutes. The debris signature confirms the vortex has reached the ground. Beyond about 60 km the lowest beam is above the tornado itself.
What is still unknown
The last stage remains the open problem. The field measurements that would settle it, the wind and temperature in the lowest hundred meters around a forming tornado, are the hardest to make and the sparsest in the record; VORTEX2's Goshen County storm remains one of a handful of cases with a dual-Doppler analysis of tornadogenesis at that height. The simulations that fill the gap disagree with each other on details and agree that the outcome has a random component. NSSL's page ends with the sentence quoted at the start: "We still have lots of work to do."[2]
The practical frontier is forecasting the last stage before it happens. NOAA's experimental Warn-on-Forecast system, which runs storm-scale model ensembles assimilating radar every few minutes, flagged strong probabilities of intense low-level rotation near Greenfield more than an hour before the tornado.[49] Whether that can be made routine, for a process that three papers in this article describe as partly chaotic, is the question the next decade of the field is organized around.
Video
Methods
Sounding parameters were computed here from the University of Wyoming's archive of the observed radiosonde data, by one method for every case: mixed-layer CAPE and cloud base from the mean of the lowest 100 hPa, lifted pseudoadiabatically with virtual temperature; storm-relative helicity against the Bunkers right-moving storm motion; bulk shear as the vector difference between the surface and the stated height. For the July 27, 2026 Green Bay sounding the results agree with the Storm Prediction Center's own analysis of the same sounding to within a few percent. Special 18 UTC soundings were used for Norman on May 20 and May 31, 2013 and for Topeka on May 21, 2024; the others are the routine 00 or 12 UTC launches, and the text says how far each was from the storm. These are not the operational values, which come from hourly model analyses at the storm's location, and should be read as comparable with each other rather than with the numbers quoted from outlooks.
Database figures use the Storm Prediction Center's tornado file for 1950 to 2025, downloaded in September 2026, whole-track records only, with the Enhanced Fujita scale treated as continuous with the Fujita scale and unknown ratings excluded from rated series. Hours are the database's Central Standard Time. The radar beam chart uses the four-thirds Earth radius refraction model with a 0.95° beamwidth and no antenna height. The illustrations are drawn for this article from the descriptions in the reviews cited, and simplify: they omit the anvil, the forward-flank vortex lines, the anticyclonic member of most pairs, and every detail the sources disagree about.
Related
Eight of the nine examples have full profiles on this site, with the radar replayable scan by scan: Moore, Bridge Creek, Greenfield, Mayfield, El Reno, Enderlin, Plainfield and Jarrell. For what the products issued along the way mean, see Tornado watch vs. tornado warning; for where the ingredients overlap most often, Tornado Alley.
All articles · Tornado profiles · Search the radar archive by date and time
Sources
Quotations are verbatim from the source named. Papers behind the American Meteorological Society's paywall were read from the publisher's PDFs; where only an abstract could be read, the quotation is from the abstract. Figures attributed to "computed here" are described under Methods.
- American Meteorological Society, Glossary of Meteorology, entries tornado, supercell, mesocyclone, wall cloud and landspout.
- National Severe Storms Laboratory, Severe Weather 101: Tornado Basics and its Detection page.
- Storm Prediction Center, The Online Tornado FAQ.
- National Severe Storms Laboratory, NSSL history, entries for 1973 (Union City), 1994 (VORTEX) and 2009 (VORTEX2).
- R. Davies-Jones, A review of supercell and tornado dynamics, Atmospheric Research 158-159, 2015, 274-291.
- R. Davies-Jones, Streamwise vorticity: the origin of updraft rotation in supercell storms, Journal of the Atmospheric Sciences 41, 1984, 2991-3006.
- R. Rotunno and J. B. Klemp, On the rotation and propagation of simulated supercell thunderstorms, Journal of the Atmospheric Sciences 42, 1985, 271-292.
- M. L. Weisman and J. B. Klemp, The dependence of numerically simulated convective storms on vertical wind shear and buoyancy, Monthly Weather Review 110, 1982, 504-520.
- P. M. Markowski, J. M. Straka and E. N. Rasmussen, Direct surface thermodynamic observations within the rear-flank downdrafts of nontornadic and tornadic supercells, Monthly Weather Review 130, 2002, 1692-1721.
- P. M. Markowski and Y. P. Richardson, The influence of environmental low-level shear and cold pools on tornadogenesis: insights from idealized simulations, Journal of the Atmospheric Sciences 71, 2014, 243-275.
- P. M. Markowski and colleagues, The pretornadic phase of the Goshen County, Wyoming, supercell of 5 June 2009 intercepted by VORTEX2. Part I and Part II, Monthly Weather Review 140, 2012, 2887-2938.
- K. Kosiba, J. Wurman, Y. Richardson, P. Markowski, P. Robinson and J. Marquis, Genesis of the Goshen County, Wyoming, tornado on 5 June 2009 during VORTEX2, Monthly Weather Review 141, 2013, 1157-1181.
- L. Orf, R. Wilhelmson, B. Lee, C. Finley and A. Houston, Evolution of a long-track violent tornado within a simulated supercell, Bulletin of the American Meteorological Society 98, 2017, 45-68.
- B. E. Coffer and M. D. Parker, Simulated supercells in nontornadic and tornadic VORTEX2 environments, Monthly Weather Review 145, 2017, 149-180; B. E. Coffer, M. D. Parker, J. L. Dahl, L. J. Wicker and A. J. Clark, Volatility of tornadogenesis: an ensemble of simulated nontornadic and tornadic supercells in VORTEX2 environments, Monthly Weather Review 145, 2017, 4605-4625; B. E. Coffer and M. D. Parker, Is there a "tipping point" between simulated nontornadic and tornadic supercells in VORTEX2 environments?, Monthly Weather Review 146, 2018; B. E. Coffer, M. D. Parker, J. M. Peters and A. R. Wade, Supercell low-level mesocyclones: origins of inflow and vorticity, preprint, 2023.
- J. Fischer and J. M. L. Dahl, Transition of near-ground vorticity dynamics during tornadogenesis, Journal of the Atmospheric Sciences 79, 2022, 467-483.
- E. N. Rasmussen and D. O. Blanchard, A baseline climatology of sounding-derived supercell and tornado forecast parameters, Weather and Forecasting 13, 1998, 1148-1164.
- R. J. Trapp, G. J. Stumpf and K. L. Manross, A reassessment of the percentage of tornadic mesocyclones, Weather and Forecasting 20, 2005, 680-687.
- R. J. Trapp, Observations of nontornadic low-level mesocyclones and attendant tornadogenesis failure during VORTEX, Monthly Weather Review 127, 1999, 1693-1705.
- R. L. Thompson, R. Edwards, J. A. Hart, K. L. Elmore and P. Markowski, Close proximity soundings within supercell environments obtained from the Rapid Update Cycle, Weather and Forecasting 18, 2003, 1243-1261; R. L. Thompson, R. Edwards and C. M. Mead, An update to the supercell composite and significant tornado parameters, 22nd Conference on Severe Local Storms, 2004.
- R. L. Thompson, B. T. Smith, J. S. Grams, A. R. Dean and C. Broyles, Convective modes for significant severe thunderstorms in the contiguous United States. Part II: Supercell and QLCS tornado environments, Weather and Forecasting 27, 2012, 1136-1154. The medians quoted are from Table 3 and the cumulative fractions from Table 5.
- N. B. Ward, The exploration of certain features of tornado dynamics using a laboratory model, Journal of the Atmospheric Sciences 29, 1972, 1194-1204.
- C. R. Church, J. T. Snow, G. L. Baker and E. M. Agee, Characteristics of tornado-like vortices as a function of swirl ratio: a laboratory investigation, Journal of the Atmospheric Sciences 36, 1979, 1755-1776.
- D. C. Lewellen, W. S. Lewellen and J. Xia, The influence of a local swirl ratio on tornado intensification near the surface, Journal of the Atmospheric Sciences 57, 2000, 527-544.
- T. T. Fujita, Tornadoes and downbursts in the context of generalized planetary scales, Journal of the Atmospheric Sciences 38, 1981, 1511-1534.
- J. Wurman, C. Alexander, P. Robinson and Y. Richardson, Low-level winds in tornadoes and potential catastrophic tornado impacts in urban areas, Bulletin of the American Meteorological Society 88, 2007, 31-46.
- J. Wurman, K. Kosiba, P. Robinson and T. Marshall, The role of multiple-vortex tornado structure in causing storm researcher fatalities, Bulletin of the American Meteorological Society 95, 2014, 31-45.
- K. Kosiba and J. Wurman, The three-dimensional structure and evolution of a tornado boundary layer, Weather and Forecasting 28, 2013, 1552-1561.
- J. J. Lee, T. M. Samaras and C. R. Young, Pressure measurements at the ground in an F-4 tornado, 22nd Conference on Severe Local Storms, 2004.
- C. D. Karstens, T. M. Samaras, B. D. Lee, W. A. Gallus and C. A. Finley, Near-ground pressure and wind measurements in tornadoes, Monthly Weather Review 138, 2010, 2570-2588.
- H. E. Brooks, On the relationship of tornado path length and width to intensity, Weather and Forecasting 19, 2004, 310-319.
- R. M. Wakimoto and J. W. Wilson, Non-supercell tornadoes, Monthly Weather Review 117, 1989, 1113-1140.
- R. J. Trapp, S. A. Tessendorf, E. S. Godfrey and H. E. Brooks, Tornadoes from squall lines and bow echoes. Part I: Climatological distribution, Weather and Forecasting 20, 2005, 23-34.
- R. J. Trapp and M. L. Weisman, Low-level mesovortices within squall lines and bow echoes. Part II: Their genesis and implications, Monthly Weather Review 131, 2003, 2804-2823.
- J. H. Golden, The life cycle of Florida Keys' waterspouts. I, Journal of Applied Meteorology 13, 1974, 676-692.
- J. Marquis, Y. Richardson, P. Markowski, D. Dowell and J. Wurman, Tornado maintenance investigated with high-resolution dual-Doppler and EnKF analysis, Monthly Weather Review 140, 2012, 3-27.
- E. J. Adlerman, K. K. Droegemeier and R. Davies-Jones, A numerical simulation of cyclic mesocyclogenesis, Journal of the Atmospheric Sciences 56, 1999, 2045-2069.
- D. C. Dowell and H. B. Bluestein, The 8 June 1995 McLean, Texas, storm. Part II: Cyclic tornado formation, maintenance, and dissipation, Monthly Weather Review 130, 2002, 2649-2670.
- R. A. Brown, L. R. Lemon and D. W. Burgess, Tornado detection by pulsed Doppler radar, Monthly Weather Review 106, 1978, 29-38.
- A. V. Ryzhkov, T. J. Schuur, D. W. Burgess and D. S. Zrnic, Polarimetric tornado detection, Journal of Applied Meteorology 44, 2005, 557-570.
- M. R. Kumjian and A. V. Ryzhkov, Polarimetric signatures in supercell thunderstorms, Journal of Applied Meteorology and Climatology 47, 2008, 1940-1961.
- Storm Prediction Center, United States tornado database, 1950 to 2025, downloaded September 2026; computed here as described under Methods.
- University of Wyoming, Upper air sounding archive: Norman (OUN) 18 UTC May 20, 2013, 18 UTC May 31, 2013, 00 UTC June 1, 2013, 12 UTC May 3, 1999 and 00 UTC May 4, 1999; Topeka (TOP) 18 UTC May 21, 2024; Springfield (SGF) 00 UTC May 22, 2024; Little Rock (LZK) 00 UTC December 11, 2021; Aberdeen (ABR) 00 UTC June 21, 2025; Green Bay (GRB) and Minneapolis (MPX) 12 UTC July 27, 2026; Peoria 00 UTC August 29, 1990; Fort Worth (FWD) 12 UTC May 27 and 00 UTC May 28, 1997. Parameters computed here as described under Methods.
- WeatherOverTime, renders from the NEXRAD Level II archive for KTLX at 20:20 UTC, May 20, 2013, as published on the Moore profile.
- National Weather Service JetStream, Radar beams.
- NOAA Photo Library, National Severe Storms Laboratory collection, via Wikimedia Commons, all public domain as works of the United States government: nssl0073, Alfalfa, Oklahoma, May 22, 1981; nssl0092, wall cloud with lightning, Miami, Texas, June 19, 1980, Brad Smull; nssl0208, occluded mesocyclone tornado, Anadarko, Oklahoma, May 3, 1999; wea02224, Dallas, Texas, April 2, 1957, Robert E. Day; Doppler on Wheels 6, VORTEX2, 2009.
- Storm Prediction Center, Day 1 Convective Outlook archive: May 20, 2013, 1630 UTC; May 31, 2013, 1630 UTC; December 10, 2021, 1630 UTC; May 21, 2024, 1630 UTC; June 20, 2025, 1300 and 1630 UTC; July 27, 2026, 1300 and 1630 UTC. The May 3, 1999 outlooks (0555, 1246, 1615 and 2049 UTC) are from the Iowa Environmental Mesonet's AFOS text archive, product SWODY1.
- National Weather Service Norman, The Tornado Outbreak of May 20, 2013, and this site's Moore profile.
- National Weather Service Norman, The Great Plains Tornado Outbreak of May 3-4, 1999, and this site's Bridge Creek profile.
- National Weather Service Des Moines, May 21, 2024 Iowa tornadoes; Storm Prediction Center, Tornado Watch 277; NOAA Climate.gov, Experimental Warn-on-Forecast system yields 75-minute lead time; and this site's Greenfield profile, which sets out the wind measurements.
- This site's Mayfield profile and the National Weather Service Paducah survey it cites.
- National Weather Service Norman, The May 31, 2013 El Reno tornado, and this site's El Reno profile.
- Storm Prediction Center, Mesoscale Discussion 1386 and Mesoscale Discussion 1390, June 20-21, 2025; Tornado Watch 448.
- National Weather Service Grand Forks, June 20, 2025 severe weather summary and the Public Information Statement of October 6, 2025 on the EF5 rating, via the Iowa Environmental Mesonet text archive; warning times from the same archive, products TORFGF and SVSFGF; and this site's Enderlin profile.
- National Weather Service Green Bay, July 27, 2026 Severe Storms and Tornado Summary, including the 12 UTC sounding analysis and the KGRB four-panel image.
- Storm Prediction Center, Severe Thunderstorm Watch 519 and Mesoscale Discussion 1761, July 27, 2026.
- National Weather Service Green Bay, Tornado Warnings 24 and 25 of 2026, issued 1659 and 1717 UTC July 27, 2026, via the Iowa Environmental Mesonet AFOS text archive, product TORGRB.
- National Weather Service Chicago, The Plainfield tornado of August 28, 1990; T. T. Fujita, "Plainfield tornado of August 28, 1990," in The Tornado: Its Structure, Dynamics, Prediction, and Hazards, Geophysical Monograph 79, 1993, 1-17; warnings from the Iowa Environmental Mesonet archive, product TORCHI; and this site's Plainfield profile.
- A. L. Houston and R. B. Wilhelmson, Observational analysis of the 27 May 1997 central Texas tornadic event. Part I and Part II, Monthly Weather Review 135, 2007; National Weather Service, Service assessment: the central Texas tornadoes of May 27, 1997, 1998; and this site's Jarrell profile.
- National Weather Service, The Science Behind Tornadoes, YouTube.


_2009_VORTEX_2.jpg)
Not read directly, and cited only as characterized by the papers above: Lilly 1982 and Burgess and Lemon 1990 on mesocyclone formation; Klemp and Wilhelmson 1978 and Rotunno and Klemp 1982 on storm splitting; Davies-Jones and Brooks 1993 on vorticity in descending air; Coffer and colleagues 2019 and 2020 on 0 to 500 m helicity; Lewellen and Lewellen 2007 on the corner flow; Alexander and Wurman 2008 on tornado core size; Bluestein 1985 on the term landspout; Burgess 1976 on mesocyclone lead time; Lemon and Doswell 1979 on supercell structure. Corrections: contact@weatherovertime.com.