The El Reno, Oklahoma tornado of May 31, 2013
EF3 Canadian County, Oklahoma · surveyed by NWS Norman · the widest tornado ever recorded
It was 2.6 miles wide, which no tornado on record has matched. Mobile radars operating within a few kilometres of it measured winds among the fastest ever recorded. It killed eight people, all in vehicles, including three researchers who studied tornado safety for a living. The National Weather Service rates it EF3, because it crossed almost nothing that could establish otherwise.
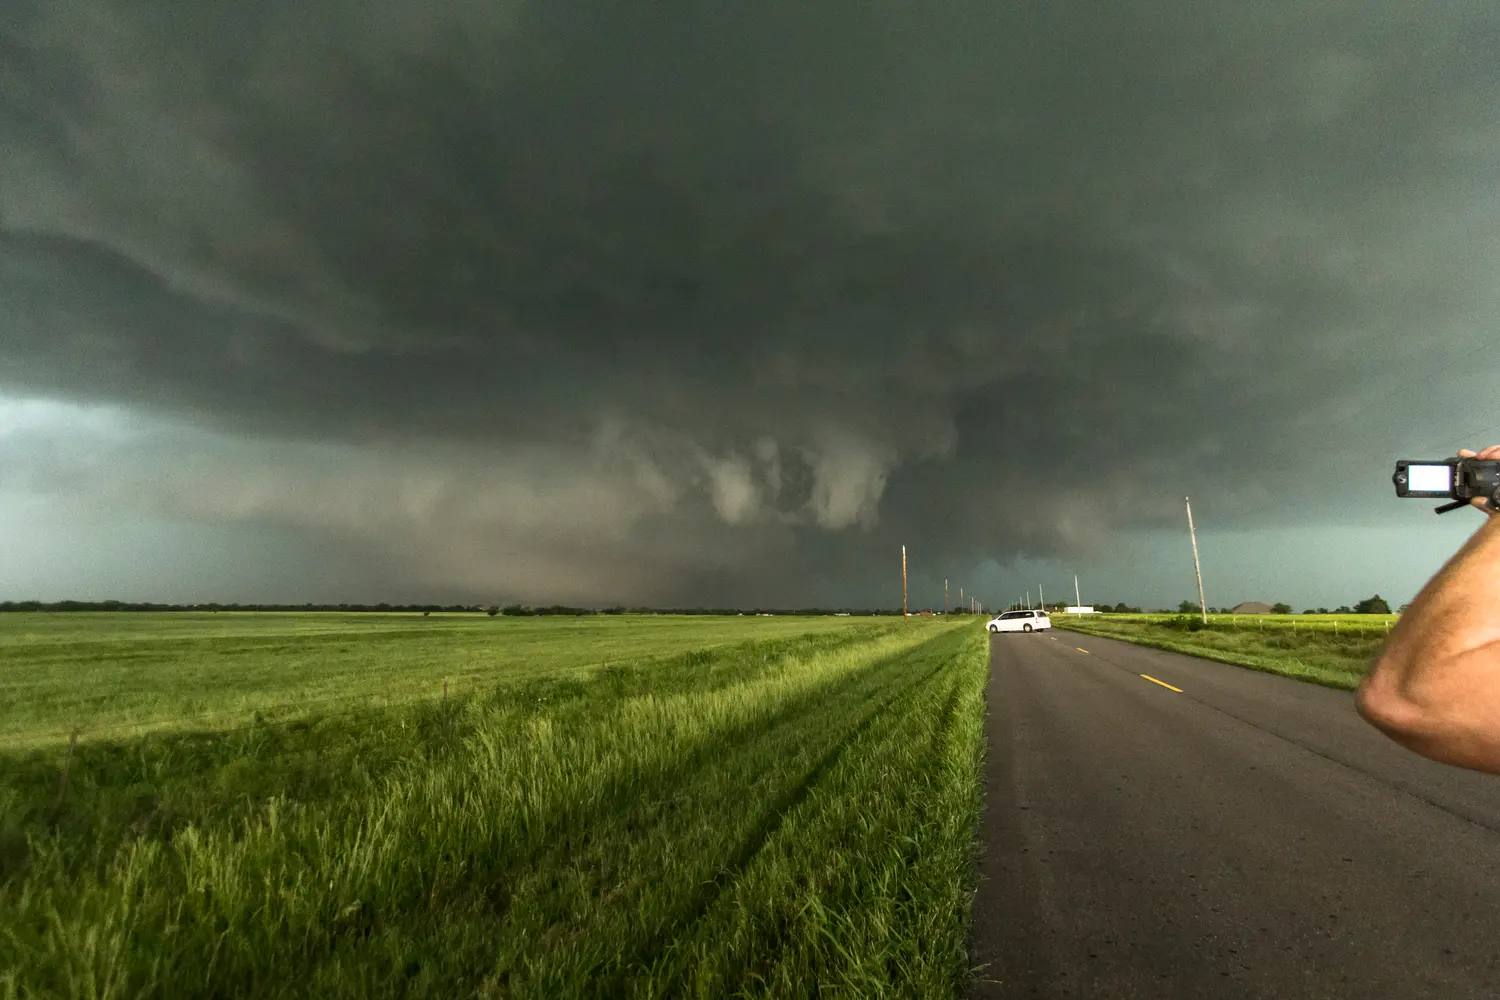
- Rating
- EF3 EF5 for 87 days
- Max width
- 2.6 mi 4,576 yd, a world record
- Radar winds
- ~302 mph 135 m/s, RaXPol, near ground
- Path length
- 16.2 mi
- On the ground
- 40 min 6:03–6:43 pm CDT
- Forward speed
- 0–55 mph it stopped, then ran
- Deaths
- 8 all in vehicles
- Injuries
- 26
- Warning lead
- 27 min warned 5:36 pm CDT
- Radar
- KTLX Twin Lakes WSR-88D
The setup
Eleven days earlier, an EF5 tornado had gone through Moore, Oklahoma and killed 24 people, including seven children in a school. The National Weather Service's own assessment of May 31 identifies that recent memory as a direct cause of how the public behaved, so it belongs in the account of this tornado rather than beside it.
The Storm Prediction Center had a Moderate risk out for central Oklahoma from the morning outlook onward. The 7:45 am outlook was cautious about tornadoes specifically, noting "rather modest low-level flow/shear farther southwest into OK," and carried a 10 percent hatched tornado probability. By 11:56 am the language had escalated to "a regional severe weather outbreak" with "a few strong/violent tornadoes," the tornado probability was raised to 15 percent hatched, and the forecaster wrote that parts of Oklahoma "will be considered for an upgrade to high risk at 20Z."[3][4] The upgrade never came; the 3:02 pm outlook held at Moderate and described a "loaded gun profile" with mixed-layer CAPE over 4,000 J/kg under a pronounced cap.[5]
At 3:30 pm the Storm Prediction Center issued Tornado Watch 262 and flagged it a Particularly Dangerous Situation: a 90 percent chance of two or more tornadoes and a 70 percent chance of at least one rated F2 or greater, across 37 Oklahoma counties including Canadian.[6] The cap broke late in the afternoon. The first supercell went up near 5:00 pm just west of El Reno, and NWS Norman put a tornado warning on Canadian County at 5:36 pm, naming El Reno and warning that "the tornado may be hidden by rain and very difficult to see."[7][8] The tornado touched down 27 minutes later.
Forty minutes
The tornado formed at 6:03 pm near the intersection of Heaston and Reuter roads, southwest of town. For its first quarter hour it tracked southeast then east at 20 to 25 mph across open farmland south of El Reno. After that its behaviour became erratic in both speed and direction.[1]
- damage envelope
- centre of the tornado, minute by minute
- El Reno
-
PDS Tornado Watch 262 issued for 37 Oklahoma counties, valid to midnight.[6]
-
First tornado warning for Canadian County, naming El Reno: "the tornado may be hidden by rain and very difficult to see."[8]
-
Touchdown near Heaston and Reuter roads, about 8 miles west-southwest of El Reno.[1]
-
Turns east, south of Reno Road. Two satellite tornadoes form briefly on its west side as it passes south of the El Reno airport, and it accelerates to 30–40 mph.[1]
-
Crosses US-81 near Reno Road, still expanding, then turns abruptly north and accelerates past 50 mph. Around this time the damage envelope reaches its record width.[1][10]
-
An interior sub-vortex becomes nearly stationary over Reuter Road for about 20 seconds. The TWISTEX team's car is carried roughly 600 m; all three are killed, along with another motorist nearby.[11]
-
Maximum size and intensity near the intersection of Radio and Reuter roads.[1]
-
Tornado emergency declared for Yukon, Bethany, The Village and Wiley Post Airport, with the tornado 6 miles southeast of El Reno moving east at 40 mph.[8]
-
Loops just north of Interstate 40 and decelerates below 10 mph, moving less than 500 m in five minutes.[1][11]
-
Two people are killed in a vehicle stopped along I-40, waiting for the storm to pass.[1]
-
Dissipates near I-40 and Banner Road, 16.2 miles from where it started.[1][10]
The radar record
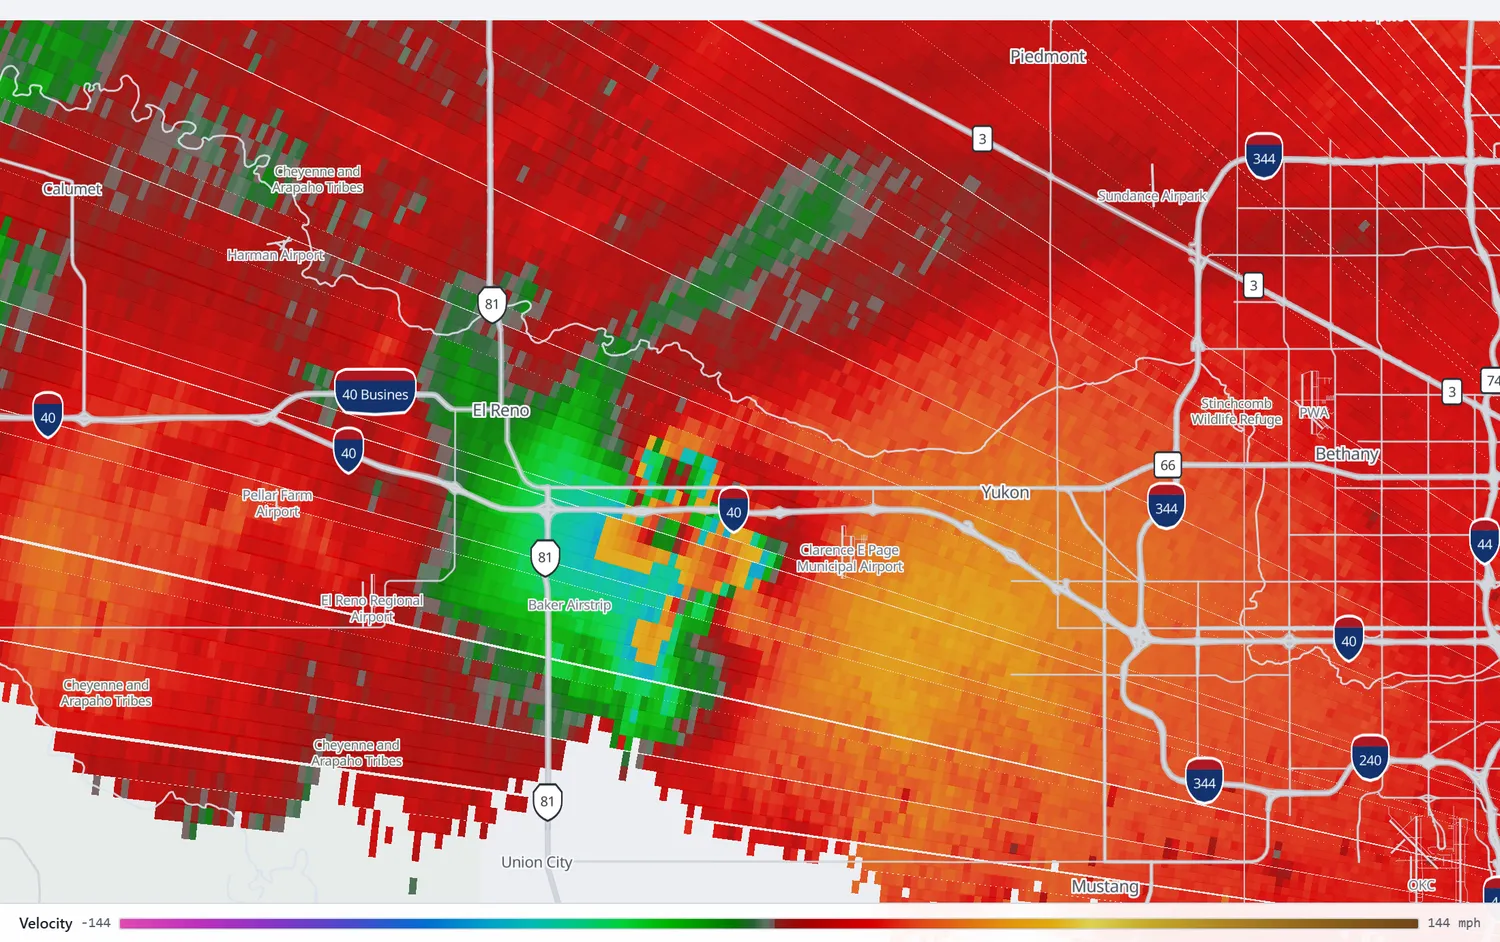
KTLX, the Twin Lakes WSR-88D, sits about 40 miles east-southeast of El Reno and scanned the whole event. The three frames below come from the same volume, 6:23 pm, at the 0.5° tilt. Each product answers a different question about the same moment: where the tornado was, how large it was, and what it had picked up.
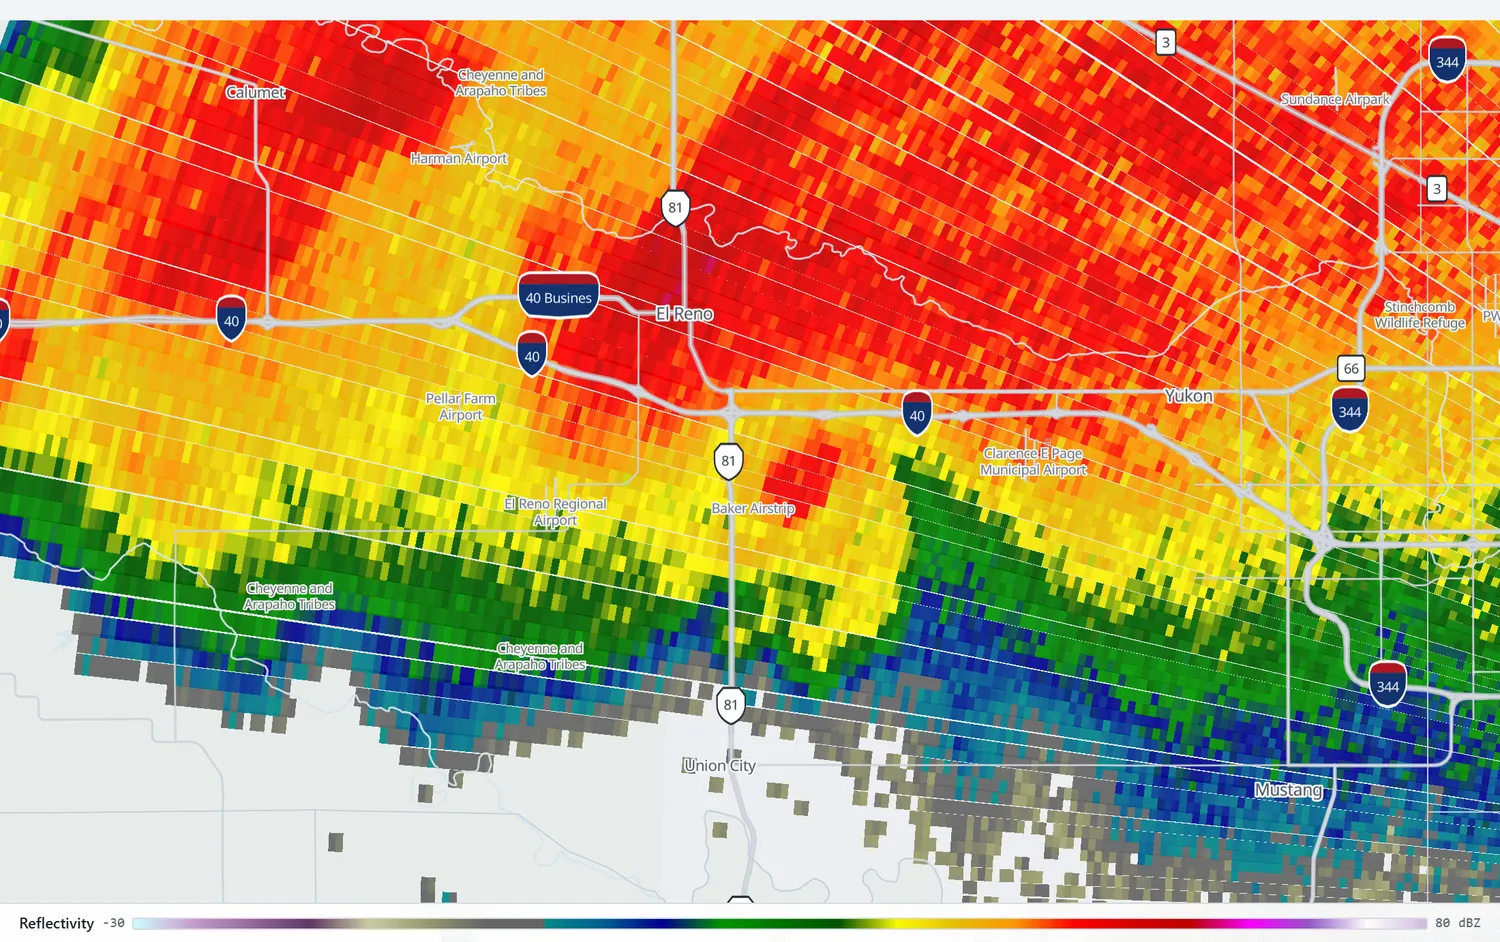
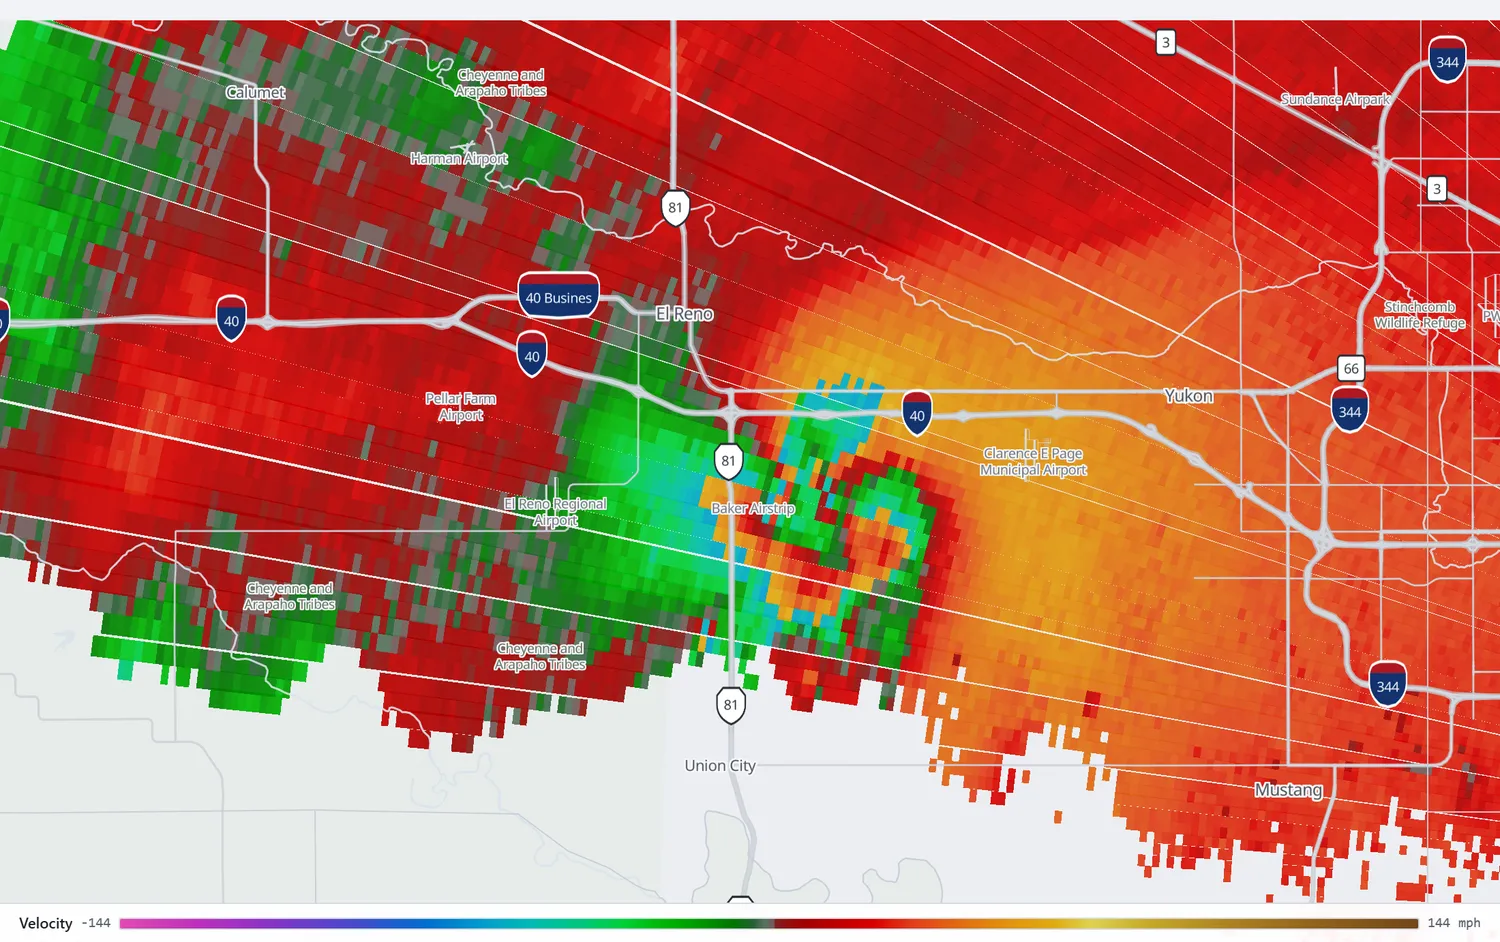
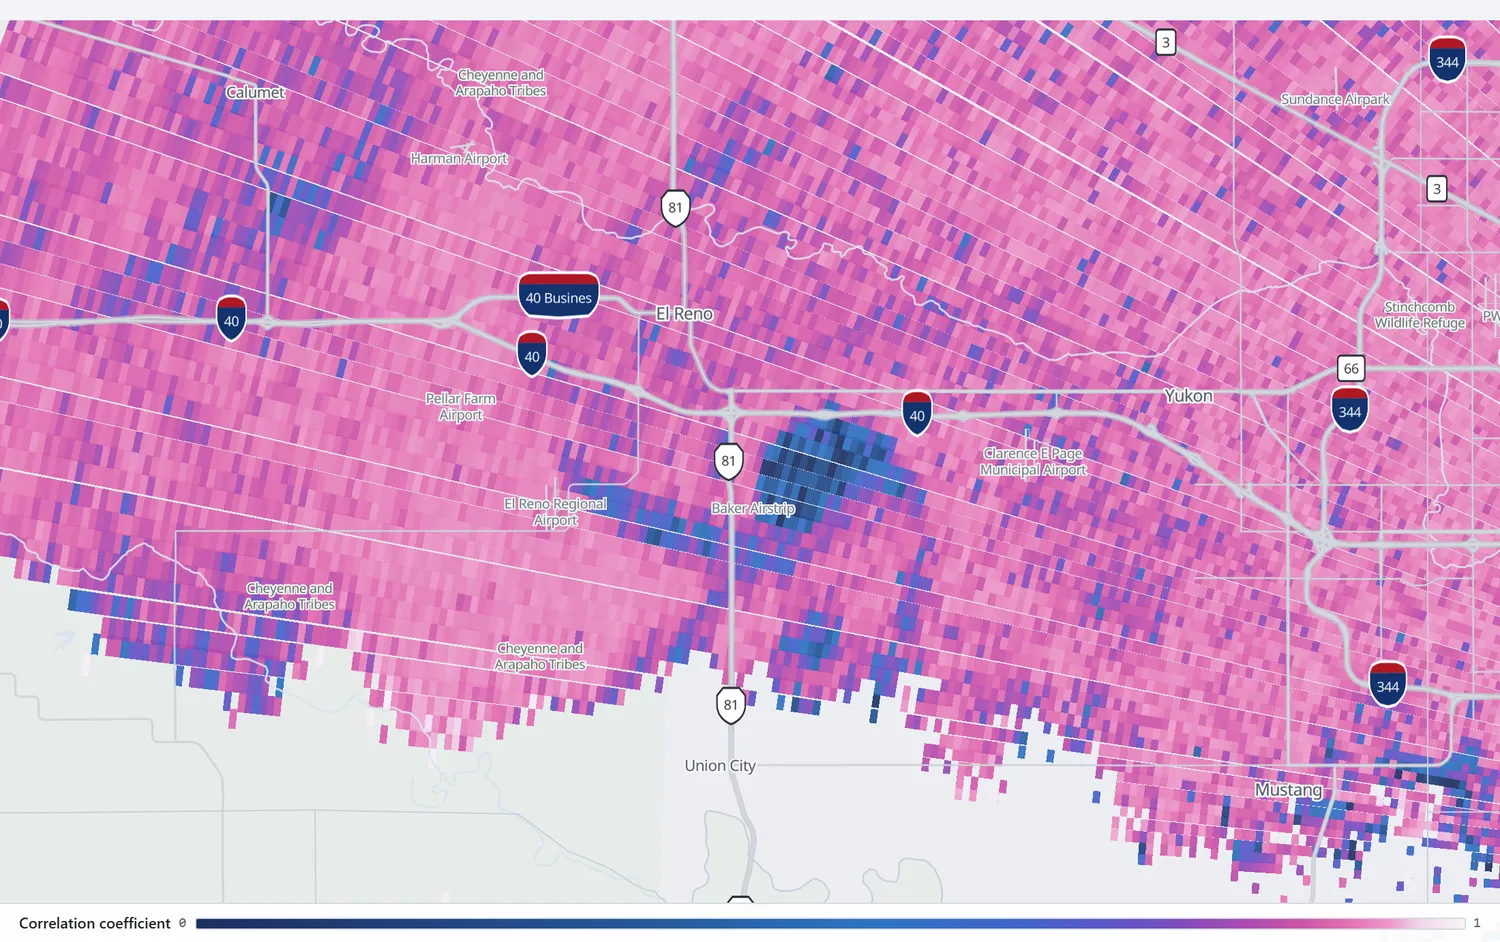
Step through the whole event on KTLX: reflectivity, velocity and correlation coefficient side by side, opening on 6:23 pm over the tornado.
Open in the archive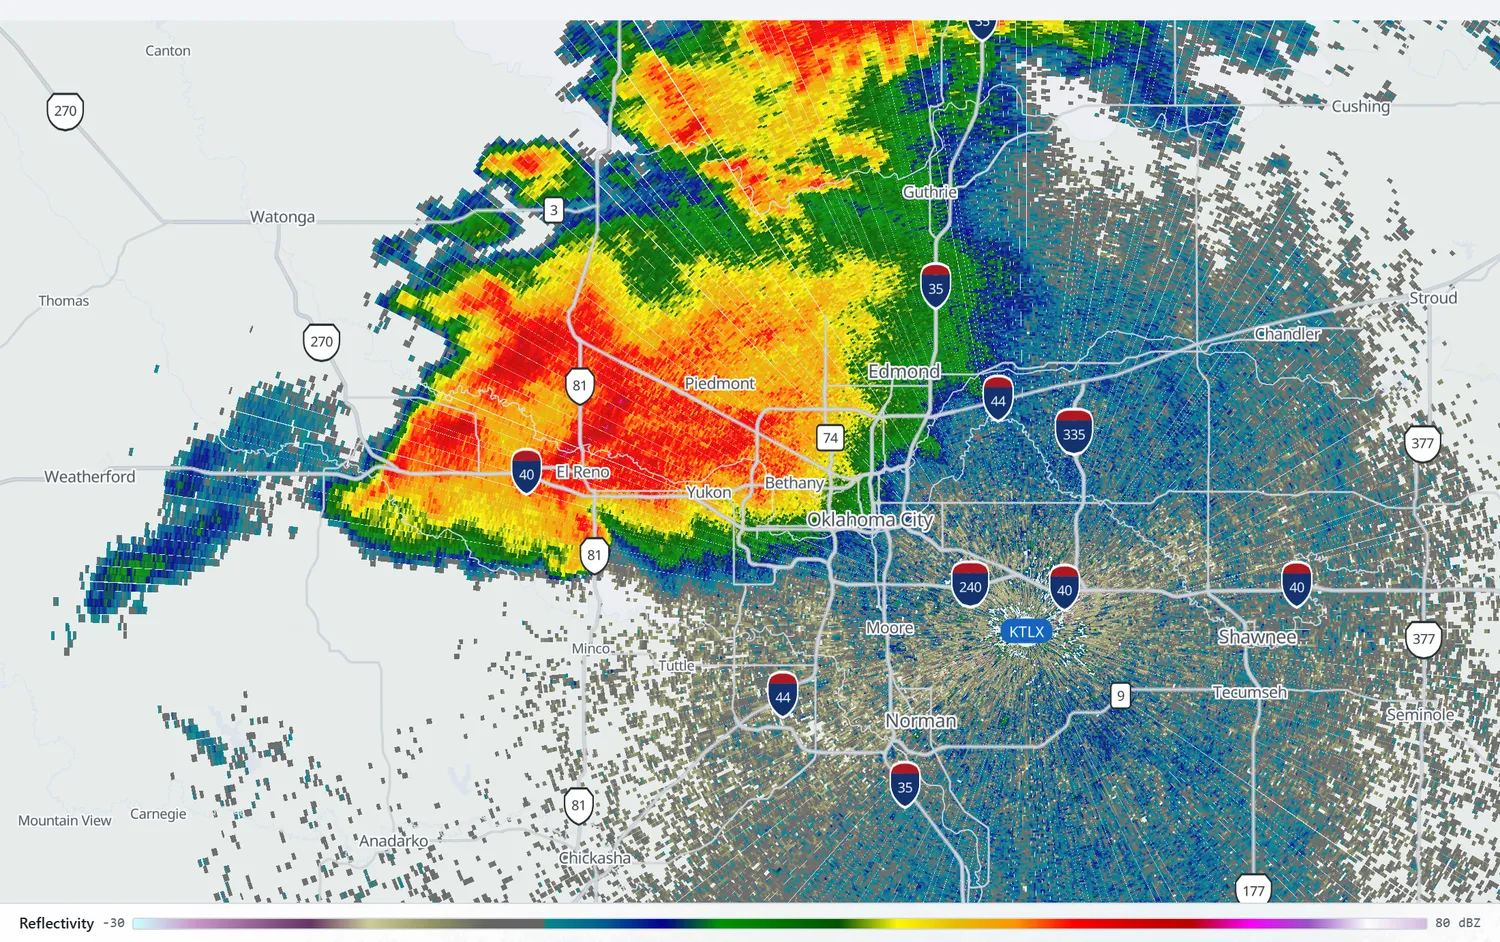
The width
The method matters to the number. The survey team could not find the edge on the ground and recorded three reasons: the tornado kept changing direction so north-south road transects cut it obliquely and overstated the width; the country was too rural to show where damage stopped; and rear-flank downdraft damage was mixed in and could not be separated from the tornado's own.[13] So they went to the radar, found a sharp gradient at the 30 metres-per-second contour, confirmed damage out to that line, and used it. The result was 4.2 km, and the National Weather Service's June 4 statement called it "the widest tornado on record in the United States."[14]
Even that number is contested at the edges, and honestly so. The Doppler on Wheels team, applying the same 30 m/s threshold to their own radar, got 7 km rather than 4.2, and noted in print that "tornado width is poorly and subjectively defined" and that the extreme cross-track damage width "may have been enhanced by damage caused by external vortices."[11] The June 4 statement itself cautioned that 2.6 miles is "the width of the tornado itself and does not include the damaging straight-line winds near the tornado," and NWS Norman still notes that the damaging wind swath was wider still, with non-tornadic downdraft winds reaching at least a mile further south.[1][14]
The winds
Two research radars sampled this tornado at close range: the University of Oklahoma's RaXPol, which completes a 360° sweep every two seconds, and the Center for Severe Weather Research's Doppler on Wheels. Their measurements are among the highest wind speeds ever recorded. They are also frequently quoted without the distinctions their authors drew, so the figures are separated here.
| Figure | What it actually is | Height | Source |
|---|---|---|---|
| ~302 mph | RaXPol ground-relative wind in a sub-vortex, the highest value the authors describe as high-confidence, with only one reasonable dealiasing solution | near surface | Bluestein et al. 2018[15] |
| 305, 313 mph | Two further RaXPol estimates at 6:25 pm, published with the authors' own caveat that "our confidence in these estimates is limited" | not stated | Bluestein et al. 2018[15] |
| >257 mph | The Doppler on Wheels' directly measured Doppler velocity in a sub-vortex | 114 m | Wurman et al. 2014[11] |
| 291–336 mph | Inferred, not measured: the figure above plus an assumed value for the motion the radar could not see | ~100 m | Wurman et al. 2014[11] |
| <224 mph | The same team's estimate of the three-second average that sub-vortex would produce, which is the quantity the damage scale is built on | ~100 m | Wurman et al. 2014[11] |
| ~212 mph | Dual-Doppler wind synthesis, peak grid-point value | 175 m | Wakimoto et al. 2016[16] |
The widely repeated "313 mph" is the top of that second row: 140 metres per second, a number whose own authors wrote that their confidence in it was limited, owing to ambiguity in unfolding velocities that had wrapped past the radar's measuring limit. The equally repeated "296 mph" appears in no National Weather Service statement at all; it came from remarks to reporters on June 4.[15][17] The supportable claim is narrower than the popular one, and still exceptional: winds around 300 mph, close to the ground, inside sub-vortices a few hundred metres wide, lasting well under a second at any fixed point.
The rating that changed twice
On June 1 the National Weather Service rated the tornado EF3. On June 4 it upgraded it to EF5, citing the RaXPol velocity data, and the following day reissued the statement crediting both radar teams while stressing the numbers were "preliminary and not official."[14][18] On June 6, the director of the National Weather Service circulated a policy memo restating that under its own directive, "EF ratings are determined by observed damage rather than measured wind because we have no consistent way to measure wind speed for every tornado that occurs."[2] On August 30, headquarters rejected the Norman office's EF5 report and the rating reverted to EF3. No public statement was issued; the announcement survives as an email from a NOAA public affairs officer.[19]
"Despite the radar-measured wind speeds, the survey team did not find damage that would support a rating higher than EF3. While the wind measurements from the mobile radars are considered reliable, NWS policy for determining EF ratings is based on surveys of ground damage."
Keli Pirtle, NOAA public affairs, August 30, 2013[19]
The rating reflects the method rather than the storm. The Enhanced Fujita scale infers wind speed from damage to structures, and this tornado crossed almost none. The survey rated 257 damage indicators across the whole path and found EF3 at three of them.[13] By comparison the Moore tornado eleven days earlier offered 4,222, sixteen times as many. Twenty-five of the thirty-nine square-mile blocks along the El Reno path had fewer than ten indicators in them.
The survey team's own paper goes further than the rating does. "Even if RaXPol velocities were reduced 25 percent to match EF-scale wind speeds," they wrote, "the maximum radar-derived velocities would be in the EF5 range near Radio and Reuter roads. However, there were no [damage indicators] in the region where RaXPol velocities were maximum."[13] One house was the sole candidate for EF4; it was rated EF3 because the nuts and washers were missing from its foundation anchor bolts. They also recorded a puzzle they could not resolve: there was no ground scouring of wheat fields where the measured winds were fastest, and oil tank batteries there were less damaged than ones further west where the tornado was weaker. The explanation they reach for is residence time: a 300 mph gust lasting half a second may not do what a 200 mph wind lasting three seconds does.
Jeff Snyder and Howard Bluestein proposed a way out that the Weather Service has not adopted: rate the damage as found, and append a plus. They suggested El Reno be recorded as "EF3+", the plus meaning the EF3 is a floor and that credible non-damage measurements show winds well above it.[20] The argument did not end there. A consensus standard on wind speed estimation in tornadoes, developed since 2014 by the American Society of Civil Engineers with the American Meteorological Society, adds a chapter on radar measurements, and uses El Reno as its worked example of the problem: "the peak intensity of tornadoes can be missed if there are no [damage indicators] directly in the path."[21]
The chasers
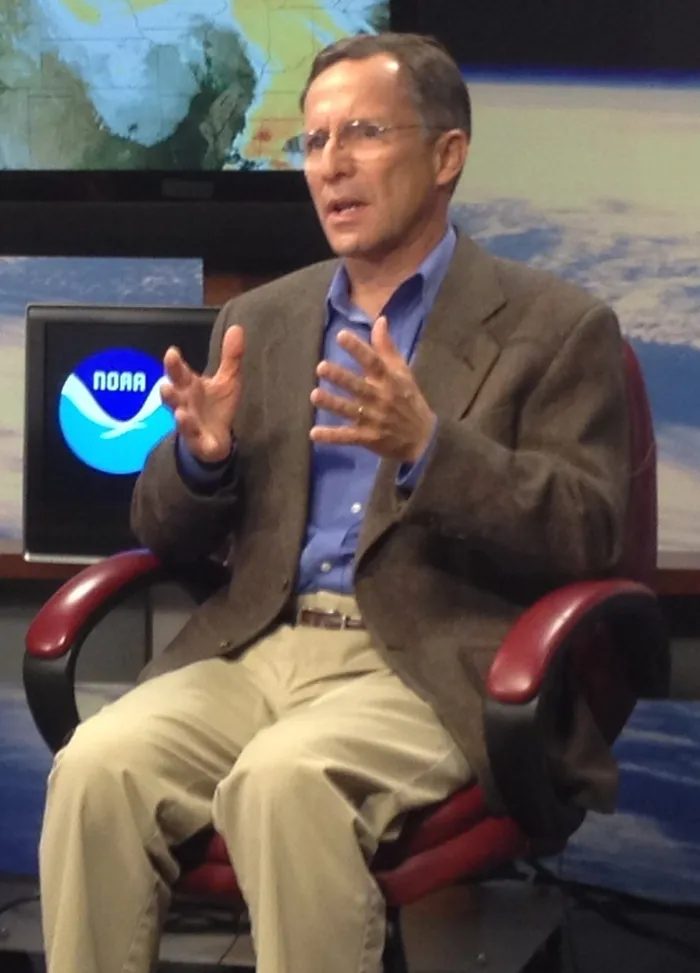
Tim Samaras was 55, a self-taught engineer who had chased more than 125 tornadoes and held 18 National Geographic research grants. In 2003 near Manchester, South Dakota, a probe he designed recorded a 100-millibar pressure drop inside an F4, the largest ever measured inside a tornado.[22] He was widely regarded as one of the most safety-conscious people in the field. His son Paul, 24, was the team's photographer. Carl Young, 45, held a master's in atmospheric science and had chased with Samaras since 2002.
They died together at about 6:23 pm on Reuter Road. The Doppler on Wheels reconstruction, published the following January, sets out what happened to them. A sub-vortex inside the main circulation moved rapidly around its south side, then contracted, reintensified, and became nearly stationary directly over their position for roughly twenty seconds. Their car was carried about 600 metres. The paper's conclusion is that with perhaps 30 seconds of possible warning, likely poor visibility inside the circulation, and a sub-vortex changing direction anomalously, "it is likely that no clear direction to safety was apparent."[11]
The chaser Dan Robinson was on the same road, a few hundred yards ahead, and his dashboard cameras recorded the sub-vortex behind him. His account puts the TWISTEX car immediately behind his own at 6:19:25 pm, and notes that chaser traffic was not a factor where they were. "One moment it was due south of me by at least a mile," he wrote, "the next it was right on me."[23]
A fourth man, Richard Henderson, 35, an amateur chaser from nearby, was killed in the same area. He had photographed the tornado on his phone and sent it to a friend; on the call that followed, the friend heard a loud popping that Henderson identified as debris hitting his pickup, and then the line went dead.[24] A Weather Channel crew led by Mike Bettes was thrown roughly 200 yards in their vehicle; the driver suffered a broken neck, fractured vertebrae and broken ribs. "It was like we were floating," Bettes said afterwards. "We were tumbling."[25] The Doppler on Wheels analysis found both vehicles had entered the circulation through its weaker northern flank, and may not have known they were inside it.[11]
They were the first storm chasers, and the first scientists, ever killed by a tornado they were studying.[22][2]
The roads
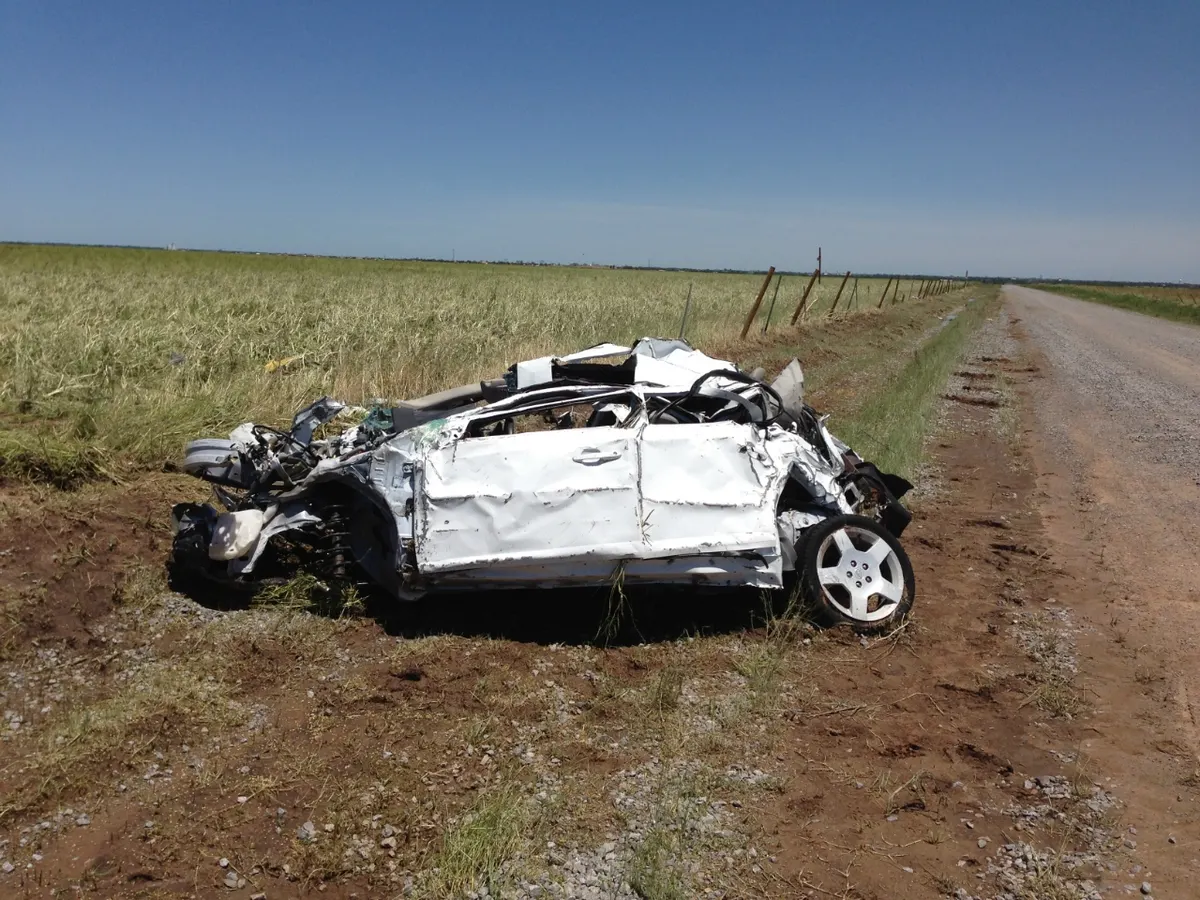
All eight tornado deaths were in vehicles. Four were chasing; four were not.[2] Two of those four were a woman of 26 and an infant seventeen days old, in a car stopped along Interstate 40.[2]
As the storm approached the metro, Interstates 35, 40, 44 and 240 filled with people trying to drive away from it, on top of Friday rush hour. A local television meteorologist had told viewers without underground shelter to get in their cars and go south. The National Weather Service's own service assessment, published the following March, is unusually direct about what happened and why.
"Large numbers of people acted in ways that differed significantly from their typical safety plans due to increased, uncharacteristic fear following the May 20 event. Many people indicated they were actually ashamed of the actions they took, such as evacuating rather than seeking shelter, and said they should have known better."
NWS Service Assessment, March 2014[2]
The assessment quotes a survivor: "People knew not to get in cars; it should have kicked-in when they touched their door handle: No. Shelter in place. But the fear took over. Especially if you had a weatherman you've trusted all your life tell you to get in your car and drive. So many did."[2] Its finding is that the weather enterprise did not present a uniform safety message that day. At 1:00 pm, before any of it, the Norman office had tweeted: "TORNADO SAFETY: If you choose to flee in your car, plan for and anticipate traffic jams and blocked roads, hail, heavy rain and flooding."[2]
The tornado dissipated before it reached the built-up metro. Jeff Masters wrote afterwards that had it tracked directly down one of those car-choked interstates, "the death toll could have easily exceeded 500."[17]
The flood that killed more
The storms kept regenerating along the same west-to-east line into the night and dropped 7 to 12 inches of rain on the Oklahoma City metro. Thirteen people drowned in Oklahoma County that evening and early the next morning, twelve of them in Oklahoma City, and one more died in Okfuskee County. It was the deadliest flooding event in Oklahoma City's history and the deadliest in the state since 1984.[1][2]
Most of them died sheltering from the tornado. The service assessment's fatality appendix lists twelve people who took cover in a drainage ditch and were overwhelmed by floodwater; their ages include a five-month-old, three three-year-olds and two four-year-olds.[2] A flash flood warning had been issued at 7:13 pm. The assessment records that of the members of the public its team interviewed, none were aware of it: "well warned for the tornado, but not for the flash flooding."[2]
What it changed
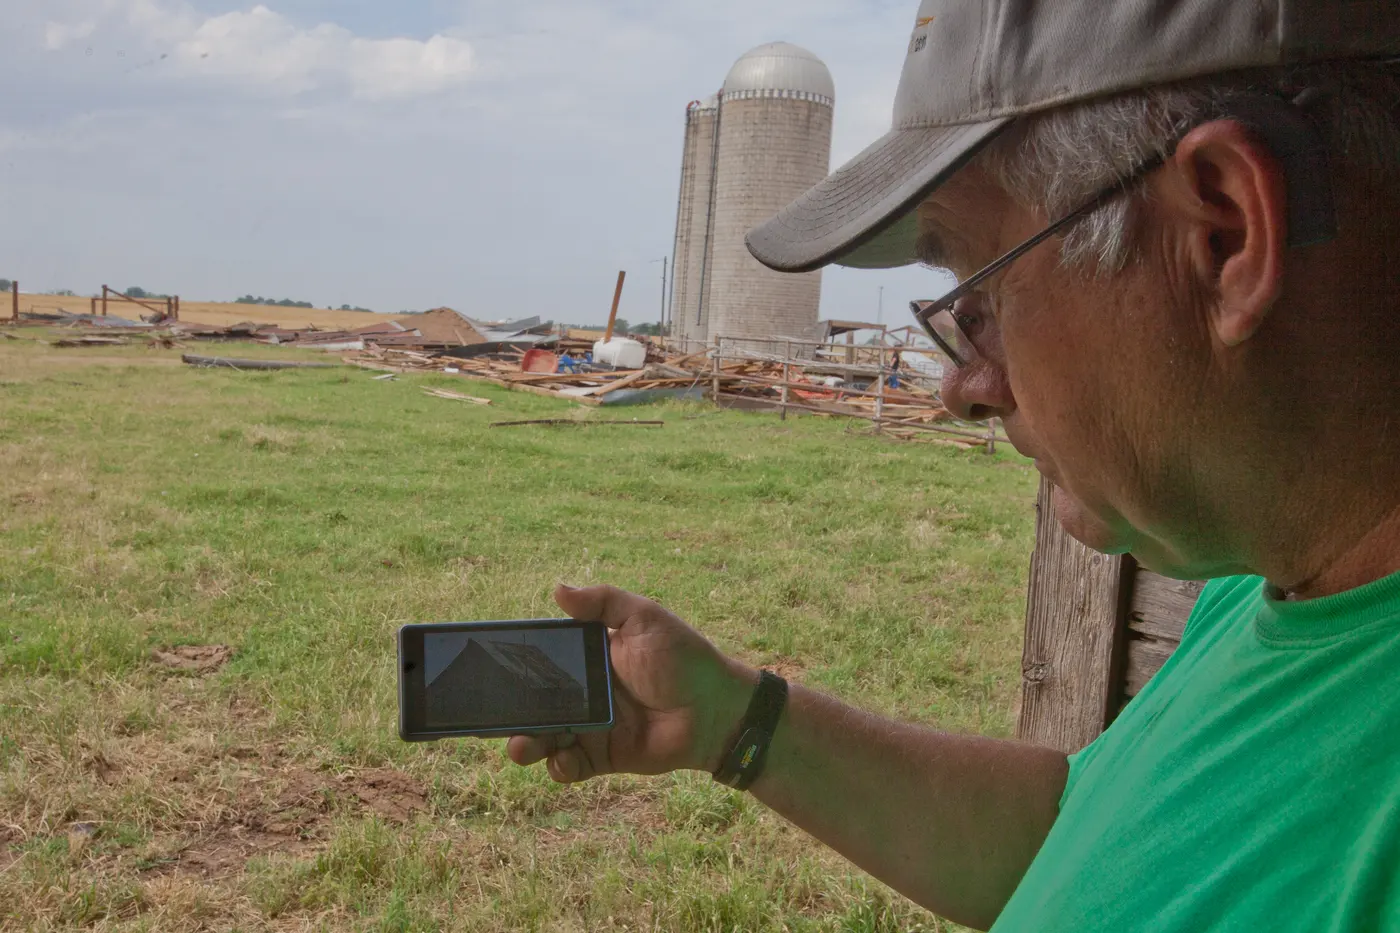
In the field. The Doppler on Wheels team's paper doubles as the discipline's formal safety statement, and it is pointed: their own crew aborted a deployment into this tornado when real-time radar showed a violent, complex circulation with a second, anticyclonic tornado to the south. Their rule is that pod deployment is abandoned the moment real-time radar coverage is lost.[11] NWS Norman now publishes a storm-observer safety video about the event, describing it as the most dangerous tornado in storm observing history.[1] Whether behaviour actually changed is disputed. Five years on, Victor Gensini told the Washington Post: "I still see handfuls of chasers on any given event continue to slice through the 'bear's cage' in search of the most dramatic footage."[26]
In the science. El Reno produced the most detailed observations of sub-vortices ever collected. Bluestein and colleagues tracked 24 of them at two-second cadence and showed where they form, how long they live, and how they move around the parent circulation.[15] Wakimoto's team linked a photographed suction vortex to a radar couplet to an arc of damage on the ground, the first time that chain has been closed end to end.[16] The question the rating raised is still open: how an instantaneous radial velocity a hundred metres up relates to a three-second gust at ten metres. The engineers drafting the new standard say so in as many words: "as of yet, there are no established correction techniques."[21]
"If we want to honor Tim and his teammates, if we want to have the loss mean anything, we have to think seriously about why we need to be in close to large, dangerous tornadoes."
Chuck Doswell, to National Geographic, 2014[27]
Videos
Chosen for what they explain rather than what they show. Footage of the moments in which people died is widely available and is not embedded here.
Related
El Reno was the strongest tornado of an outbreak that produced 134 tornadoes between May 26 and 31, 2013, and one of eleven reported in Oklahoma that day. Those included a rare anticyclonic EF2 southwest of Yukon, spawned by the same storm and rotating the opposite way.[1][28] For a tornado where the damage and the measurements agreed, see the Greenfield, Iowa EF4 of 2024, where a mobile radar again measured winds far above the rating and the rating again stood.
All tornado profiles · Search the radar archive by date and time · How to read reflectivity, velocity and correlation coefficient
Sources
Times are CDT (UTC−5). Where sources disagree, both figures are given in the text. Wind speeds converted from the metres per second the research literature reports.
- NWS Norman, The May 31–June 1, 2013 Tornado and Flash Flooding Event, including the survey narrative and storm-observer safety material.
- NOAA/National Weather Service, Service Assessment: May 2013 Oklahoma Tornadoes and Flash Flooding, March 2014. Source for the fatality appendix, the evacuation findings, the flash flood account and the June 6 policy memo.
- Storm Prediction Center, Day 1 Convective Outlook, 1300 UTC May 31, 2013.
- Storm Prediction Center, Day 1 Convective Outlook, 1630 UTC May 31, 2013.
- Storm Prediction Center, Day 1 Convective Outlook, 2000 UTC May 31, 2013.
- Storm Prediction Center, Tornado Watch 262 (Particularly Dangerous Situation), May 31, 2013.
- Storm Prediction Center, Storm Reports, May 31, 2013.
- Iowa Environmental Mesonet, archived NWS Norman tornado warnings of May 31, 2013: 5:36 pm, 6:08 pm and the 6:28 pm tornado emergency. These are verbatim NWS products; NWS Norman links to these same archives from its own event page.
- NWS Norman, El Reno tornado damage path (KMZ). The diagram on this page is drawn directly from this file's contour, centre path and per-minute positions.
- NCEI Storm Events Database, event 453682 (Canadian County, May 31, 2013), via the NCEI Storm Events bulk detail file for 2013. Source for the official path length, width, times and casualty figures.
- Wurman, J., K. Kosiba, P. Robinson and T. Marshall, 2014: The Role of Multiple-Vortex Tornado Structure in Causing Storm Researcher Fatalities. Bulletin of the American Meteorological Society, 95(1), 31–45. doi:10.1175/BAMS-D-13-00221.1
- Bluestein, H. B., J. C. Snyder and J. B. Houser, 2015: A Multiscale Overview of the El Reno, Oklahoma, Tornadic Supercell of 31 May 2013. Weather and Forecasting, 30(3), 525–552. doi:10.1175/WAF-D-14-00152.1
- Marshall, T. P., D. Burgess, G. Garfield, R. Smith, D. Speheger, J. Snyder and H. Bluestein, 2014: Ground-based damage survey and radar analysis of the El Reno, Oklahoma tornado. 27th Conference on Severe Local Storms, American Meteorological Society, paper 13.1.
- NWS Norman, Public Information Statement, June 4, 2013, announcing the EF5 upgrade and the 2.6-mile width. Archived copy of the product text.
- Bluestein, H. B., K. J. Thiem, J. C. Snyder and J. B. Houser, 2018: The Multiple-Vortex Structure of the El Reno, Oklahoma, Tornado on 31 May 2013. Monthly Weather Review, 146(8), 2483–2502. doi:10.1175/MWR-D-18-0073.1
- Wakimoto, R. M., and others, 2016: Aerial Damage Survey of the 2013 El Reno Tornado Combined with Mobile Radar Data. Monthly Weather Review, 144(5), 1749–1776. doi:10.1175/MWR-D-15-0367.1
- J. Samenow, Deadly El Reno, Okla. tornado was widest ever measured on Earth, Washington Post Capital Weather Gang, June 4, 2013; and J. Masters, "A Night of Tornado Chaos in Oklahoma City," Weather Underground, June 1, 2013.
- NWS Norman, Public Information Statement, June 5, 2013, reissuing the EF5 statement with both radar teams credited and the data marked preliminary. Text at Wikisource.
- Keli Pirtle, NOAA public affairs, statement of August 30, 2013, reproduced by N. Johnson, "El Reno tornado officially rated EF3".
- Snyder, J. C., and H. B. Bluestein, 2014: Some Considerations for the Use of High-Resolution Mobile Radar Data in Tornado Intensity Determination. Weather and Forecasting, 29(4), 799–827. doi:10.1175/WAF-D-14-00026.1
- Marshall, T. P., T. Brown-Giammanco, S. N. Krautwurst and N. L. de Toledo: On the Current Revision of the Enhanced Fujita (EF) Scale. 30th Conference on Severe Local Storms, American Meteorological Society, paper 11.1A.
- M. Wei-Haas, How a Storm Chaser Changed the Face of Tornado Science, Smithsonian, April 4, 2018.
- D. Robinson, El Reno, Oklahoma tornado of May 31, 2013, StormHighway. His timestamped account is also quoted in the NWS service assessment.
- J. Masters, Amateur storm chaser killed in the May 31 El Reno tornado, Weather Underground, reporting The Oklahoman's account.
- The Weather Channel, Tornado Hunt team takes a direct hit, May 31, 2013.
- Washington Post Capital Weather Gang, "Five years ago, four of their own died in the monster El Reno tornado. But storm chasers have declined to back away," May 31, 2018.
- R. Draper, One year after the storm chasers' deaths, National Geographic, May 27, 2014; and "The Last Chase," National Geographic magazine, November 2013.
- Wikipedia, 2013 El Reno tornado and Tornado outbreak of May 26–31, 2013, consulted August 2026.
Radar imagery on this page was rendered by WeatherOverTime from NOAA Level II data recorded by KTLX, and the track diagram from NWS Norman's own survey geometry. Corrections: contact@weatherovertime.com.