M4.3 earthquake 23 km SW of Snyder, Texas
A magnitude 4.3 earthquake struck 23 km SW of Snyder, Texas on Mon, Jan 26, 2026, 4:22 AM CST (10:22 UTC), 7 km (4 mi) below the surface.
Map
Where this earthquake was located, with the others nearby. Select one for its page.
The earthquake
- Magnitude
- 4.3 (ML, local (Richter)), light
- Magnitude from
- TX
- Local time
- UTC
- 2026-01-26 10:22:37 UTC
- Depth
- 6.5 km (4.1 mi), shallow
- Epicenter
- 32.563° N, 101.092° W
- Region
- Texas
- Felt reports
- 45
- Strongest shaking
- V, moderate shaking
- PAGER alert
- Green
- Tsunami flag
- No
- Status
- Reviewed by a seismologist
Magnitude estimates
Different scales measure different things and differ by a few tenths. The USGS marks one as preferred, and it is the one this page uses.
| Mag. | Scale | Computed by | Notes |
|---|---|---|---|
| 4.3 | ML, local (Richter) | TX | Preferred · Final · ±0.1 · 21 stations |
| 4.0 | Mwr, regional moment | USGS National Earthquake Information Center | Reviewed · ±0.049 · 40 stations |
| 3.8 | Mwr, regional moment | TX | Moment tensor · Confirmed |
Shaking
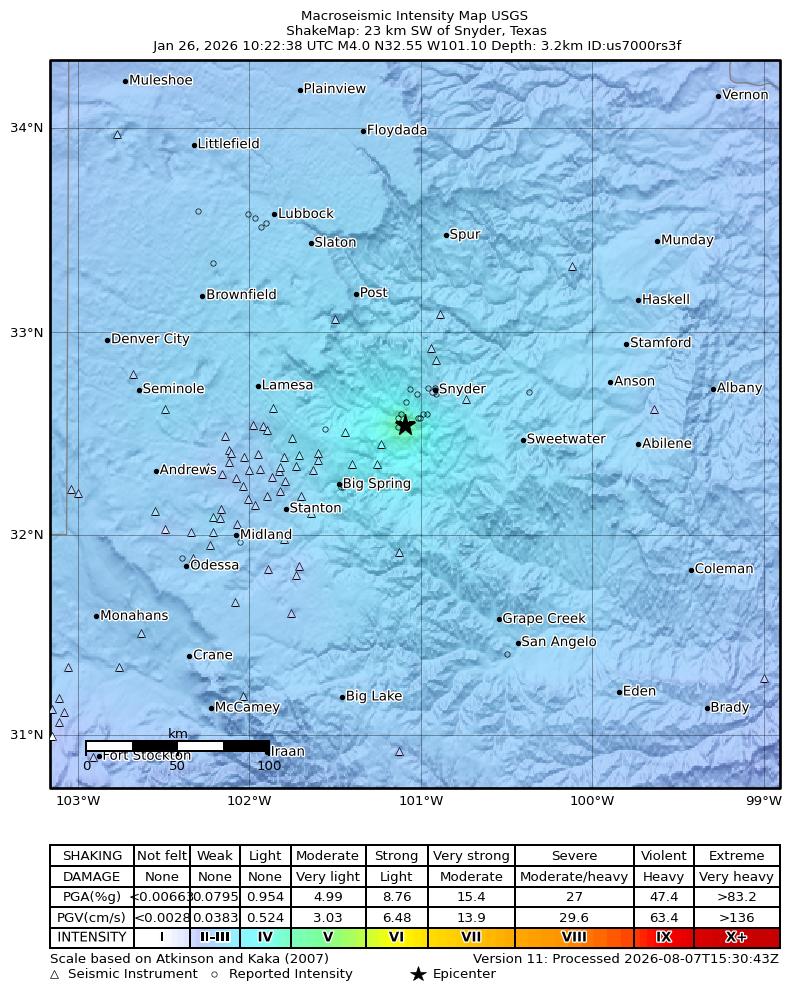
The USGS ShakeMap: shaking estimated from seismic stations and the quake’s size, on the Modified Mercalli intensity scale.
- Strongest estimated
- V, moderate shaking
- Peak ground acceleration
- 6.4% of gravity
- Peak ground velocity
- 2.8 cm/s
- Map
- Automatic
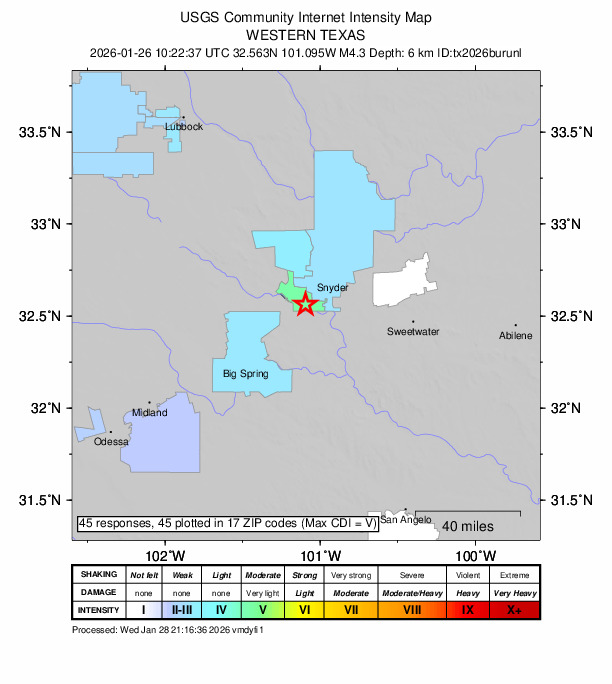
Did you feel it?
45 people reported to the USGS what they felt; the strongest reported shaking was V, moderate shaking.
Estimated impact
The USGS PAGER system estimates deaths and economic losses from the shaking and the population and buildings exposed to it.
- Alert level
- Green: little or no damage or loss of life expected
| Range | Chance |
|---|---|
| Under 1 | 65% |
| 1 to 10 | 30% |
| 10 to 100 | 4% |
| 100 to 1,000 | Under 1% |
| 1,000 to 10,000 | Under 1% |
| 10,000 to 100,000 | Under 1% |
| 100,000 to 10,000,000 | Under 1% |
| Range, million USD | Chance |
|---|---|
| Under 1 | 65% |
| 1 to 10 | 30% |
| 10 to 100 | 4% |
| 100 to 1,000 | Under 1% |
| 1,000 to 10,000 | Under 1% |
| 10,000 to 100,000 | Under 1% |
| 100,000 to 10,000,000 | Under 1% |
Aftershock forecast
The chance of at least one aftershock this large or larger, from the USGS operational aftershock forecast, issued Mon, Sep 28, 2026, 10:22 AM UTC. The USGS updates it as the sequence unfolds.
| Within | M3+ | M4+ | M5+ | M6+ | M7+ |
|---|---|---|---|---|---|
| 1 day | Under 1% | Under 1% | Under 1% | Under 1% | Under 1% |
| 1 week | Under 1% | Under 1% | Under 1% | Under 1% | Under 1% |
| 1 month | 2% | Under 1% | Under 1% | Under 1% | Under 1% |
| 1 year | 14% | 2% | Under 1% | Under 1% | Under 1% |
In the coming week the USGS expects about 0 aftershocks of magnitude 3 or more, and most likely between 0 and 0.
Fault motion and ground failure
How the rock slipped, from the moment tensor, and the USGS estimate of landslides and liquefaction.
- Faulting
- Normal
- Moment magnitude
- 4.0 Mwr
- Nodal plane 1
- Strike 51°, dip 31°, rake -95°
- Nodal plane 2
- Strike 236°, dip 59°, rake -87°
How well it is located
Reviewed by a seismologist.
- Location uncertainty
- About 0.8 km horizontally, 1.6 km in depth
- Magnitude uncertainty
- ±0.10
- Station coverage gap
- 55°
- Stations used
- 40
Nearest places
Distance and direction from each place to the epicenter, with its forecast.
Nearby
Within 100 km, magnitude 1.5 and up: 154 in the 60 days after this one and 81 in the 30 days before it.
After
- 1.523 km SW of Snyder, Texas · 248 days ago · 6 km deep · 0 km away
- 1.624 km NNW of Westbrook, Texas · 248 days ago · 8 km deep · 2 km away · felt by 3
- 1.922 km SW of Snyder, Texas · 248 days ago · 6 km deep · 1 km away · felt by 2
- 1.524 km NNW of Westbrook, Texas · 248 days ago · 8 km deep · 2 km away · felt by 1
- 1.622 km SW of Snyder, Texas · 248 days ago · 5 km deep · 1 km away · felt by 1
- 1.725 km S of Westbrook, Texas · 248 days ago · 8 km deep · 49 km away
- 1.726 km S of Westbrook, Texas · 247 days ago · 9 km deep · 50 km away
- 1.621 km WNW of Stanton, Texas · 247 days ago · 8 km deep · 92 km away
- 1.827 km N of Snyder, Texas · 247 days ago · 7 km deep · 49 km away
- 1.524 km NNW of Westbrook, Texas · 247 days ago · 5 km deep · 2 km away
- 2.911 km S of Forsan, Texas · 247 days ago · 10 km deep · 67 km away
- 1.723 km SW of Snyder, Texas · 246 days ago · 6 km deep · 0 km away
- 1.612 km WSW of Stanton, Texas · 246 days ago · 9 km deep · 93 km away
- 1.713 km W of Stanton, Texas · 246 days ago · 10 km deep · 93 km away
- 1.612 km W of Stanton, Texas · 246 days ago · 9 km deep · 92 km away
- 1.71 km NW of Garden City, Texas · 246 days ago · 7 km deep · 86 km away
- 1.52 km WNW of Garden City, Texas · 246 days ago · 9 km deep · 86 km away
- 2.311 km S of Forsan, Texas · 246 days ago · 10 km deep · 66 km away
- 2.513 km N of Stanton, Texas · 245 days ago · 8 km deep · 73 km away
- 1.612 km WSW of Stanton, Texas · 244 days ago · 9 km deep · 93 km away · felt by 1
- 2.612 km WSW of Stanton, Texas · 244 days ago · 9 km deep · 93 km away · felt by 1
- 1.81 km NNE of Garden City, Texas · 244 days ago · 6 km deep · 85 km away
- 1.513 km W of Forsan, Texas · 244 days ago · 7 km deep · 64 km away
- 1.52 km WNW of Garden City, Texas · 244 days ago · 8 km deep · 86 km away
- 2.610 km WSW of Stanton, Texas · 243 days ago · 9 km deep · 91 km away
- 1.620 km W of Garden City, Texas · 243 days ago · 9 km deep · 95 km away
- 1.910 km WSW of Stanton, Texas · 243 days ago · 9 km deep · 91 km away
- 1.628 km S of Westbrook, Texas · 243 days ago · 3 km deep · 53 km away
- 1.620 km NNW of Stanton, Texas · 242 days ago · 8 km deep · 76 km away
- 1.919 km N of Stanton, Texas · 242 days ago · 7 km deep · 71 km away
- 2.525 km W of Garden City, Texas · 241 days ago · 8 km deep · 96 km away
- 1.725 km W of Garden City, Texas · 241 days ago · 8 km deep · 97 km away
- 1.67 km SE of Big Spring, Texas · 239 days ago · 7 km deep · 51 km away
- 1.825 km W of Garden City, Texas · 239 days ago · 8 km deep · 96 km away
- 1.617 km W of Stanton, Texas · 239 days ago · 9 km deep · 95 km away
- 1.76 km ESE of Big Spring, Texas · 239 days ago · 9 km deep · 48 km away
- 2.54 km NW of Westbrook, Texas · 238 days ago · 6 km deep · 20 km away
- 1.722 km S of Westbrook, Texas · 237 days ago · 4 km deep · 46 km away
- 1.64 km NW of Westbrook, Texas · 237 days ago · 6 km deep · 20 km away
- 1.65 km NW of Westbrook, Texas · 237 days ago · 7 km deep · 20 km away
- 2.020 km W of Garden City, Texas · 236 days ago · 6 km deep · 95 km away
- 1.523 km SW of Snyder, Texas · 236 days ago · 8 km deep · 1 km away
- 2.019 km SW of Ackerly, Texas · 236 days ago · 10 km deep · 76 km away
- 2.06 km ESE of Big Spring, Texas · 235 days ago · 8 km deep · 48 km away
- 1.711 km W of Forsan, Texas · 235 days ago · 9 km deep · 63 km away
- 1.931 km WSW of Ackerly, Texas · 235 days ago · 8 km deep · 89 km away
- 2.311 km W of Forsan, Texas · 235 days ago · 9 km deep · 63 km away
- 1.824 km NNW of Westbrook, Texas · 235 days ago · 3 km deep · 2 km away
- 2.324 km NNW of Westbrook, Texas · 235 days ago · 7 km deep · 2 km away
- 2.314 km E of Stanton, Texas · 235 days ago · 8 km deep · 70 km away
- 1.523 km SW of Snyder, Texas · 234 days ago · 9 km deep · 1 km away
- 2.812 km WSW of Stanton, Texas · 234 days ago · 7 km deep · 92 km away · felt by 3
- 1.511 km WSW of Stanton, Texas · 234 days ago · 9 km deep · 92 km away
- 1.617 km WSW of Rotan, Texas · 234 days ago · 6 km deep · 50 km away
- 1.912 km W of Stanton, Texas · 234 days ago · 9 km deep · 93 km away
- 1.615 km E of Stanton, Texas · 233 days ago · 8 km deep · 69 km away
- 2.213 km W of Stanton, Texas · 233 days ago · 8 km deep · 93 km away
- 1.913 km W of Stanton, Texas · 233 days ago · 9 km deep · 94 km away
- 2.813 km W of Stanton, Texas · 232 days ago · 9 km deep · 93 km away · felt by 3
- 2.213 km W of Stanton, Texas · 232 days ago · 9 km deep · 93 km away
The first 60 of 154.
Before
- 1.513 km WSW of Stanton, Texas · 248 days ago · 9 km deep · 93 km away
- 2.221 km S of Ackerly, Texas · 249 days ago · 8 km deep · 63 km away
- 1.811 km WSW of Stanton, Texas · 250 days ago · 9 km deep · 92 km away
- 1.99 km NNE of Garden City, Texas · 250 days ago · 11 km deep · 77 km away
- 2.122 km W of Garden City, Texas · 250 days ago · 7 km deep · 96 km away
- 1.810 km S of Forsan, Texas · 251 days ago · 3 km deep · 65 km away
- 1.526 km S of Westbrook, Texas · 252 days ago · 6 km deep · 50 km away
- 1.613 km S of Forsan, Texas · 252 days ago · 9 km deep · 68 km away
- 1.524 km SSW of Westbrook, Texas · 252 days ago · 4 km deep · 47 km away
- 1.511 km W of Forsan, Texas · 252 days ago · 9 km deep · 64 km away
- 1.712 km SW of Westbrook, Texas · 255 days ago · 9 km deep · 32 km away
- 1.510 km S of Forsan, Texas · 256 days ago · 11 km deep · 66 km away
- 1.738 km SSW of Los Ybanez, Texas · 256 days ago · 8 km deep · 98 km away
- 2.411 km S of Forsan, Texas · 256 days ago · 9 km deep · 67 km away
- 1.535 km WSW of Ackerly, Texas · 257 days ago · 9 km deep · 93 km away
- 1.814 km W of Stanton, Texas · 258 days ago · 7 km deep · 94 km away
- 2.511 km WSW of Stanton, Texas · 258 days ago · 9 km deep · 92 km away · felt by 1
- 1.513 km W of Stanton, Texas · 261 days ago · 9 km deep · 93 km away
- 1.711 km WSW of Stanton, Texas · 263 days ago · 8 km deep · 92 km away
- 1.615 km NE of Hermleigh, Texas · 263 days ago · 8 km deep · 46 km away
Earthquakes todayTexas earthquakesLive radar here
Sources
From the USGS Earthquake Hazards Program and its partner networks, event tx2026burunl (also filed as us7000rs3f). Read Thu, Oct 1, 2026, 8:57 AM UTC.