M4.9 earthquake 5 km SSW of Gilroy, California
A magnitude 4.9 earthquake struck 5 km SSW of Gilroy, California on Mon, May 13, 2002, 10:00 PM PDT (05:00 UTC), 7 km (4 mi) below the surface.
Map
Where this earthquake was located, with the others nearby. Select one for its page.
The earthquake
- Magnitude
- 4.9 (Mw, moment), light
- Magnitude from
- Northern California Seismic System
- Local time
- UTC
- 2002-05-14 05:00:29 UTC
- Depth
- 6.8 km (4.2 mi), shallow
- Epicenter
- 36.967° N, 121.598° W
- Region
- California
- Felt reports
- 15,660
- Strongest shaking
- VI, strong shaking
- Tsunami flag
- No
- Status
- Reviewed by a seismologist
Magnitude estimates
Different scales measure different things and differ by a few tenths. The USGS marks one as preferred, and it is the one this page uses.
| Mag. | Scale | Computed by | Notes |
|---|---|---|---|
| 4.9 | Mw, moment | Northern California Seismic System | Preferred · Final · 4 stations |
| 4.9 | Mwr, regional moment | USGS National Earthquake Information Center | Reviewed |
| 5.0 | Mw, moment | Southern California Seismic Network | Preliminary · 6 stations |
What happened
The USGS’s account of the effects of this earthquake.
Slight damage (VI) at Aromas and Gilroy. Felt (V) at Aptos, Castroville, Freedom, Moss Landing, Salinas, San Juan Bautista, San Martin and Watsonville; (IV) at Atherton, Ben Lomond, Boulder Creek, Campbell, Capitola, Carmel, Daly City, Felton, Hollister, La Honda, Los Gatos, Marina, Monterey, Morgan Hill, San Francisco, San Jose, San Lorenzo, Santa Clara, Santa Cruz, Seaside, Scotts Valley, Soquel and Sunnyvale. Felt throughout the San Francisco Bay area and as far north as Guerneville, east to Fresno and south to San Luis Obispo.
From the USGS event page for nc21254601. U.S. Geological Survey text and figures are in the public domain.
Shaking
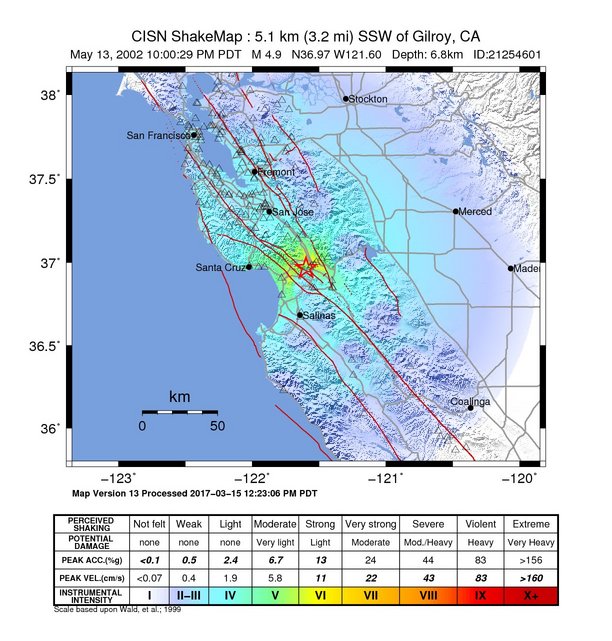
The USGS ShakeMap: shaking estimated from seismic stations and the quake’s size, on the Modified Mercalli intensity scale.
- Strongest estimated
- VI, strong shaking
- Map
- Automatic
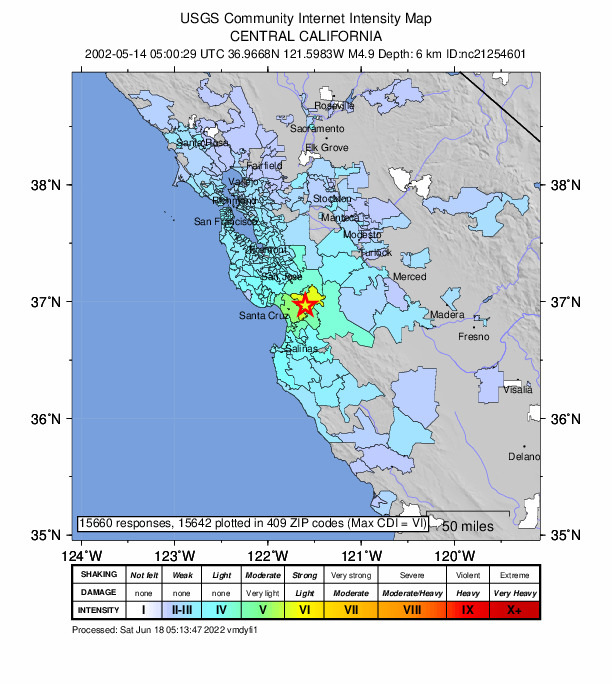
Did you feel it?
15,660 people reported to the USGS what they felt; the strongest reported shaking was VI, strong shaking.
Fault motion and ground failure
How the rock slipped, from the moment tensor, and the USGS estimate of landslides and liquefaction.
- Moment magnitude
- 4.9 Mw
Tectonic setting
Why earthquakes happen here, from the USGS tectonic summary.
The May 13, 2002 Gilroy earthquake occurred near the south end of the Sargent fault and was followed by several small aftershocks located nearby. This moment magnitude M 4.9 earthquake was not unusual, but it ended a post-1989 Loma Prieta earthquake period of relative seismic quiescence in the south San Francisco Bay region. The energy released in an M4.9 event is about 1/1000 that of the M6.9 Loma Prieta event. The M 5.3 Pacheco Pass earthquake near San Juan Bautista in 1998 was the only nearby M> 5.0 shock since 1990. The Gilroy earthquake occurred at normal mid-crustal depth and had a typical strike-slip faulting mechanism. The region where the earthquake occurred has been seismically active at the magnitude 5 level at least since detailed recording began about 50 years ago.
The epicenters of the earthquake and its aftershocks are located near the Castro fault, a minor mapped fault which parallels the Sargent fault. The mapped length of the Castro fault is about 15 km and the maximum magnitude earthquake on a fault of that length is about 6.2. The largest known event that might have occurred on the Castro fault is the magnitude 5.3 earthquake that occurred on March 2, 1959.
The Gilroy earthquake was reported as felt from near San Miguel on the south to Santa Rosa on the north but did little damage. Magnitude 5 earthquakes in the San Francisco Bay region are typically felt throughout the region by people in tall buildings and at sites susceptible to ground amplification. In comparison, ground motion recordings in the epicentral region by newly-installed instruments in the ANSS network are about 20% as strong as those recorded in the epicentral region of the 2000 magnitude 5.2 Yountville earthquake.
The strong-motion coverage of the Gilroy earthquake was doubled by the records from ANSS instruments installed during the past three years. This coverage was especially improved in the Silicon Valley area. ANSS funding has been limited to date; implementation of full ANSS funding will provide more than a five-fold increase in the number of new instruments that would have recorded this earthquake. Fulfilling the promise of ANSS is a high priority for the USGS.
Dense urban recording of earthquakes provides a detailed description of shaking severity, enabling rapid identification of locales of potential damage to structures toward which emergency response efforts can be directed to saving lives. After well-recorded earthquakes, analysis of the dense data sets leads to more accurate inputs to seismic design codes and practices.
From the USGS event page for nc21254601. U.S. Geological Survey text and figures are in the public domain.
How well it is located
Reviewed by a seismologist.
- Location uncertainty
- About 0.1 km horizontally, 0.3 km in depth
- Depth from
- From location
- Station coverage gap
- 30°
- Stations used
- 110
Nearest places
Distance and direction from each place to the epicenter, with its forecast.
Nearby
Within 100 km, magnitude 1.9 and up: 81 in the 60 days after this one and 32 in the 30 days before it.
After
- 2.35 km SW of Gilroy, California · 8910 days ago · 8 km deep · 1 km away
- 2.55 km SSW of Gilroy, California · 8910 days ago · 6 km deep · 0 km away
- 2.85 km SW of Gilroy, California · 8910 days ago · 6 km deep · 2 km away
- 3.25 km SSW of Gilroy, California · 8910 days ago · 7 km deep · 0 km away
- 2.010 km S of Tres Pinos, California · 8910 days ago · 9 km deep · 38 km away
- 1.95 km SSW of Gilroy, California · 8910 days ago · 6 km deep · 0 km away
- 1.96 km NNE of Milpitas, California · 8909 days ago · 1 km deep · 63 km away
- 2.134 km W of Three Rocks, California · 8904 days ago · 13 km deep · 92 km away
- 3.312 km S of Tres Pinos, California · 8904 days ago · 5 km deep · 41 km away
- 2.611 km S of Tres Pinos, California · 8904 days ago · 4 km deep · 40 km away
- 2.412 km S of Tres Pinos, California · 8903 days ago · 4 km deep · 41 km away
- 1.98 km ESE of East Foothills, California · 8903 days ago · 3 km deep · 44 km away
- 3.14 km E of Interlaken, California · 8902 days ago · 6 km deep · 7 km away
- 2.113 km WSW of Gonzales, California · 8901 days ago · 29 km deep · 58 km away
- 2.123 km NE of King City, California · 8901 days ago · 6 km deep · 88 km away
- 2.718 km SSE of Tres Pinos, California · 8900 days ago · 7 km deep · 50 km away
- 3.822 km NE of Soledad, California · 8900 days ago · 2 km deep · 62 km away
- 2.322 km NE of Soledad, California · 8898 days ago · 2 km deep · 62 km away
- 2.422 km NE of Soledad, California · 8898 days ago · 2 km deep · 62 km away
- 2.025 km ENE of Greenfield, California · 8895 days ago · 1 km deep · 79 km away
- 2.422 km NE of Soledad, California · 8895 days ago · 2 km deep · 62 km away
- 2.19 km E of Gilroy, California · 8895 days ago · 5 km deep · 13 km away
- 2.45 km SSW of Gilroy, California · 8895 days ago · 6 km deep · 1 km away
- 2.422 km NNE of Soledad, California · 8895 days ago · 2 km deep · 53 km away
- 1.95 km SSW of Gilroy, California · 8895 days ago · 6 km deep · 1 km away
- 2.223 km NE of San Lucas, California · 8895 days ago · 5 km deep · 98 km away
- 2.48 km NE of Ridgemark, California · 8894 days ago · 5 km deep · 28 km away
- 2.95 km E of Interlaken, California · 8894 days ago · 6 km deep · 7 km away
- 2.222 km NE of Soledad, California · 8894 days ago · 1 km deep · 62 km away
- 2.47 km NE of Ridgemark, California · 8894 days ago · 5 km deep · 28 km away
- 2.020 km SSE of Tres Pinos, California · 8890 days ago · 5 km deep · 51 km away
- 2.017 km SSE of Tres Pinos, California · 8889 days ago · 4 km deep · 47 km away
- 2.14 km S of Fairview, California · 8886 days ago · 1 km deep · 85 km away
- 3.222 km NE of Soledad, California · 8886 days ago · 2 km deep · 62 km away
- 2.322 km NE of Soledad, California · 8886 days ago · 2 km deep · 62 km away
- 2.012 km S of Tres Pinos, California · 8885 days ago · 5 km deep · 42 km away
- 2.46 km SSE of Gilroy, California · 8884 days ago · 4 km deep · 5 km away
- 2.32 km NNW of Aromas, California · 8884 days ago · 11 km deep · 8 km away
- 2.225 km ENE of King City, California · 8883 days ago · 10 km deep · 95 km away
- 2.324 km ENE of Soledad, California · 8883 days ago · 3 km deep · 70 km away
- 2.721 km NE of Soledad, California · 8882 days ago · 2 km deep · 62 km away
- 2.922 km NE of Soledad, California · 8882 days ago · 2 km deep · 62 km away
- 1.92 km SW of San Lorenzo, California · 8882 days ago · 3 km deep · 92 km away
- 2.722 km NE of Soledad, California · 8882 days ago · 2 km deep · 62 km away
- 2.04 km ESE of Aromas, California · 8882 days ago · 10 km deep · 11 km away
- 2.123 km NE of Greenfield, California · 8880 days ago · 5 km deep · 75 km away
- 1.96 km NNE of Milpitas, California · 8880 days ago · 0 km deep · 62 km away
- 2.37 km N of San Lucas, California · 8879 days ago · 15 km deep · 99 km away
- 2.022 km NE of Soledad, California · 8878 days ago · 3 km deep · 56 km away
- 2.322 km NE of Soledad, California · 8878 days ago · 3 km deep · 56 km away
- 2.03 km NW of San Juan Bautista, California · 8877 days ago · 7 km deep · 12 km away
- 2.0Central California · 8876 days ago · 5 km deep · 60 km away
- 1.913 km S of Tres Pinos, California · 8875 days ago · 4 km deep · 42 km away
- 2.023 km WNW of Del Monte Forest, California · 8875 days ago · 14 km deep · 64 km away
- 2.43 km WNW of San Juan Bautista, California · 8875 days ago · 5 km deep · 13 km away
- 2.124 km NE of Greenfield, California · 8875 days ago · 6 km deep · 74 km away
- 3.124 km ENE of Greenfield, California · 8874 days ago · 7 km deep · 79 km away
- 2.017 km SSE of Tres Pinos, California · 8873 days ago · 6 km deep · 48 km away
- 1.95 km NNE of Milpitas, California · 8873 days ago · 0 km deep · 62 km away
- 2.522 km NNE of Soledad, California · 8872 days ago · 8 km deep · 54 km away
The first 60 of 81.
Before
- 2.014 km E of Seven Trees, California · 8910 days ago · 2 km deep · 37 km away
- 2.08 km ENE of Milpitas, California · 8912 days ago · 5 km deep · 59 km away
- 2.329 km NE of Soledad, California · 8912 days ago · 5 km deep · 64 km away
- 2.537 km NE of King City, California · 8913 days ago · 15 km deep · 85 km away
- 2.1Central California · 8917 days ago · 7 km deep · 20 km away
- 2.1Central California · 8918 days ago · 7 km deep · 20 km away
- 2.65 km SSE of San Juan Bautista, California · 8918 days ago · 7 km deep · 20 km away
- 2.02 km NNE of Aromas, California · 8919 days ago · 5 km deep · 8 km away
- 3.22 km NE of Aromas, California · 8919 days ago · 6 km deep · 8 km away
- 2.017 km SSE of Tres Pinos, California · 8921 days ago · 4 km deep · 48 km away
- 3.15 km SSW of Gilroy, California · 8922 days ago · 4 km deep · 1 km away
- 2.03 km NE of Livermore, California · 8923 days ago · 5 km deep · 83 km away
- 2.023 km NNE of San Lucas, California · 8923 days ago · 5 km deep · 97 km away
- 2.15 km SSW of Gilroy, California · 8924 days ago · 4 km deep · 1 km away
- 3.15 km SSW of Gilroy, California · 8924 days ago · 5 km deep · 1 km away · felt by 71
- 2.318 km SSE of Tres Pinos, California · 8925 days ago · 5 km deep · 48 km away
- 2.016 km SSE of Tres Pinos, California · 8926 days ago · 4 km deep · 46 km away
- 2.516 km SSE of Tres Pinos, California · 8926 days ago · 5 km deep · 46 km away
- 1.97 km WSW of Gilroy, California · 8927 days ago · 5 km deep · 5 km away
- 2.728 km W of Three Rocks, California · 8928 days ago · 8 km deep · 93 km away
Earthquakes todayCalifornia earthquakesLive radar here
Sources
From the USGS Earthquake Hazards Program and its partner networks, event nc21254601 (also filed as ci13075448, nc40133364, usp000b49u). Read Mon, Oct 5, 2026, 12:05 PM UTC.