M4.9 earthquake 21 km NW of Zigong, China
A magnitude 4.9 earthquake struck 21 km NW of Zigong, China on Mon, Feb 25, 2019, 1:15 PM GMT+8 (05:15 UTC), 10 km (6 mi) below the surface.
Map
Where this earthquake was located, with the others nearby. Select one for its page.
The earthquake
- Magnitude
- 4.9 (mb, body-wave), light
- Magnitude from
- USGS National Earthquake Information Center
- Local time
- UTC
- 2019-02-25 05:15:59 UTC
- Depth
- 10.0 km (6.2 mi), shallow
- Epicenter
- 29.470° N, 104.609° E
- Region
- China
- Felt reports
- 1
- Strongest shaking
- VI, strong shaking
- Tsunami flag
- No
- Status
- Reviewed by a seismologist
Deaths and damage
From NOAA NCEI’s Significant Earthquake Database (record 10395), matched to this event by time and place.
- Deaths
- 2
- Injuries
- 12
- Damage
- $2 million
- Houses destroyed
- 9
- Houses damaged
- 10,911
Where the literature gives no number, NCEI records a description on a scale of 1 to 4, printed here in its words. Damage is in millions of US dollars of the year of the event, not adjusted for inflation.
From Wikipedia
The 2019 Zigong earthquake (also known as the Rongxian earthquake) occurred in Zigong, Sichuan Province, China, at about 13:15 on February 25, 2019. The epicentre was located in Rongxian County (29.48 degrees north latitude, 104.49 degrees east longitude), with a magnitude of Ms 4.9, a focal depth of about 5 km and a maximum intensity of VI. The earthquake killed two people and injured 12 others (3 of them seriously).
Text from Wikipedia, “2019 Zigong earthquake”, licensed CC BY-SA 4.0. Quoted as written; the full article has the rest.
The article is about the earthquake NOAA’s record describes, matched to this one by date, place and magnitude.
What happened
The USGS’s account of the effects of this earthquake.
Two people killed, 12 injured, 9 houses destroyed and 10,911 damaged in Rong Xian. Damage estimated at 2 million U.S. dollars.
From the USGS event page for us2000jmpz. U.S. Geological Survey text and figures are in the public domain.
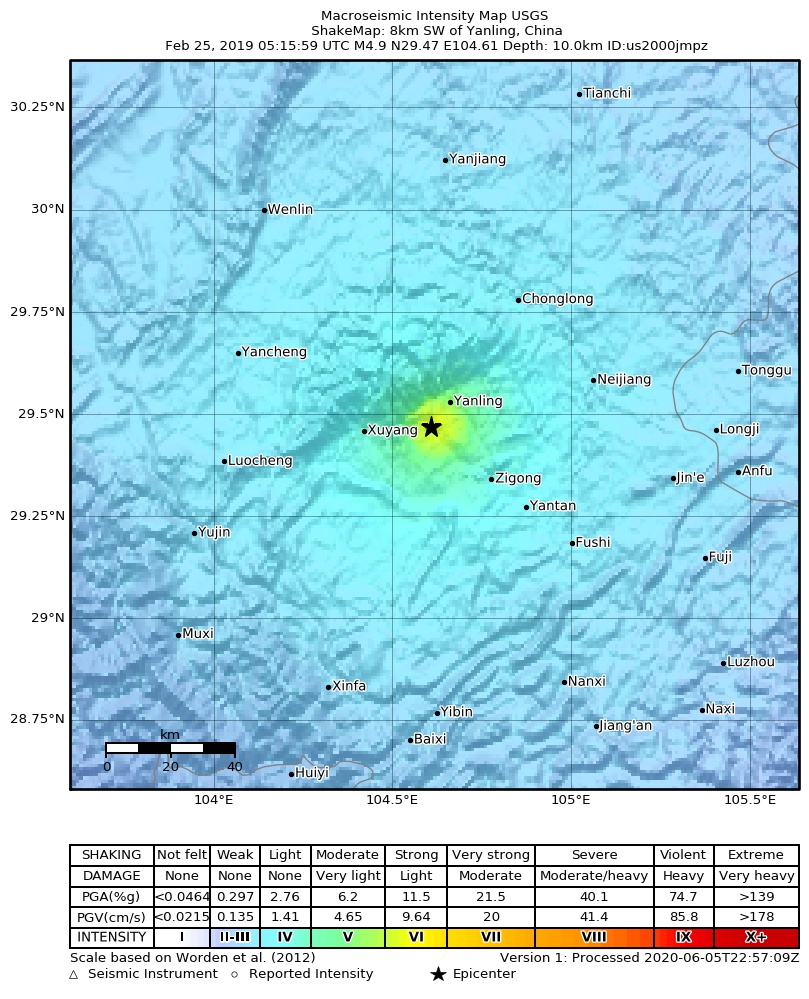
Shaking
The USGS ShakeMap: shaking estimated from seismic stations and the quake’s size, on the Modified Mercalli intensity scale.
- Strongest estimated
- VI, strong shaking
- Peak ground acceleration
- 18.2% of gravity
- Peak ground velocity
- 2.1 cm/s
- Map
- Automatic
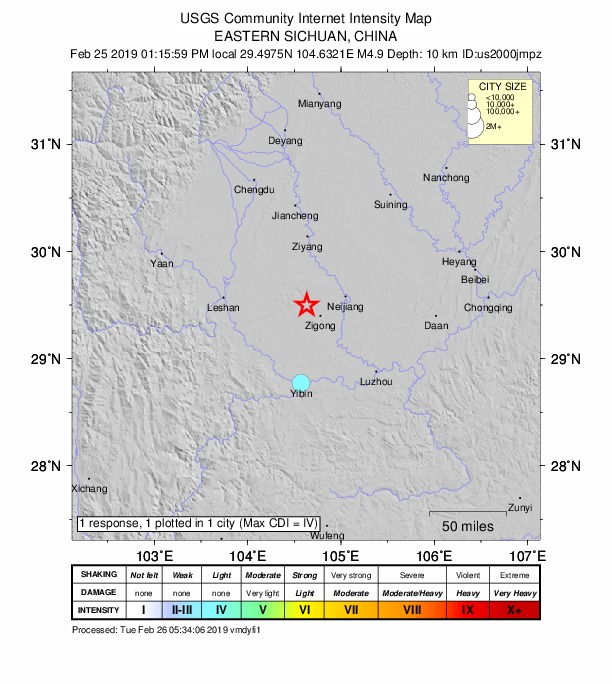
Did you feel it?
1 person reported to the USGS what they felt; the strongest reported shaking was IV, light shaking.
How well it is located
Reviewed by a seismologist.
- Location uncertainty
- About 6.7 km horizontally, 1.8 km in depth
- Magnitude uncertainty
- ±0.04
- Depth from
- Operator assigned
- Station coverage gap
- 23°
- Stations used
- 205
Nearest places
Distance and direction from each place to the epicenter, with its forecast.
Nearby
Within 100 km, magnitude 1.9 and up: 0 in the 60 days after this one and 2 in the 30 days before it.
Before
Earthquakes todayChina earthquakesLive radar here
Sources
From the USGS Earthquake Hazards Program and its partner networks, event us2000jmpz. Read Sat, Oct 3, 2026, 8:11 AM UTC.