M4.9 earthquake 56 km SSW of Nanwalek, Alaska
A magnitude 4.9 earthquake struck 56 km SSW of Nanwalek, Alaska on Fri, Apr 29, 2016, 12:17 AM AKDT (08:17 UTC), 55 km (34 mi) below the surface.
Map
Where this earthquake was located, with the others nearby. Select one for its page.
The earthquake
- Magnitude
- 4.9 (ML, local (Richter)), light
- Magnitude from
- Alaska Earthquake Center
- Local time
- UTC
- 2016-04-29 08:17:33 UTC
- Depth
- 54.5 km (33.9 mi), shallow
- Epicenter
- 58.899° N, 152.338° W
- Region
- Alaska
- Felt reports
- 12
- Strongest shaking
- IV, light shaking
- PAGER alert
- Green
- Tsunami flag
- Yes: a large quake in an oceanic region
- Status
- Reviewed by a seismologist
Magnitude estimates
Different scales measure different things and differ by a few tenths. The USGS marks one as preferred, and it is the one this page uses.
| Mag. | Scale | Computed by | Notes |
|---|---|---|---|
| 4.9 | ML, local (Richter) | Alaska Earthquake Center | Preferred · Preliminary |
| 4.7 | Mwr, regional moment | USGS National Earthquake Information Center | Reviewed · ±0.034 · 81 stations |
| 4.8 | ML, local (Richter) | NOAA National Tsunami Warning Center | Reviewed · 13 stations |
What happened
The USGS’s account of the effects of this earthquake.
Felt (III) at Homer. Also felt at Anchorage, Anchor Point and Soldotna. Felt widely on the Kenai Peninsula.
From the USGS event page for ak0165ilcttk. U.S. Geological Survey text and figures are in the public domain.
Tsunami
The USGS flags a quake this large in an oceanic region. The flag does not mean a tsunami happened; the tsunami warning centers decide that, and their messages are below when they issued any.
Current tsunami warnings: tsunami.gov. Warnings in force in the US also appear on our alerts pages.
Shaking
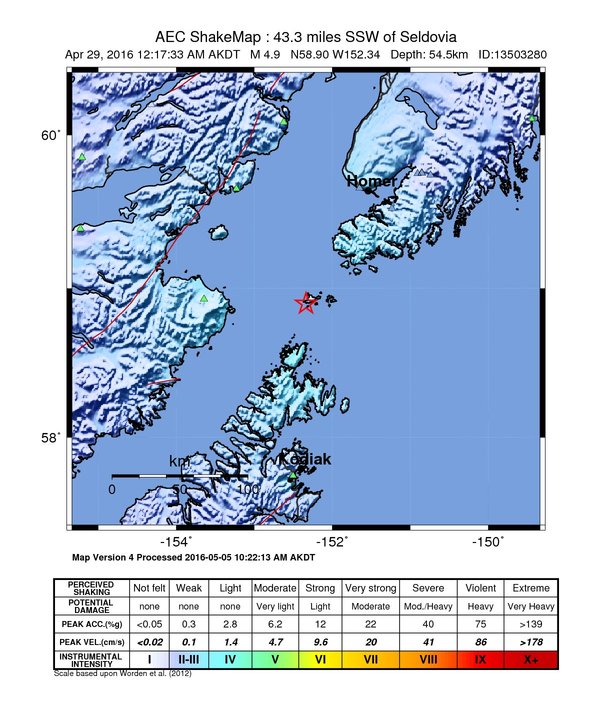
The USGS ShakeMap: shaking estimated from seismic stations and the quake’s size, on the Modified Mercalli intensity scale.
- Strongest estimated
- IV, light shaking
- Map
- Automatic
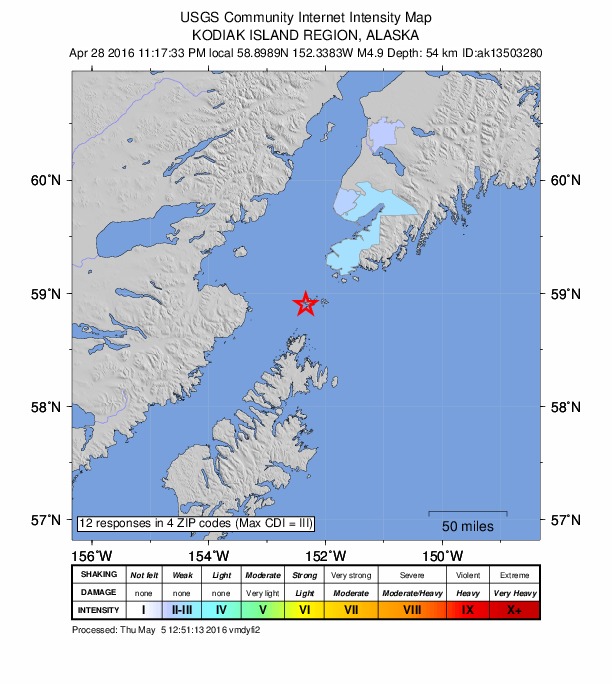
Did you feel it?
12 people reported to the USGS what they felt; the strongest reported shaking was III, weak shaking.
Estimated impact
The USGS PAGER system estimates deaths and economic losses from the shaking and the population and buildings exposed to it.
- Alert level
- Green: little or no damage or loss of life expected
Fault motion and ground failure
How the rock slipped, from the moment tensor, and the USGS estimate of landslides and liquefaction.
- Faulting
- Strike-slip
- Moment magnitude
- 4.7 Mwr
- Nodal plane 1
- Strike 65°, dip 71°, rake 26°
- Nodal plane 2
- Strike 326°, dip 66°, rake 159°
How well it is located
Reviewed by a seismologist.
- Stations used
- 217
Nearest places
Distance and direction from each place to the epicenter, with its forecast.
Nearby
Within 100 km, magnitude 1.9 and up: 45 in the 60 days after this one and 38 in the 30 days before it.
After
- 2.262 km SSW of Nanwalek, Alaska · 3811 days ago · 61 km deep · 7 km away
- 2.160 km E of Pedro Bay, Alaska · 3809 days ago · 115 km deep · 98 km away
- 2.161 km ENE of Ouzinkie, Alaska · 3809 days ago · 52 km deep · 98 km away
- 1.910 km WSW of Nanwalek, Alaska · 3808 days ago · 75 km deep · 49 km away
- 2.072 km SW of Nanwalek, Alaska · 3808 days ago · 66 km deep · 31 km away
- 2.317 km SE of Port Graham, Alaska · 3806 days ago · 51 km deep · 58 km away
- 2.172 km S of Port Graham, Alaska · 3806 days ago · 60 km deep · 47 km away
- 2.455 km WSW of Anchor Point, Alaska · 3804 days ago · 83 km deep · 87 km away
- 1.964 km ESE of Pedro Bay, Alaska · 3803 days ago · 99 km deep · 86 km away
- 2.056 km W of Nanwalek, Alaska · 3803 days ago · 83 km deep · 65 km away
- 1.976 km N of Aleneva, Alaska · 3801 days ago · 71 km deep · 50 km away
- 3.545 km WSW of Anchor Point, Alaska · 3801 days ago · 70 km deep · 80 km away
- 3.259 km ESE of Port Graham, Alaska · 3799 days ago · 29 km deep · 82 km away
- 2.015 km SSW of Nanwalek, Alaska · 3799 days ago · 53 km deep · 41 km away
- 2.265 km ESE of Pedro Bay, Alaska · 3797 days ago · 104 km deep · 83 km away
- 2.230 km NNE of Aleneva, Alaska · 3793 days ago · 5 km deep · 69 km away
- 2.453 km W of Anchor Point, Alaska · 3792 days ago · 85 km deep · 93 km away
- 1.931 km SW of Anchor Point, Alaska · 3790 days ago · 78 km deep · 80 km away
- 2.960 km ESE of Pedro Bay, Alaska · 3786 days ago · 94 km deep · 88 km away
- 1.964 km SW of Nanwalek, Alaska · 3785 days ago · 67 km deep · 25 km away
- 2.063 km NW of Aleneva, Alaska · 3785 days ago · 59 km deep · 91 km away
- 2.151 km WSW of Anchor Point, Alaska · 3783 days ago · 87 km deep · 88 km away
- 2.650 km SW of Nanwalek, Alaska · 3783 days ago · 60 km deep · 14 km away
- 2.492 km NW of Aleneva, Alaska · 3782 days ago · 16 km deep · 86 km away
- 2.652 km SE of Pope-Vannoy Landing, Alaska · 3781 days ago · 126 km deep · 92 km away
- 2.157 km WSW of Anchor Point, Alaska · 3780 days ago · 111 km deep · 87 km away
- 4.167 km SE of Pope-Vannoy Landing, Alaska · 3779 days ago · 103 km deep · 84 km away
- 3.259 km ESE of Pedro Bay, Alaska · 3776 days ago · 111 km deep · 91 km away
- 1.968 km SW of Nanwalek, Alaska · 3772 days ago · 63 km deep · 34 km away
- 2.252 km SW of Nanwalek, Alaska · 3772 days ago · 58 km deep · 16 km away
- 2.359 km ESE of Pope-Vannoy Landing, Alaska · 3770 days ago · 116 km deep · 84 km away
- 2.158 km WNW of Nanwalek, Alaska · 3769 days ago · 85 km deep · 76 km away
- 2.339 km SSW of Nanwalek, Alaska · 3769 days ago · 53 km deep · 18 km away
- 3.324 km NNW of Aleneva, Alaska · 3768 days ago · 53 km deep · 80 km away
- 2.316 km NNE of Aleneva, Alaska · 3767 days ago · 47 km deep · 83 km away
- 1.918 km WSW of Anchor Point, Alaska · 3766 days ago · 56 km deep · 89 km away
- 3.514 km WSW of Anchor Point, Alaska · 3762 days ago · 82 km deep · 92 km away · felt by 1
- 2.359 km SSE of Halibut Cove, Alaska · 3761 days ago · 33 km deep · 83 km away
- 2.931 km SW of Anchor Point, Alaska · 3760 days ago · 63 km deep · 79 km away
- 2.655 km SSE of Pedro Bay, Alaska · 3759 days ago · 113 km deep · 88 km away
- 2.568 km SSW of Nanwalek, Alaska · 3756 days ago · 58 km deep · 14 km away
- 1.961 km ESE of Pope-Vannoy Landing, Alaska · 3756 days ago · 114 km deep · 81 km away
- 2.014 km SW of Nanwalek, Alaska · 3755 days ago · 64 km deep · 44 km away
- 1.984 km NNW of Aleneva, Alaska · 3753 days ago · 13 km deep · 80 km away
- 2.071 km WSW of Nanwalek, Alaska · 3751 days ago · 69 km deep · 51 km away
Before
- 1.961 km SE of Pedro Bay, Alaska · 3811 days ago · 116 km deep · 81 km away
- 2.376 km NNE of Aleneva, Alaska · 3812 days ago · 43 km deep · 23 km away
- 2.523 km W of Anchor Point, Alaska · 3813 days ago · 66 km deep · 96 km away
- 2.115 km W of Anchor Point, Alaska · 3814 days ago · 63 km deep · 96 km away
- 3.035 km N of Aleneva, Alaska · 3815 days ago · 55 km deep · 66 km away
- 2.555 km W of Anchor Point, Alaska · 3816 days ago · 92 km deep · 97 km away
- 2.051 km SE of Pope-Vannoy Landing, Alaska · 3816 days ago · 108 km deep · 92 km away
- 1.945 km WSW of Anchor Point, Alaska · 3816 days ago · 80 km deep · 80 km away
- 2.463 km WSW of Nanwalek, Alaska · 3817 days ago · 89 km deep · 53 km away
- 2.220 km SSW of Nanwalek, Alaska · 3818 days ago · 56 km deep · 36 km away
- 2.850 km ESE of Pedro Bay, Alaska · 3819 days ago · 114 km deep · 99 km away
- 2.245 km SE of Pedro Bay, Alaska · 3819 days ago · 119 km deep · 96 km away
- 1.920 km W of Anchor Point, Alaska · 3822 days ago · 69 km deep · 96 km away
- 1.970 km NNW of Aleneva, Alaska · 3822 days ago · 10 km deep · 68 km away
- 3.138 km WSW of Nanwalek, Alaska · 3823 days ago · 63 km deep · 37 km away
- 1.936 km N of Aleneva, Alaska · 3823 days ago · 63 km deep · 65 km away
- 2.274 km SE of Pope-Vannoy Landing, Alaska · 3823 days ago · 104 km deep · 71 km away
- 2.165 km SE of Pedro Bay, Alaska · 3823 days ago · 93 km deep · 76 km away
- 2.250 km W of Nanwalek, Alaska · 3824 days ago · 79 km deep · 50 km away
- 2.072 km NNW of Aleneva, Alaska · 3825 days ago · 87 km deep · 74 km away
Earthquakes todayAlaska earthquakesLive radar here
Sources
From the USGS Earthquake Hazards Program and its partner networks, event ak0165ilcttk (also filed as ak13503280, at00o6dz18, us10005ceb). Read Sun, Oct 4, 2026, 10:34 PM UTC.