Rhode Island Plant Hardiness Zones
Rhode Island’s towns run from zone 6b to zone 7b: the average coldest winter night is 7.7°F at New Shoreham and -3.2°F at Foster.
Hardiness zones in Rhode Island
In USDA’s colors, neighboring states washed out. Zones follow elevation, coasts and cities down to half a mile. Drawn by WeatherOverTime from the USDA-ARS and Oregon State University PRISM Climate Group 2023 GIS data; this is not the official USDA Plant Hardiness Zone Map.
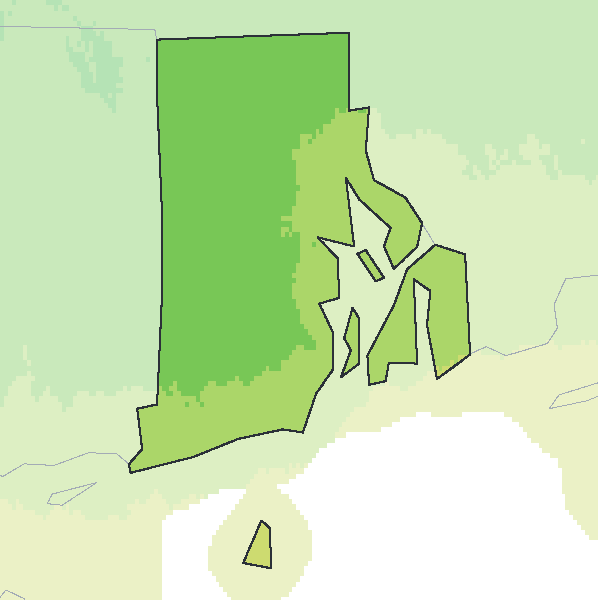
- 6b
- 7a
- 7b
Towns by zone
Each town’s 1991-2020 average annual extreme minimum at its center, read from the map’s 800 m grid. Warmest zone first.
7b Zone 7b, 5 to 10°F 1 towns
7a Zone 7a, 0 to 5°F 28 towns
- Ashaway0.4°F
- Barrington2.4°F
- Bradford0.5°F
- Bristol2.5°F
- Charlestown2.4°F
- Cranston1.8°F
- East Greenwich0.7°F
- East Providence1.7°F
- Jamestown3.6°F
- Kingston0.3°F
- Melville2.6°F
- Middletown2.9°F
- Narragansett2.6°F
- Narragansett Pier2.6°F
- Newport4.5°F
- Newport East3.6°F
- North Kingstown0.2°F
- North Providence0°F
- Pawtucket0.4°F
- Portsmouth2.6°F
- Providence2°F
- South Kingstown1.3°F
- Tiverton3°F
- Wakefield-Peacedale1.5°F
- Warren2°F
- Warwick2.1°F
- West Warwick0.1°F
- Westerly1.9°F
6b Zone 6b, -5 to 0°F 23 towns
- Carolina-0.4°F
- Central Falls-0.1°F
- Chepachet-3°F
- Coventry-2°F
- Cumberland-1.8°F
- Cumberland Hill-1.6°F
- Exeter-0.9°F
- Foster-3.2°F
- Greene-2.7°F
- Greenville-1.6°F
- Harmony-2.7°F
- Harrisville-3.1°F
- Hope Valley-0.7°F
- Hopkinton-0.4°F
- Johnston-0.3°F
- Lincoln-1.3°F
- North Scituate-1.8°F
- North Smithfield-2.3°F
- Pascoag-3.1°F
- Smithfield-1.9°F
- Valley Falls-0.7°F
- West Greenwich-1.8°F
- Woonsocket-2°F
Counties
At the county’s center; a county with hills or a coast spans several zones.
| County | Zone at the center | Average coldest night |
|---|---|---|
| Bristol County | 7a | 2.4°F |
| Kent County | 6b | -0.8°F |
| Newport County | 7a | 4°F |
| Providence County | 6b | -1.9°F |
| Washington County | 7a | 1.9°F |
The zones
A plant hardiness zone is set by the average of each winter’s single coldest temperature, 1991 to 2020: zones are 10°F apart and each half zone, a and b, 5°F. It says how cold a winter night usually gets, not the coldest it has ever been, and nothing about summer heat, rain or soil. Plant labels give the coldest zone a perennial survives in.
| Zone | Average coldest night | In Celsius |
|---|---|---|
| 6b | -5 to 0°F | -20.6 to -17.8°C |
| 7a | 0 to 5°F | -17.8 to -15.0°C |
| 7b | 5 to 10°F | -15.0 to -12.2°C |
Sources
Hardiness zones: USDA Plant Hardiness Zone Map, 2023, Agricultural Research Service, U.S. Department of Agriculture, from the GIS data of the PRISM Climate Group, Oregon State University, which may be freely reproduced and redistributed. Drawn by WeatherOverTime from the USDA-ARS and Oregon State University PRISM Climate Group 2023 GIS data; this is not the official USDA Plant Hardiness Zone Map.